. 2021 Mar 1;131(5):e140853.
doi: 10.1172/JCI140853.

Tetracyclines improve experimental lymphatic filariasis pathology by disrupting interleukin-4 receptor-mediated lymphangiogenesis

Affiliations

Tetracyclines improve experimental lymphatic filariasis pathology by disrupting interleukin-4 receptor-mediated lymphangiogenesis

Julio Furlong-Silva et al. J Clin Invest. .

Abstract

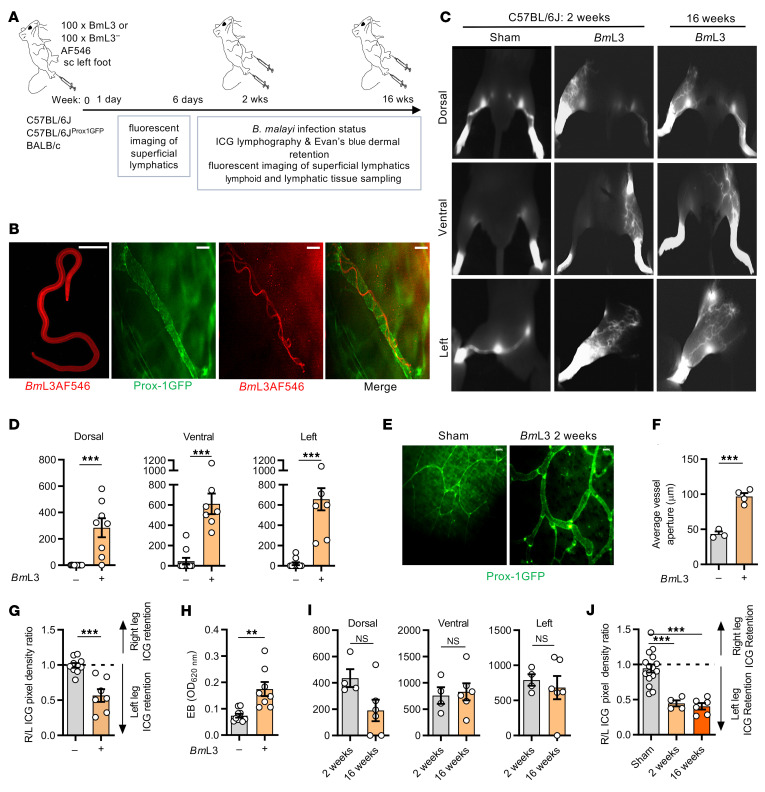
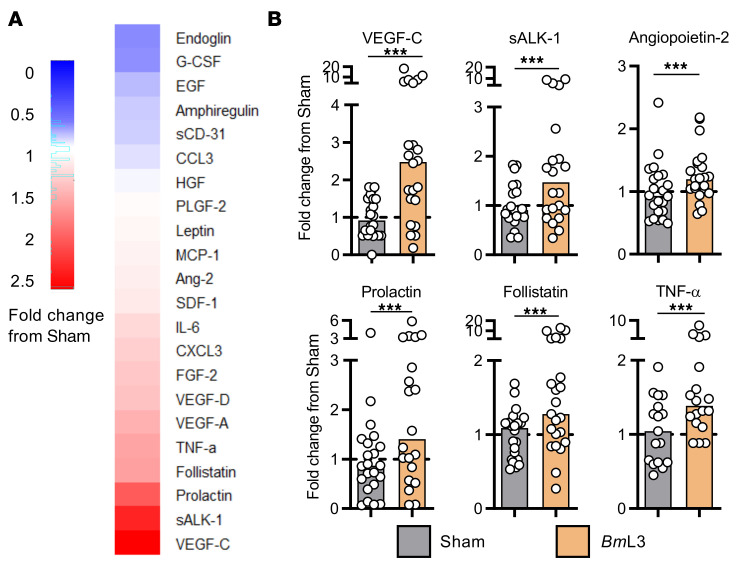
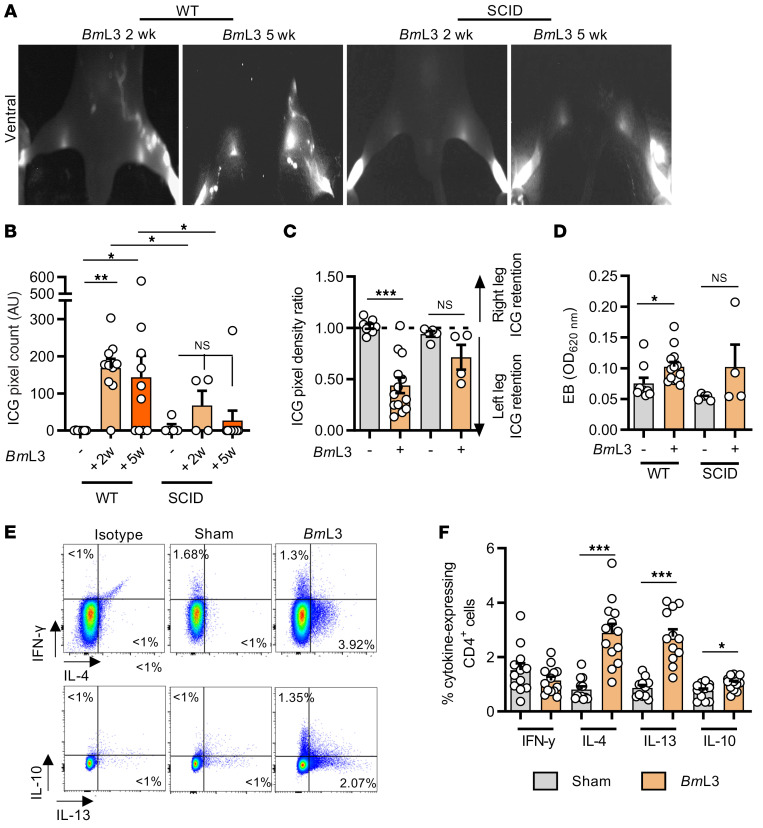
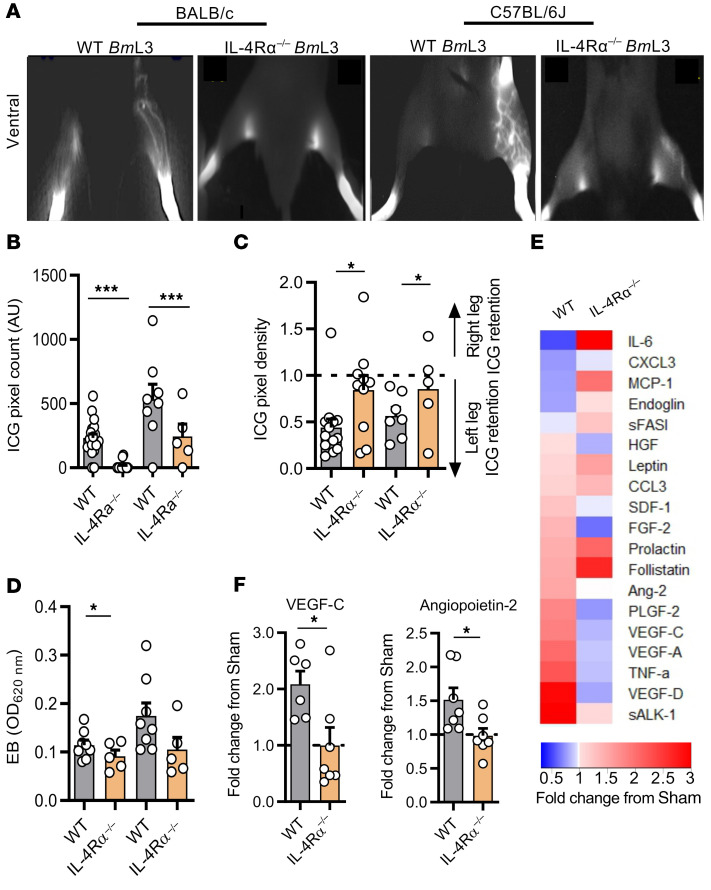
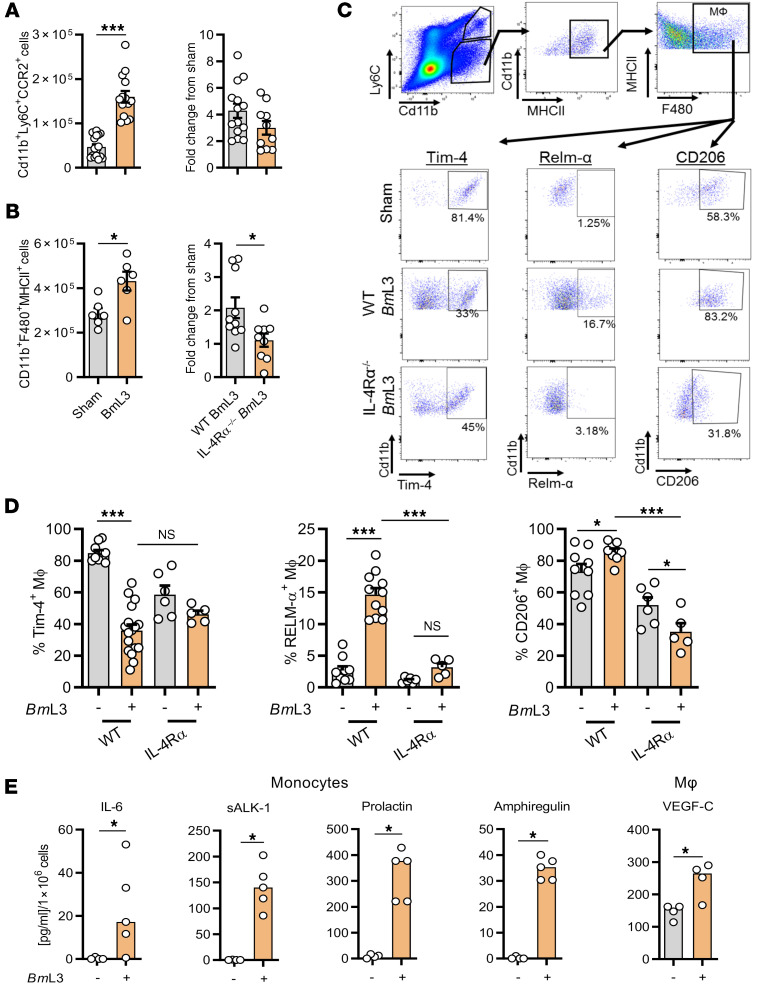
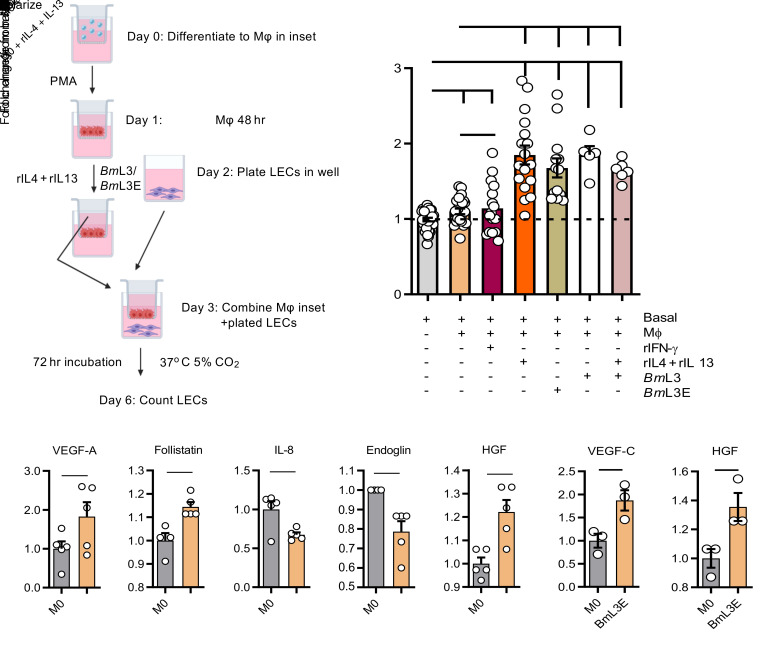
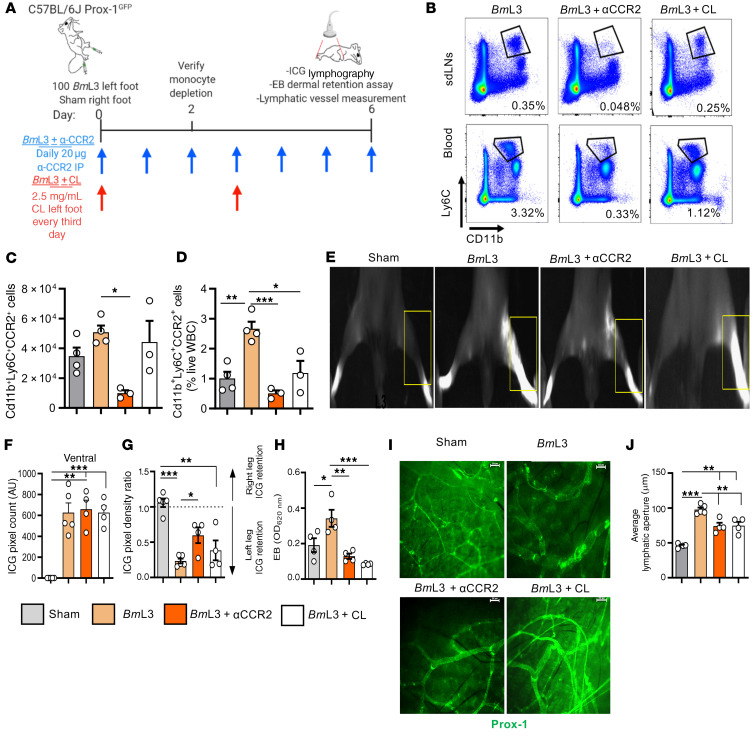
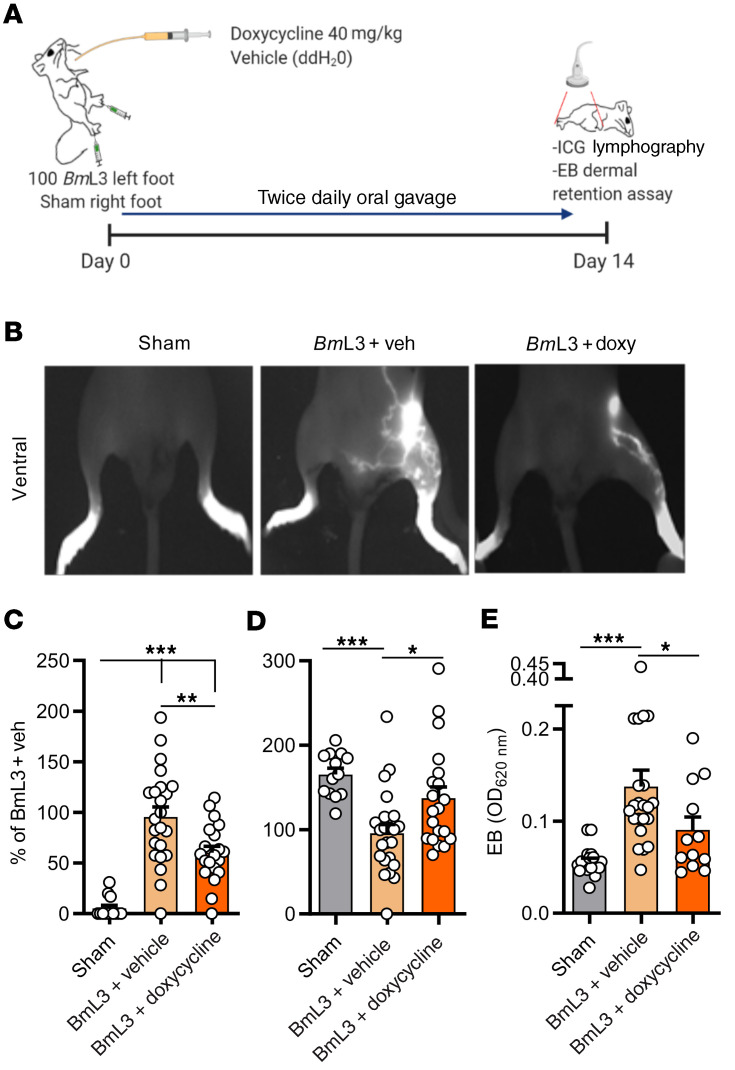
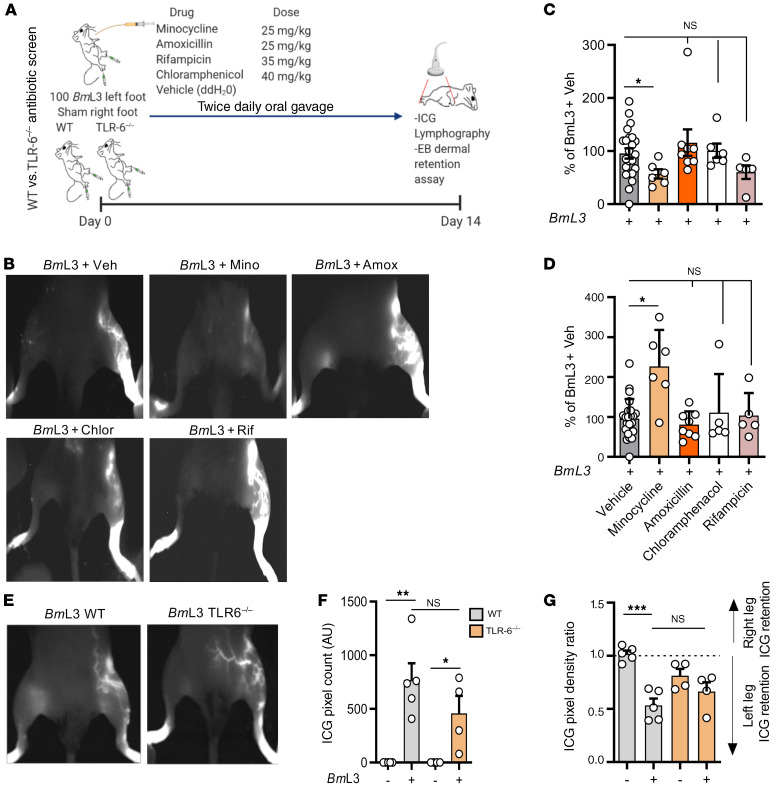
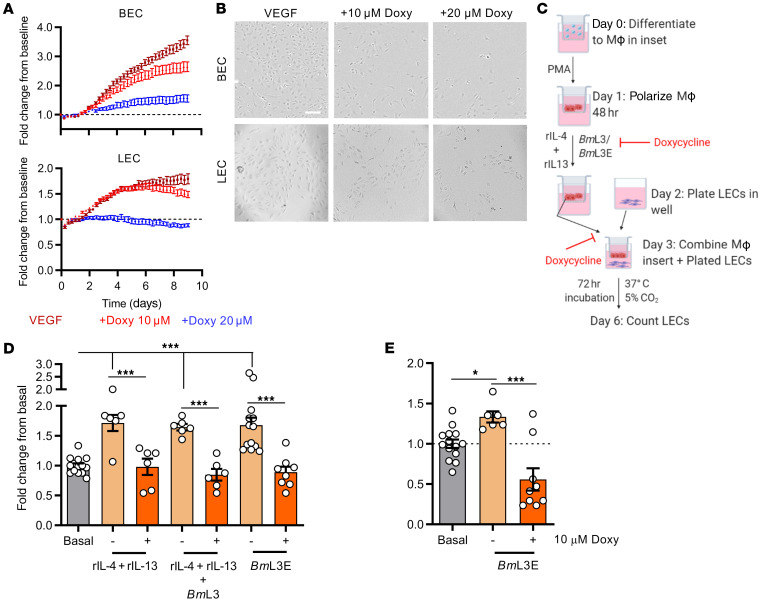
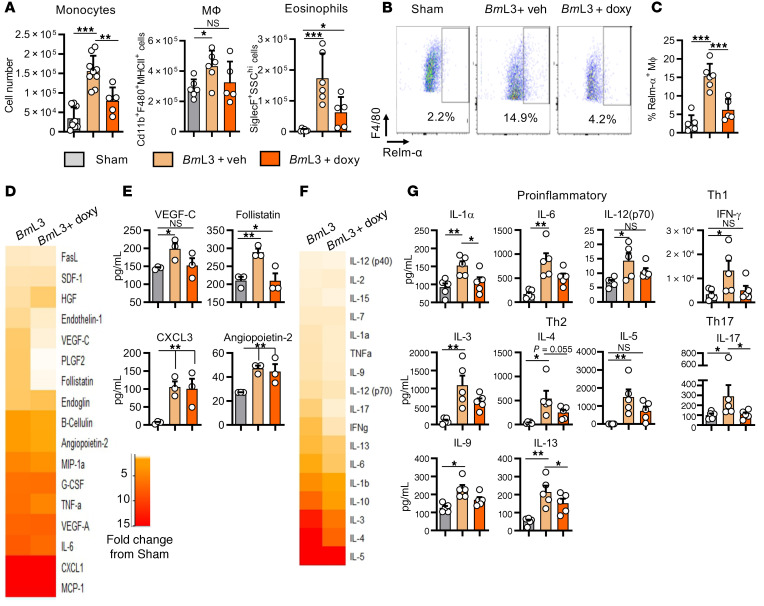
Lymphatic filariasis is the major global cause of nonhereditary lymphedema. We demonstrate that the filarial nematode Brugia malayi induced lymphatic remodeling and impaired lymphatic drainage following parasitism of limb lymphatics in a mouse model. Lymphatic insufficiency was associated with elevated circulating lymphangiogenic mediators, including vascular endothelial growth factor C. Lymphatic insufficiency was dependent on type 2 adaptive immunity, the interleukin-4 receptor, and recruitment of C-C chemokine receptor-2-positive monocytes and alternatively activated macrophages with a prolymphangiogenic phenotype. Oral treatments with second-generation tetracyclines improved lymphatic function, while other classes of antibiotic had no significant effect. Second-generation tetracyclines directly targeted lymphatic endothelial cell proliferation and modified type 2 prolymphangiogenic macrophage development. Doxycycline treatment impeded monocyte recruitment, inhibited polarization of alternatively activated macrophages, and suppressed T cell adaptive immune responses following infection. Our results determine a mechanism of action for the antimorbidity effects of doxycycline in filariasis and support clinical evaluation of second-generation tetracyclines as affordable, safe therapeutics for lymphedemas of chronic inflammatory origin.

Keywords: Infectious disease; Inflammation; Lymph; Parasitology; Th2 response.


Conflict of interest statement

Conflict of interest: The authors have declared that no conflict of interest exists.

Figures

Figure 1
Figure 1. Filarial lymphatic infection induces persistent lymphatic pathology.
(A) Schematic of hind-limb filarial infection model. (B) Representative images of in vitro (left panel) or intralymphatic Alexa Fluor 546–labeled (AF546) BmL3 larvae in C57BL/6J Prox-1GFP mice, 1 dpi. Scale bars: 20 μm. (C) Representative PDE intravital images of sham-infected and BmL3-infected C57BL/6J mice, 14 dpi. (D) Quantified aberrant lymphatics from PDE imaging (n = 10 sham, n = 8 BmL3). (E) Representative epifluorescence micrographs of dermal lymphatics and (F) average dermal lymphatic vessel aperture in Prox-1GFP mice 14 dpi (n = 3 Sham, n = 4 BmL3). Scale bars: 200 μm. (G) Quantified hind-limb ICG dye retention from PDE imaging expressed as a ratio of fluorescence in the right (R, uninfected) vs. the left (L, infected) hind limb (n = 10 sham, n = 8 BmL3). (H) Evan’s blue left-hind-limb dermal retention (n = 9 sham, n = 8 BmL3). (I) Aberrant lymphatics and (J) hind-limb ICG retention comparing 2- and 16-week-old infections (n = 15 sham, n = 4 BmL3 at 2 weeks after infection, n = 4 at 16 weeks after infection). Histograms show the mean ± SEM. Data were pooled from 2–3 individual experiments (D and GJ) or 1 experiment (F). **P < 0.01, ***P < 0.001 by 2-tailed Student’s t test (D and FI) or 1-way ANOVA with Tukey’s multiple-comparison post hoc test (J). NS, not significant.
Figure 2
Figure 2. Filarial infection induces increases in circulating lymphangiogenic molecules.
(A) Circulating levels of lymphangiogenic molecules. Heatmap plots median fold-change in analyte from sham-infected mouse group; red = fold-increase from sham-infected, blue = fold-decrease (n = 21 sham; n = 22 BmL3). (B) Circulating lymphangiogenic molecule concentrations from A for analytes achieving statistical significance. Histograms show the medians. Data were pooled from 4 individual experiments. ***P < 0.001 by Mann-Whitney test.
Figure 3
Figure 3. Filaria-associated lymphatic pathology is dependent on type 2 adaptive immunity.
(A) Representative PDE intravital images and (B) aberrant lymphatic quantification of WT BALB/c and SCID mice at 2 and 5 weeks postinfection (wpi) (n = 8 WT sham, n = 10 WT BmL3 at 2 wpi and 5 wpi, n = 5 SCID sham, n = 4 SCID BmL3 at 2 wpi, n = 10 SCID BmL3 at 5 wpi). (C) Hind-limb ICG dye retention and (D) Evan’s blue left-hind-limb dermal retention in WT and SCID mice, 14 dpi (n = 7 WT sham, n = 14 WT BmL3, n = 5 SCID sham, n = 4 SCID BmL3). (E) Representative flow cytometry plots and (F) quantified cytokine production within sdLN CD4+ T cells from C57BL/6J mice, 14 dpi (n = 12 sham, n = 13 BmL3). Data are cytokine-expressing cells as a proportion of total CD4+ T cells. Histograms show the mean ± SEM. Data were pooled from 2 individual experiments (B and F) or a single experiment (D). *P < 0.05, **P < 0.01, ***P < 0.001 by 1-way ANOVA with Tukey’s multiple-comparison post hoc test between marked groups. NS, not significant.
Figure 4
Figure 4. Filaria-associated lymphatic pathology is dependent on IL-4 receptor immune responses.
(A) Representative images, (B) quantified aberrant lymphatics, and (C) quantified hind-limb ICG dye retention in WT and IL-4Rα–/– BALB/c and C57BL/6J mice, 14 dpi (n = 20 WT BALB/c sham, n = 21 WT BALB/c BmL3, n = 8 IL-4Rα–/– BALB/c sham, n = 15 IL-4Rα–/– BALB/c BmL3, n = 10 WT C57BL/6J sham, n = 10 WT C57BL/6J BmL3, n = 5 IL-4Rα–/– sham and IL-4Rα–/– BmL3). (D) Evan’s blue left-hind-limb dermal retention in WT and IL-4Rα–/–mice, 14 dpi (n = 8 WT BALB/c BmL3, n = 5 IL-4Rα–/– BALB/c BmL3, n = 8 WT C57BL/6J BmL3, n = 5 IL-4Rα–/– sham and IL-4Rα–/– BmL3). (E) Comparison of circulating levels of lymphangiogenic molecules between WT C57BL/6J WT and IL-4Rα–/– BmL3-infected mice, 14 dpi. Heatmap plots median fold-change in analyte from sham-infected mouse group; red = fold-increase from sham-infected, blue = fold-decrease (n = 6 WT BmL3, n = 7 IL-4Rα–/– BmL3). (F) Plots of lymphangiogenic analytes achieving statistical significance. Histograms show the mean ± SEM. Data were pooled from 2–3 individual experiments. *P < 0.05, ***P < 0.001 by 1-way ANOVA with Tukey’s multiple-comparison post hoc test (BD) or 2-tailed Student’s t test between marked groups (F).
Figure 5
Figure 5. BmL3 infection drives lymphatic monocyte recruitment and expansion of alternatively activated, prolymphangiogenic macrophages.
(A) Numbers of CD11b+Ly6C+CCR2+ inflammatory monocytes (n = 16 sham, n = 14 WT BmL3, n = 10 IL-4Rα–/– BmL3) or (B) Cd11b+F4/80+MHCII+ MΦs (n = 6 sham, n = 10 WT BmL3; n = 9 IL-4Rα–/– BmL3) derived from sdLNs and major lymphatic channels in C57BL/6J mice, 14 dpi. Data are total cell numbers or fold-change from relevant sham controls. (C) Representative flow plots of lymphatic MФ phenotyping in sham- and BmL3-infected mice. Percentages are proportions of total CD11b+F4/80+MHCII+ MΦs. (D) CD206+, RELM-α+, and Tim-4+ MΦ expression in WT and IL-4Rα–/– sham- and BmL3-infected mice (n = 9 WT sham, n = 9–17 WT BmL3, n = 6 IL-4Rα–/– sham, n = 5 IL-4Rα–/– BmL3). (E) Significant changes in specific lymphangiogenic molecules secreted following 72-hour ex vivo incubation of FACS-isolated lymphatic monocytes or MΦs derived from sham- or BmL3-infected mice. Secretion is normalized to analyte concentration/1 × 106 cells (n = 4 sham, n = 5 BmL3). Data were pooled from 2–3 individual experiments. Histograms show the mean ± SEM (AD) or median (E). *P < 0.05, ***P < 0.001 by 2-tailed Student’s t test (A and B), 1-way ANOVA with Tukey’s multiple-comparison post hoc test (D), or Mann-Whitney test (E). NS, not significant.
Figure 6
Figure 6. Human monocyte–derived MΦs conditioned with rIL-4 +rIL-13 and/or filarial BmL3 results in a lymphangiogenic phenotype that induces proliferation of lymphatic endothelium.
(A) Schematic of in vitro human dermal lymphatic endothelial cells (LECs) cocultured with preconditioned human monocyte–derived MΦs. LEC proliferation was quantified 72 hours after addition of MΦ cocultures. (B) LEC proliferation following monocyte-derived-MΦ cocultures conditioned with recombinant IL-4 and IL-13 (rIL-4+rIL-13), live BmL3 (BmL3), BmL3 larval extract (BmL3E), rIL+4+rIL-13+BmL3, or unconditioned MΦs, expressed as fold-change from mean basal LEC enumerations. (C) Concentrations of lymphangiogenic molecules 72 hours after MΦ culture in the absence or presence of rIL-4+rIL-13 or (D) BmL3E (MΦ+BmL3E), expressed as fold-change from mean unstimulated MΦ levels (M0 = unstimulated THP-1–differentiated MΦs). Histograms show the mean ± SEM. Data were pooled from 3 individual experiments (A and B) or a single experiment (C and D). *P < 0.05, ***P < 0.001 by 1-way ANOVA with Tukey’s multiple-comparison post hoc test (B) or 2-tailed Student’s t test between indicated groups (C and D). NS, not significant.
Figure 7
Figure 7. Depletion of CCR2+ monocytes or phagocytes significantly ameliorates filaria-induced lymphatic insufficiency.
(A) Schematic of CCR2+ monocyte and phagocyte depletion regimens in BmL3-infected C57BL/6J Prox-1GFP mice. (B) Representative flow cytometry plots from BmL3-infected mice or BmL3-infected mice treated with either anti-CCR2 ablating antibody (BmL3+αCCR2) or clodronate liposomes (BmL3+CL), 2 dpi. Percentages are CD11b+Ly6C+ cells as a proportion of live cells. (C) CD11b+Ly6C+CCR2+ inflammatory monocytes isolated from hind-limb lymphatic tissues or (D) blood, derived from sham, BmL3, BmL3+αCCR2, or BmL3+CL mice, 2 dpi. Data in D are reported as proportions of total white blood cells (WBC) (n = 4 sham and BmL3, n = 3 BmL3+αCCR2 and BmL3+CL). (E) Representative PDE images of sham, BmL3, BmL3+αCCR2, and BmL3+CL mice, 6 dpi. Yellow boxes highlight ICG retention (F) aberrant lymphatics, (G) hind-limb ICG retention, and (H) Evan’s blue dermal retention in sham, BmL3, BmL3+αCCR2, and BmL3+CL mice, 6 dpi (n = 5 sham and BmL3, n = 4 BmL3+αCCR2 and BmL3+CL). (I) Representative epifluorescence images of lymphatic vessels and (J) average lymphatic vessel aperture in sham, BmL3, BmL3+αCCR2, and BmL3+CL mice, 6 dpi (n = 5 sham and BmL3, n = 4 BmL3+αCCR2 and BmL3+CL). Scale bars: 200 μm. Data are from a single experiment. Histograms show the mean ± SEM. *P < 0.05, **P < 0.01, ***P < 0.001 by 1-way ANOVA with Tukey’s multiple-comparison post hoc test.
Figure 8
Figure 8. Doxycycline administration significantly ameliorates filarial lymphatic pathology.
(A) Schematic of doxycycline intervention in BmL3-infected C57BL/6J mice. (B) Representative images, (C) aberrant lymphatics, (D) hind-limb ICG dye retention in sham, BmL3+vehicle, or BmL3+doxycycline–treated mice, 14 dpi (n = 13 sham, n = 23 BmL3+vehicle, n = 20 BmL3+doxycycline). Data plotted as percentage change normalized to mean values of the BmL3+vehicle control group in order to compare data pooled from independent experiments. (E) Evan’s blue dermal retention from left-hind-limb skin (n = 18 sham; n = 21 BmL3+vehicle; n = 11 BmL3+doxycycline). Data were pooled from 3 individual experiments. Histograms show the mean ± SEM. *P < 0.05, **P < 0.01, ***P < 0.001 by 1-way ANOVA with Tukey’s multiple-comparison post hoc test.
Figure 9
Figure 9. Doxycycline-mediated amelioration of filarial lymphatic pathology is independent of general antibiotic or anti-Wolbachia activity.
(A) Schematic for antibiotic screen and Toll-like receptor 6 knockout (TLR6–/–) experiments in BmL3-infected C57BL/6J mice. (B) Representative examples of PDE intravital imaging, (C) aberrant lymphatics, and (D) ICG hind-limb retention in BmL3-infected mice treated twice daily with vehicle (BmL3+Veh), minocycline (BmL3+Mino), amoxicillin (BmL3+Amox), chloramphenicol (BmL3+Chlor), or rifampicin (BmL3+Rif), 14 dpi (n = 23 BmL3+Veh, n = 6 BmL3+Mino, n = 8 BmL3+Amox, n = 6 BmL3+Chlor, n = 5 BmL3+Rif). Data are percentage change normalized to mean of BmL3+Veh mice in order to compare data pooled from independent experiments. (E) Representative examples of PDE intravital imaging, (F) aberrant lymphatics, and (G) ICG hind-limb retention in WT or TLR6–/– BmL3–infected mice or corresponding sham-infection controls, 14 dpi (n = 5 WT and TLR6–/– sham; n = 4 WT+BmL3; n = 6 TLR-6–/–+BmL3). Data were pooled from 2 individual experiments (BmL3+Amox in C and D) or a single experiment (BmL3+Mino, BmL3+Chlor, BmL3+Rif groups in C, D, F, and G). Histograms show the mean ± SEM. *P < 0.05, **P < 0.01, ***P < 0.001 by 1-way ANOVA with Tukey’s multiple-comparison post hoc test. NS, not significant.
Figure 10
Figure 10. Doxycycline inhibits LEC proliferation directly and via impairment of type 2 or filaria-conditioned prolymphangiogenic MΦs.
(A) BEC and LEC 9-day proliferation tracking following stimulation with 2 ng/mL VEGF, with or without 10 or 20 μM doxycycline. Data are fold-changes from initial BEC and LEC confluence. (B) Representative images of BEC and LEC confluence at endpoint. Scale bar: 500 μm. (C) Schematic of MΦ-LEC coculture indicating where doxycycline was added. (D) LEC enumeration following coculture with MΦs preconditioned with rIL-4+rIL-13, rIL-4+rIL-13+BmL3, or BmL3 extract (BmL3E) with or without 10 μM doxycycline. (E) LEC enumeration following coculture with MΦs preconditioned with BmL3E with or without 10 μM doxycycline. Histograms show the mean ± SEM. Data were derived from a single experiment (A) or pooled from 2 individual experiments (D and E). *P < 0.05, ***P < 0.001 by 1-way ANOVA with Tukey’s multiple-comparison post hoc test.
Figure 11
Figure 11. Doxycycline ameliorates filarial lymphatic pathology by modulation of IL-4R–dependent inflammatory lymphangiogenesis.
(A) Immune cell populations from sdLNs and surrounding lymphatics from C57BL/6J sham- or BmL3-infected mice treated with vehicle or 40 mg/kg doxycycline twice daily, 14 dpi. (B) Representative flow cytometry plots and (C) MФ expression of RELM-α (n = 6 sham and BmL3+Veh, n = 5 BmL3+doxycycline). Cells were gated on live CD11b+MHCII+F4/80+ cells. Data are RELM-α+ MΦs as a proportion of total MΦs. (D) Proteomic array of lymphangiogenic molecules in 72-hour cell cultures derived from sdLNs and lymphatic tissues, 14 dpi. Heatmap orange and red depict increasing fold-change compared with the mean of sham-infected mice. (E) Lymphangiogenic molecules attaining statistical significance; data plotted per mouse (n = 3 sham, BmL3, and BmL3+doxycycline). (F) Proteomic array of cytokine levels in splenocyte cultures 72 hours after polyclonal restimulation with anti-CD3/anti-CD28 antibodies. Heatmap orange and red depict increasing fold-change compared with the mean of sham-infected mice. (G) Cytokine concentrations attaining statistical significance, grouped under type of adaptive immune response; data plotted per mouse (n = 5 sham, BmL3, and BmL3+doxycycline). Histograms show the mean ± SEM. Data were pooled from 2 individual experiments (A and C) or derived from a single experiment (E and G). *P < 0.05, **P < 0.01, ***P < 0.001 by 1-way ANOVA with Tukey’s multiple-comparison post hoc test. NS, not significant.

Similar articles

Cited by

References

    1. Rockson SG, Rivera KK. Estimating the population burden of lymphedema. Ann N Y Acad Sci. 2008;1131(1):147–154. doi: 10.1196/annals.1413.014. - DOI - PubMed
    1. Grada AA, Phillips TJ. Lymphedema: pathophysiology and clinical manifestations. J Am Acad Dermatol. 2017;77(6):1009–1020. doi: 10.1016/j.jaad.2017.03.022. - DOI - PubMed
    1. Mortimer PS, Rockson SG. New developments in clinical aspects of lymphatic disease. J Clin Invest. 2014;124(3):915–921. doi: 10.1172/JCI71608. - DOI - PMC - PubMed
    1. Ramaiah KD, Ottesen EA. Progress and impact of 13 years of the global programme to eliminate lymphatic filariasis on reducing the burden of filarial disease. PLoS Negl Trop Dis. 2014;8(11):e3319. doi: 10.1371/journal.pntd.0003319. - DOI - PMC - PubMed
    1. Ton TGN, et al. The burden of mental health in lymphatic filariasis. Infect Dis Poverty. 2015;4(1):34. doi: 10.1186/s40249-015-0068-7. - DOI - PMC - PubMed

Publication types

MeSH terms