Mast Cells Promote Nonalcoholic Fatty Liver Disease Phenotypes and Microvesicular Steatosis in Mice Fed a Western Diet
- PMID: 33434322
- PMCID: PMC9271361
- DOI: 10.1002/hep.31713
Mast Cells Promote Nonalcoholic Fatty Liver Disease Phenotypes and Microvesicular Steatosis in Mice Fed a Western Diet
Abstract
Background and aims: Nonalcoholic fatty liver disease (NAFLD) is simple steatosis but can develop into nonalcoholic steatohepatitis (NASH), characterized by liver inflammation, fibrosis, and microvesicular steatosis. Mast cells (MCs) infiltrate the liver during cholestasis and promote ductular reaction (DR), biliary senescence, and liver fibrosis. We aimed to determine the effects of MC depletion during NAFLD/NASH.
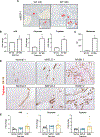
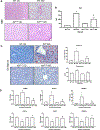
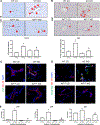
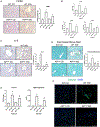
Approach and results: Wild-type (WT) and KitW-sh (MC-deficient) mice were fed a control diet (CD) or a Western diet (WD) for 16 weeks; select WT and KitW-sh WD mice received tail vein injections of MCs 2 times per week for 2 weeks prior to sacrifice. Human samples were collected from normal, NAFLD, or NASH mice. Cholangiocytes from WT WD mice and human NASH have increased insulin-like growth factor 1 expression that promotes MC migration/activation. Enhanced MC presence was noted in WT WD mice and human NASH, along with increased DR. WT WD mice had significantly increased steatosis, DR/biliary senescence, inflammation, liver fibrosis, and angiogenesis compared to WT CD mice, which was significantly reduced in KitW-sh WD mice. Loss of MCs prominently reduced microvesicular steatosis in zone 1 hepatocytes. MC injection promoted WD-induced biliary and liver damage and specifically up-regulated microvesicular steatosis in zone 1 hepatocytes. Aldehyde dehydrogenase 1 family, member A3 (ALDH1A3) expression is reduced in WT WD mice and human NASH but increased in KitW-sh WD mice. MicroRNA 144-3 prime (miR-144-3p) expression was increased in WT WD mice and human NASH but reduced in KitW-sh WD mice and was found to target ALDH1A3.
Conclusions: MCs promote WD-induced biliary and liver damage and may promote microvesicular steatosis development during NAFLD progression to NASH through miR-144-3p/ALDH1A3 signaling. Inhibition of MC activation may be a therapeutic option for NAFLD/NASH treatment.
© 2021 by the American Association for the Study of Liver Diseases.
Conflict of interest statement
Potential conflict of interest: Nothing to report.
Figures


Similar articles
-
Inhibition of Secretin/Secretin Receptor Axis Ameliorates NAFLD Phenotypes.Hepatology. 2021 Oct;74(4):1845-1863. doi: 10.1002/hep.31871. Epub 2021 Jul 29. Hepatology. 2021. PMID: 33928675 Free PMC article.
-
Blocking integrin α4β7-mediated CD4 T cell recruitment to the intestine and liver protects mice from western diet-induced non-alcoholic steatohepatitis.J Hepatol. 2020 Nov;73(5):1013-1022. doi: 10.1016/j.jhep.2020.05.047. Epub 2020 Jun 12. J Hepatol. 2020. PMID: 32540177 Free PMC article.
-
Mast Cells Regulate Ductular Reaction and Intestinal Inflammation in Cholestasis Through Farnesoid X Receptor Signaling.Hepatology. 2021 Nov;74(5):2684-2698. doi: 10.1002/hep.32028. Epub 2021 Sep 9. Hepatology. 2021. PMID: 34164827 Free PMC article.
-
Potential for dietary ω-3 fatty acids to prevent nonalcoholic fatty liver disease and reduce the risk of primary liver cancer.Adv Nutr. 2015 Nov 13;6(6):694-702. doi: 10.3945/an.115.009423. Print 2015 Nov. Adv Nutr. 2015. PMID: 26567194 Free PMC article. Review.
-
Circulating miRNAs associated with nonalcoholic fatty liver disease.Am J Physiol Cell Physiol. 2023 Feb 1;324(2):C588-C602. doi: 10.1152/ajpcell.00253.2022. Epub 2023 Jan 16. Am J Physiol Cell Physiol. 2023. PMID: 36645666 Review.
Cited by
-
Identification and validation of potential diagnostic signature and immune cell infiltration for NAFLD based on cuproptosis-related genes by bioinformatics analysis and machine learning.Front Immunol. 2023 Sep 26;14:1251750. doi: 10.3389/fimmu.2023.1251750. eCollection 2023. Front Immunol. 2023. PMID: 37822923 Free PMC article.
-
Innate immunity and nonalcoholic fatty liver disease.Ann Gastroenterol. 2023 May-Jun;36(3):244-256. doi: 10.20524/aog.2023.0793. Epub 2023 Apr 8. Ann Gastroenterol. 2023. PMID: 37144011 Free PMC article. Review.
-
Immune infiltration analysis based on pyroptosis-related gene in metabolic dysfunction-associated fatty liver disease.Heliyon. 2024 Jul 9;10(15):e34348. doi: 10.1016/j.heliyon.2024.e34348. eCollection 2024 Aug 15. Heliyon. 2024. PMID: 39145004 Free PMC article.
-
Treatment of liver fibrosis: Past, current, and future.World J Hepatol. 2023 Jun 27;15(6):755-774. doi: 10.4254/wjh.v15.i6.755. World J Hepatol. 2023. PMID: 37397931 Free PMC article. Review.
-
Integrative Analyses of Genes of Pediatric Non-alcoholic Fatty Liver Disease Associated with Energy Metabolism.Dig Dis Sci. 2024 Dec;69(12):4373-4391. doi: 10.1007/s10620-024-08702-4. Epub 2024 Nov 4. Dig Dis Sci. 2024. PMID: 39496907 Free PMC article.
References
-
- Popescu M, Popescu IA, Stanciu M, Cazacu SM, Ianosi NG, Comanescu MV, et al. Non-alcoholic fatty liver disease—clinical and histopathological aspects. Rom J Morphol Embryol 2016;57:1295–1302 - PubMed
-
- Ratziu V, Bonyhay L, Di Martino V, Charlotte F, Cavallaro L, Sayegh-Tainturier M-H, et al. Survival, liver failure, and hepatocellular carcinoma in obesity-related cryptogenic cirrhosis. Hepatology 2002;35:1485–1493. - PubMed
-
- Williams CD, Stengel J, Asike MI, Torres DM, Shaw J, Contreras M, et al. Prevalence of nonalcoholic fatty liver disease and nonalcoholic steatohepatitis among a largely middle-aged population utilizing ultrasound and liver biopsy: a prospective study. Gastroenterology 2011;140:124–131. - PubMed
-
- Fromenty B, Pessayre D. Inhibition of mitochondrial beta-oxidation as a mechanism of hepatotoxicity. Pharmacol Ther 1995;67:101–154. - PubMed
Publication types
MeSH terms
Substances
Grants and funding
LinkOut - more resources
Full Text Sources
Other Literature Sources
Medical

