. 2021 Jan 21;184(2):334-351.e20.
doi: 10.1016/j.cell.2020.11.045. Epub 2021 Jan 11.

A modular master regulator landscape controls cancer transcriptional identity

Affiliations

A modular master regulator landscape controls cancer transcriptional identity

Evan O Paull et al. Cell. .

Abstract

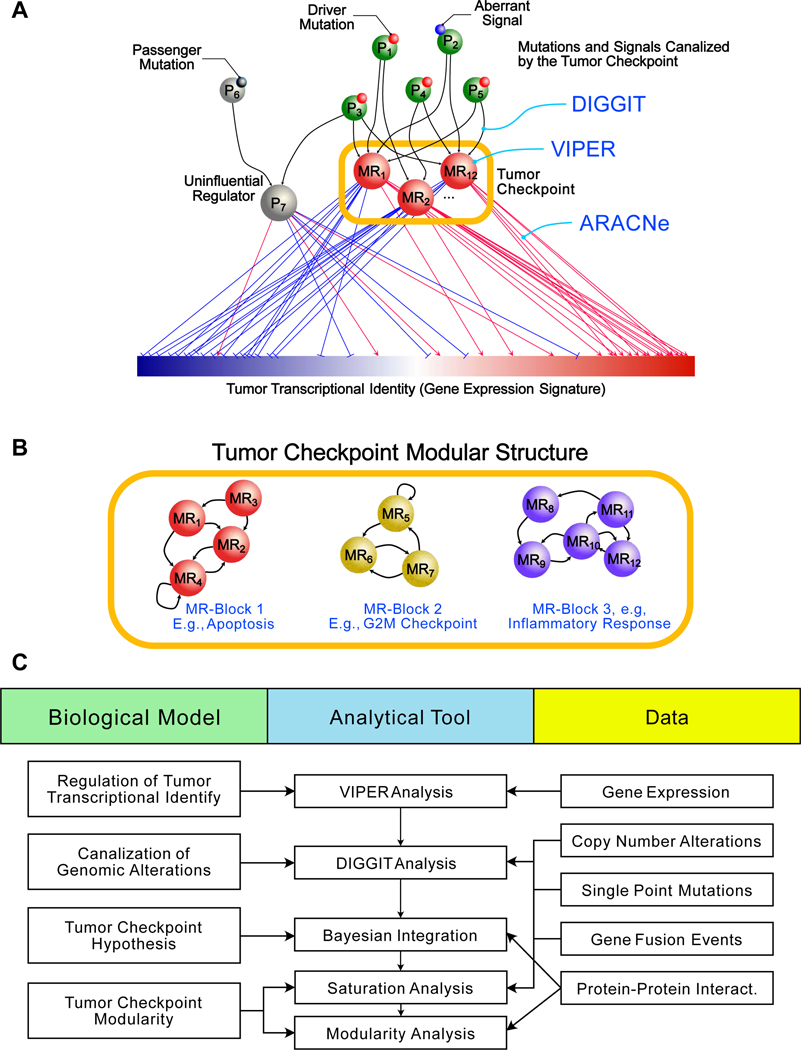
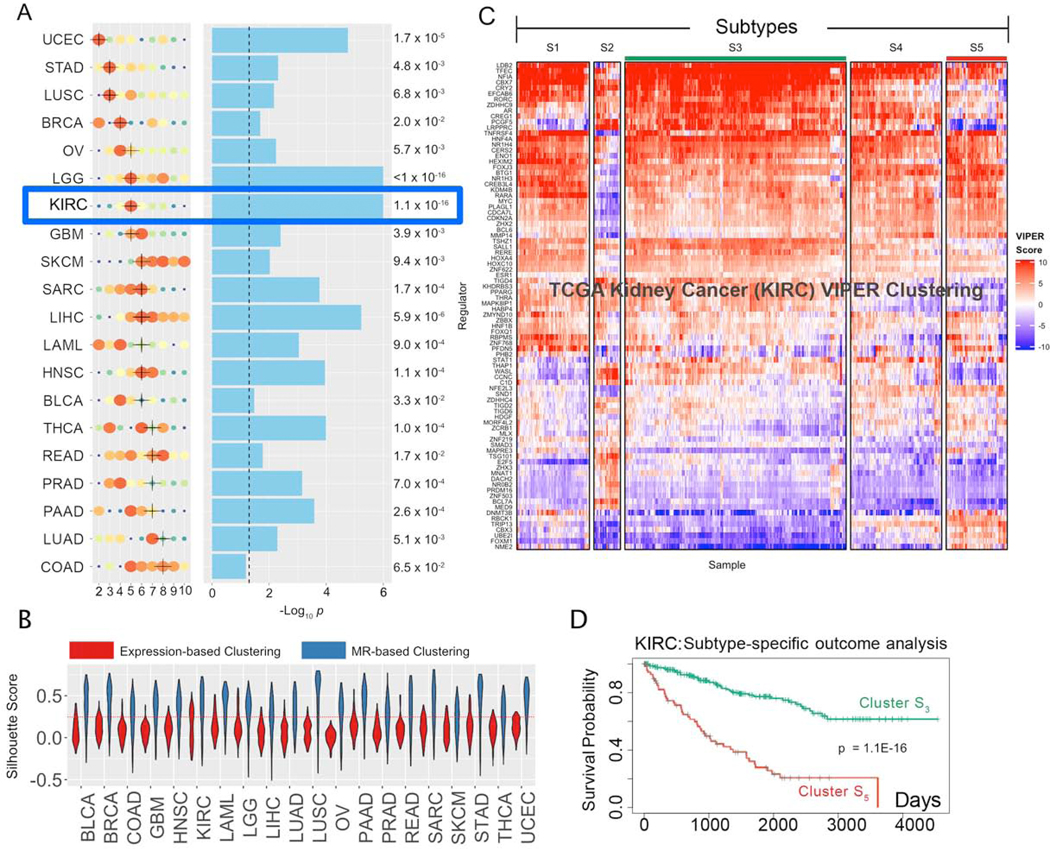
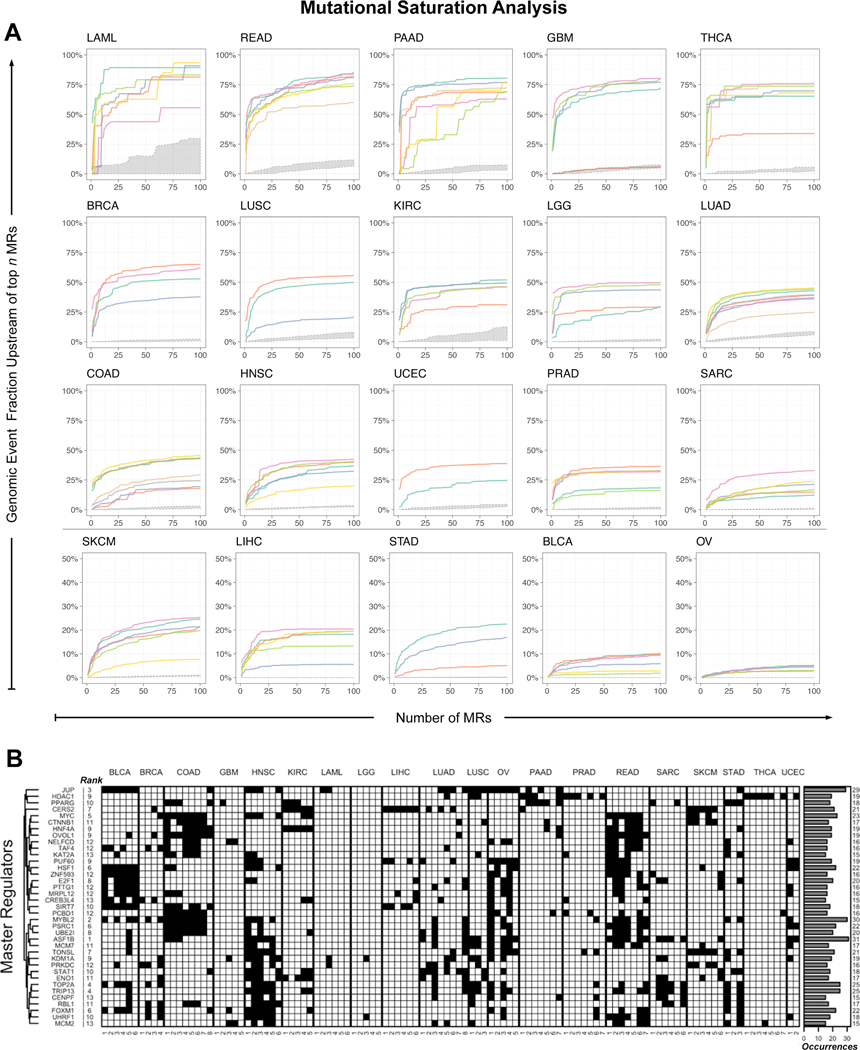
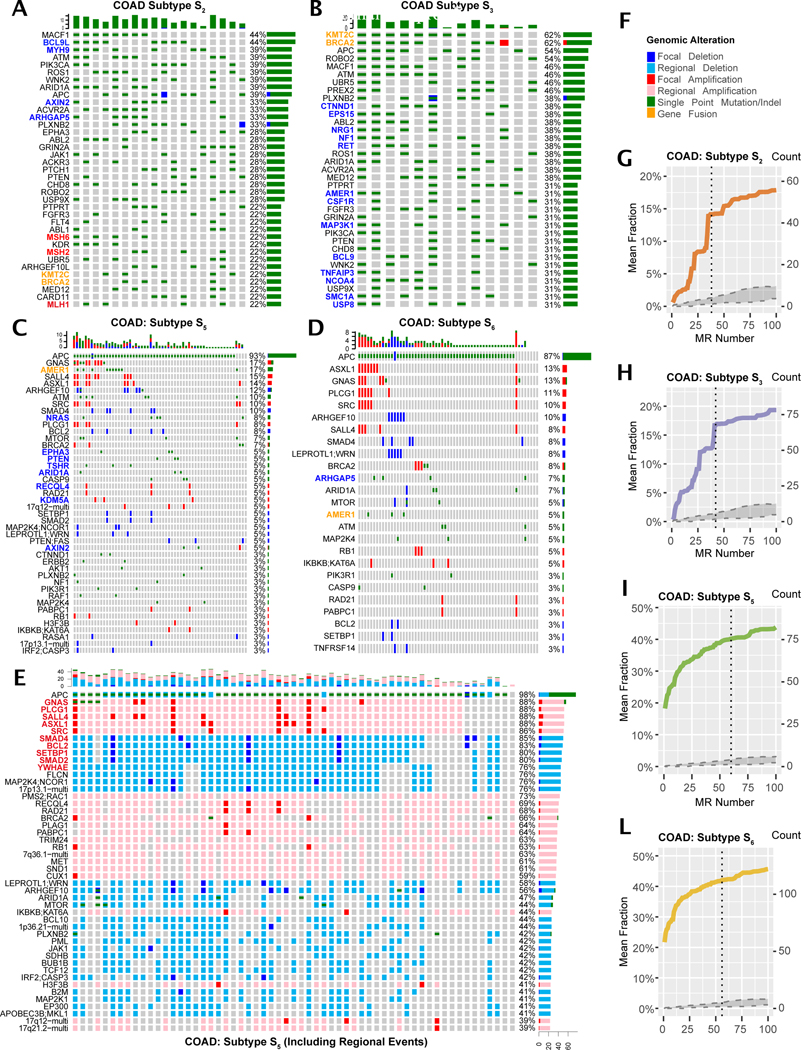
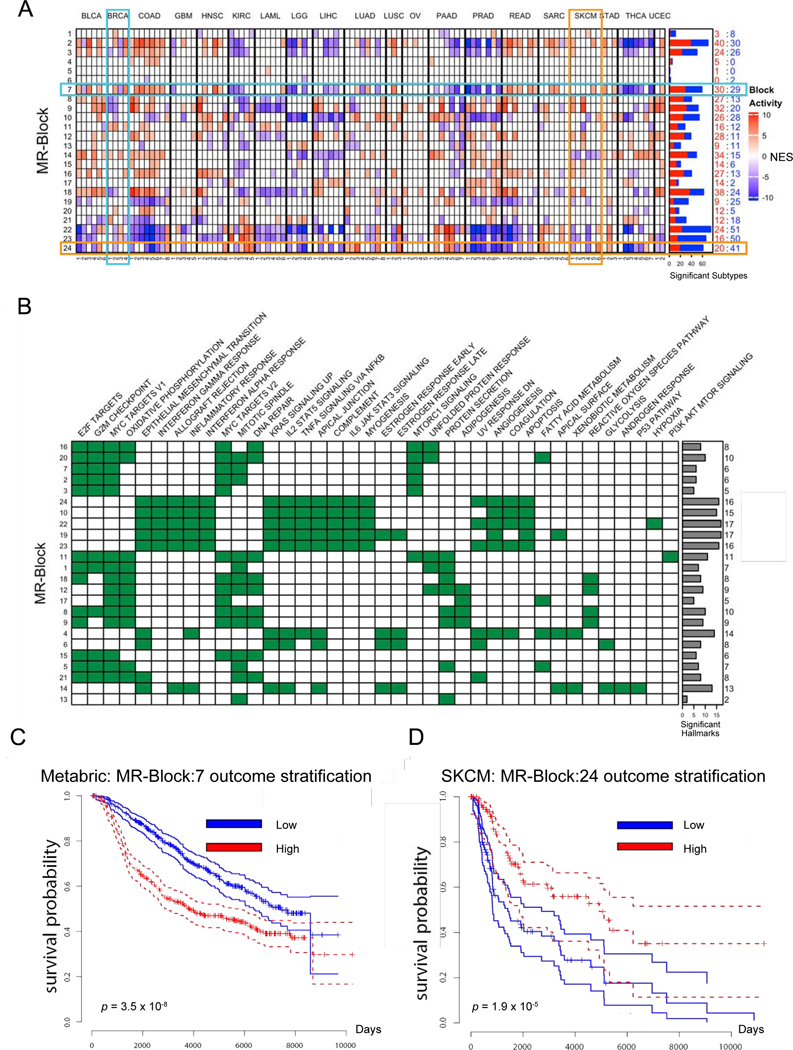
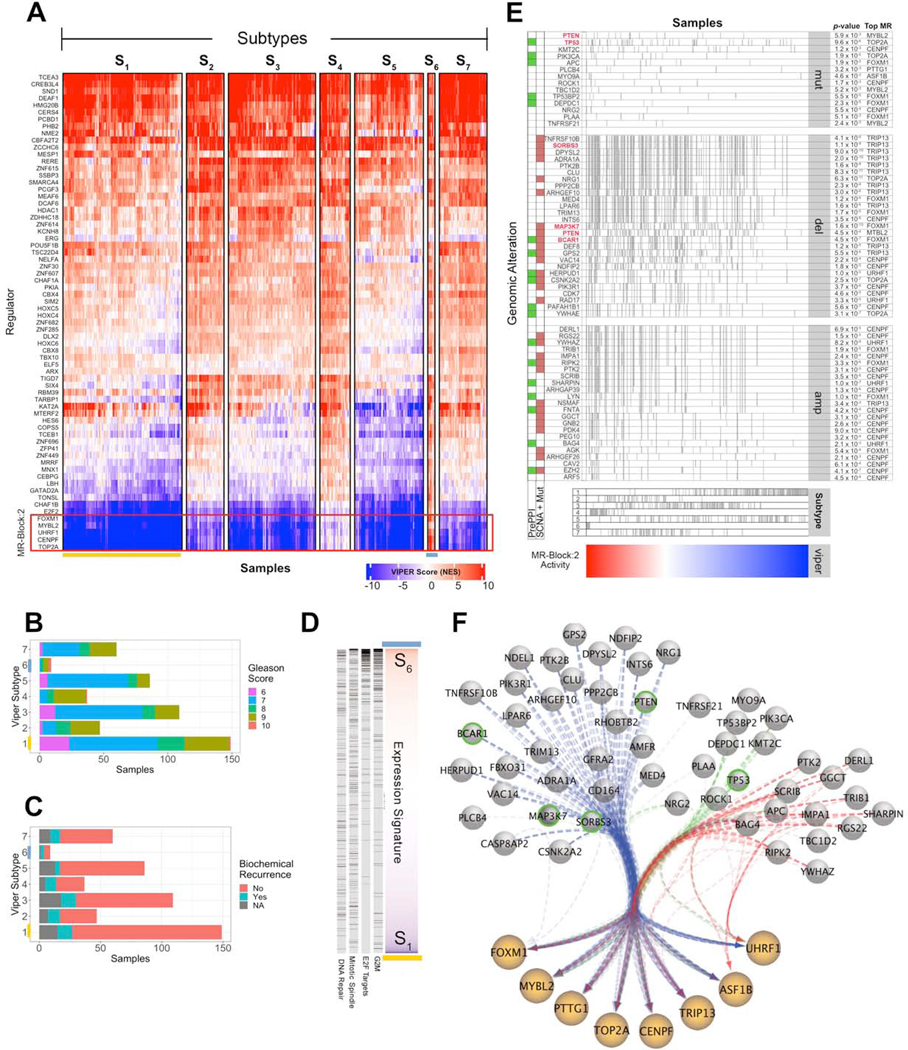
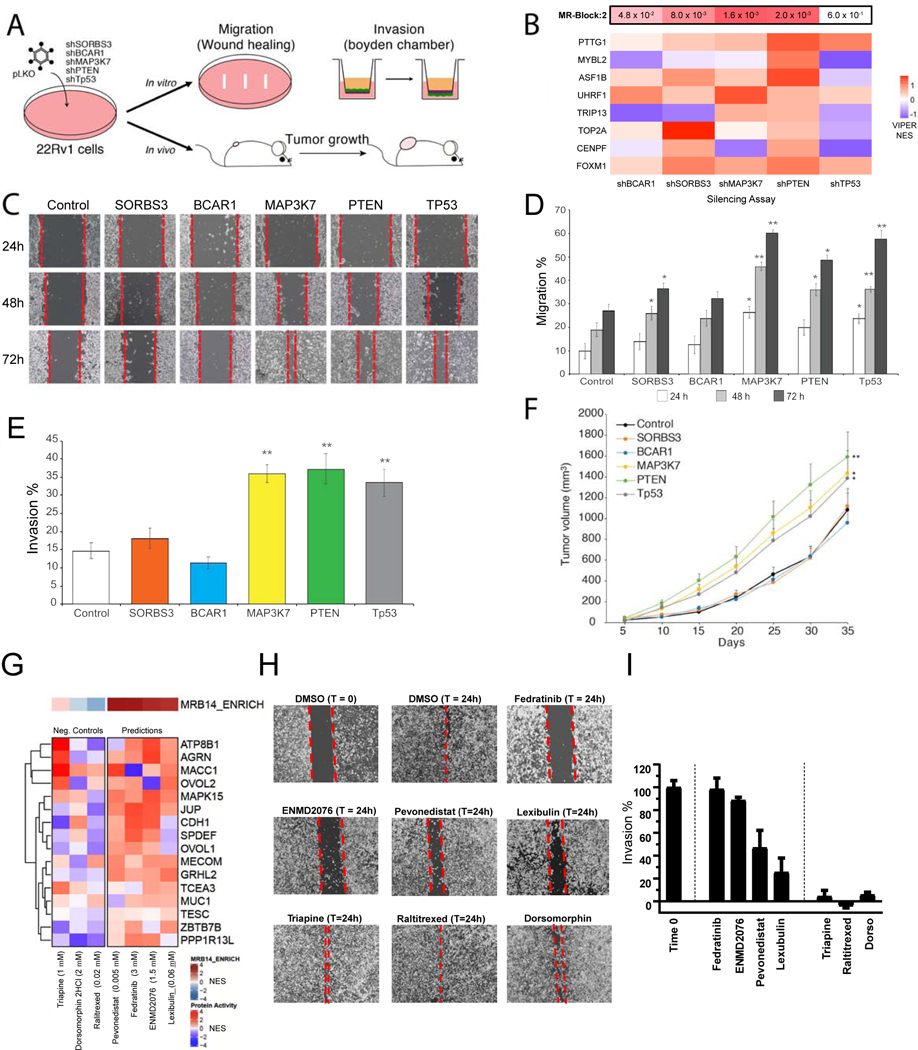
Despite considerable efforts, the mechanisms linking genomic alterations to the transcriptional identity of cancer cells remain elusive. Integrative genomic analysis, using a network-based approach, identified 407 master regulator (MR) proteins responsible for canalizing the genetics of individual samples from 20 cohorts in The Cancer Genome Atlas (TCGA) into 112 transcriptionally distinct tumor subtypes. MR proteins could be further organized into 24 pan-cancer, master regulator block modules (MRBs), each regulating key cancer hallmarks and predictive of patient outcome in multiple cohorts. Of all somatic alterations detected in each individual sample, >50% were predicted to induce aberrant MR activity, yielding insight into mechanisms linking tumor genetics and transcriptional identity and establishing non-oncogene dependencies. Genetic and pharmacological validation assays confirmed the predicted effect of upstream mutations and MR activity on downstream cellular identity and phenotype. Thus, co-analysis of mutational and gene expression profiles identified elusive subtypes and provided testable hypothesis for mechanisms mediating the effect of genetic alterations.

Keywords: cancer genetics; cancer systems biology; genomic alteration; integrative genomics; multiomics; network analysis; pan-cancer analysis; transcriptional regulation.


Conflict of interest statement

Declaration of interests A.C. is founder, equity holder, consultant, and director of DarwinHealth Inc., a company that has licensed some of the algorithms used in this manuscript from Columbia University. M.J.A. is Chief Scientific Officer and equity holder at DarwinHealth, Inc. Patent 10,790,040, titled “Virtual Inference of Protein Activity by Regulon Analysis” has issued on Sept. 29, 2020 related to the VIPER method. Columbia University is also an equity holder in DarwinHealth Inc.

Figures

Figure 1.
Figure 1.. Conceptual overview of the algorithm to find sample “checkpoints” and checkpoint blocks.
(A) Conceptual diagram illustrating the “bottleneck hypothesis”. Master regulator (MR) proteins (e.g., MR1 – MR12) integrate the effect of genomic alterations (small red spheres) and aberrant paracrine and endocrine signals (small blue sphere), in upstream pathway proteins (e.g., P1 – P5). Furthermore, they regulate the “downstream” transcriptional identity of the cell—shown as a gene expression signature with genes ranked from lowest (blue) to highest (red) expression—via their activated and repressed targets (red and blue edges, respectively). Passenger alterations (small black sphere) and alterations not affecting the cell’s transcriptional identity occur in proteins (e.g., P6) whose downstream effectors (e.g., P7) do not affect MR activity. MR proteins form tightly autoregulated, modular structures (Tumor Checkpoints) responsible for homeostatic control of the cancer cell’s transcriptional identity. (B) Tumor checkpoints comprise multiple sub-modular structures, termed MR-Blocks (MRBs), which regulate specific tumor hallmarks and are recurrently detected across different subtypes. As an illustrative example a tumor checkpoint comprising three different MRBs is shown. (C) Conceptual workflow diagram of the MOMA algorithm. See also Figure S1.
Figure 2.
Figure 2.. Subtypes inference by network-based integration of gene expression and mutational profile data.
(A) Cohort subtypes identified by MOMA, ranked from the lowest (UCEC) to the highest (COAD) number of optimal subtypes (x-axis). Solution optimality is shown by size and color of the dots, with larger, redder dots representing higher average CRS. The selected solution is marked by a black cross (see STAR Methods for handling ties). Statistical significance of survival separation between the best and worst clusters, by Kaplan Meier analysis, is shown next to the blue bars that represent the -Log10 p. The dashed line represents p = 0.05. (B) Violin plots representing the Silhouette Score probability density (y-axis) for each of the 20 TCGA tissue types (x-axis) for the optimal clustering solution, as inferred by either MR-based (blue) or expression-based (red) cluster analysis. A dotted red line indicates the standard statistical significance threshold (SS = 0.25). (C) MR-based clustering heatmap for the TCGA kidney clear cell carcinoma cohort (KIRC). Rows represent Tumor Checkpoint MR proteins, while columns represent individual samples. Color scale is proportional to protein activity (red activated; blue inactivated). (D) Cox-proportional hazard analysis of patient survival in subtype S5 (red line) vs. S3 (green line) (p = 1.1×10⁻¹⁶). See also Figure S2 and Table S1.
Figure 3.
Figure 3.. Genomic saturation analysis of candidate master regulators across all subtypes.
(A) Individual curves show the average fraction of functional genomic events in each sample identified upstream of the top n MOMA-inferred MR proteins for each subtype, as n increases from 1 to 100. Saturation curves produced by the null-hypothesis—i.e., n randomly selected MRs from 1,253 non-statistically significant regulatory proteins (i.e., the bottom half of all MOMA-ranked proteins)—are shown in gray. Cohorts are sorted in decreasing order of the fraction of genetic events accounted for by their Tumor Checkpoint MRs. For visual clarity, the last 5 cohorts are shown on an expanded y-axis scale (0–50%). (B) This panel shows the 37 most recurrently activated MR proteins, which canalize genetic alteration effects in n ≥ 15 MOMA-inferred subtypes (black cells), based on saturation analysis. Rows represent MR proteins clustered by their subtype-specific activity, to highlight MRs co-activated in the same clusters (e.g. FOXM1 and CENPF), while MOMA-inferred subtypes are shown in the columns, grouped by tumor type. The recurrence rank of each MR, based on the number of subtypes in which it is aberrantly activated, is shown to the left of the matrix while the number of subtypes is shown on the right as a bar chart. See also Figure S3, Tables S2 and S6.
Figure 4.
Figure 4.. Genomic Alterations Dysregulating COAD Tumor Checkpoints.
(A – D) OncoPrint plots (Gu et al., 2016) showing genomic alterations in pathways upstream of subtypes S2/S3 (MSIHigh) and S5/S6 (MSS) in COAD. Only focal SCNA events are shown. Horizontal histograms and percent numbers show the fraction of samples harboring the specific event type. Vertical histograms show the number of events detected in each sample. For SCNAs, each row corresponds to an independent cytoband, identified by a functionally established oncoprotein/tumor suppressor (STAR methods). Blue labels represent genetic alterations detected only in one subtype but not the other (i.e., S2 vs. S3 or S5 vs. S6), orange labels show alterations disproportionately represented across subtypes, while red ones show mismatch repair genes in S2. (E) OncoPrint plot of S5 alterations, including those in Regional (i.e., non-focal) SCNA, with most affected events shown with a red label. (F) Legend for genomic event types. (G – L) Genomic saturation curves for COAD subtypes S2, S3, S5, and S6. Vertical dashed line indicates the saturation threshold, see Figure 3A for detailed description. See also Table S6.
Figure 5.
Figure 5.. MRBs are recurrently activated in cancer and regulate established tumor hallmarks.
(A) Heatmap showing statistically significantly activated (ON) and inactivated (OFF) MRBs for each MOMA-inferred transcriptional subtype (p < 10−3), grouped by tumor type. Color saturation is proportional to statistical significance (Average protein activity of MRB MRs), see color-scale legend. Breast cancer (BRCA) and melanoma (SKCM) subtypes are marked to highlight differential activation of MRB:7 and 24, respectively, also highlighted. Horizontal histograms show total number of subtypes with significantly activated (red) and inactivated (blue) blocks, numerical values are also shown for clarity. (B) Enrichment of Tumor Hallmarks in MRB MRs and their transcriptional targets (False Discovery Rate, FDR < 0.05, by Benjamini-Hochberg) identifies hallmarks significantly associated with each MRB. Order is based on co-clustering across both rows and columns to highlight related hallmarks and MRB co-activation. Horizontal histograms summarize the total number of enriched hallmarks per block. (C) MRB:7 activity stratifies survival in the Metabric breast cancer cohort (p = 3.5×10⁻⁸; by Kaplan Meier). (D) MRB:24 activity significantly stratifies survival in the TCGA melanoma cohort (p < 1.9×10⁻⁵). In contrast to MRB:7, higher activity of MRB:24 is associated with better outcome, consistent with its role as a marker of inflammation and immune sensing (Figure 5B). See also Figures S4, S5, S6 and Table S4.
Figure 6.
Figure 6.. MRB 2 and its upstream genetic alterations drive the most aggressive PRAD subtype.
(A) Heatmap showing MR-based clustering of the TCGA prostate cancer cohort (PRAD) into 7 molecularly-distinct subtypes, as described in Figure 2C. (B) Gleason Score frequency stratification by subtype. (C) Biochemical recurrence status by subtype. (D) Enrichment of genes in MRB:2 hallmark categories in genes differentially expressed between S1 and S6 subtypes, sorted by Student’s t-test analysis. Genes in each hallmark are shown as black ticks and statistical significance is computed by GSEA analysis (p < 2.2×10⁻¹⁶, i.e., below minimum computable significance). (E) Genomic events significantly associated with MRB:2 activity. Samples (columns) are sorted by MRB:2 activity (bottom heatmap) and presence of a specific genomic event is shown as vertical tick-marks. Functional SCNA events for genes that also harbor mutations in the cohort are marked with a brown square. Those involved in protein-protein interactions with MR proteins, based on PrePPI analysis, are marked with a green square. Events are ranked based on their subtype frequency. The top integrated aQTL, CINDy and PrePPI association p-value (using Fisher’s method) for each event with a MRB:2 MR is shown on the right side. The five genes selected for experimental validation are highlighted in red. We also indicate the subtype designation per sample, as shown as tick marks above the heatmap. (F) Network diagram of MRB:2 proteins with edges representing a select set of DIGGIT-inferred alteration-MR interactions—including for deletions (blue), mutations (green), and amplification events (red)—shown as bundled edges. Green-circled events were selected for experimental follow-up. See also Table S3.
Figure 7.
Figure 7.. Functional validation of MRB:2 and 14.
(A) Conceptual diagram of the functional validation assays. Androgen independent 22Rv1 prostate cancer cells were infected with lentiviral non-targeting control vectors and vectors containing shRNA hairpins to silence genes harboring predicted, recurrent genomic events upstream of MRB:2. Stably silenced clones were then used to perform both in vitro and in in vivo assays. (B) VIPER analysis of 8 MRB core-set proteins (rows) in each silencing condition (columns). Significance of overall MRB:2 differential activity is shown above. (C) Migration of 22Rv1 cells was assessed in wound healing assays at 24 (control), 48, and 72 hours after scratching a confluent culture of control and silenced 22Rv1, in triplicate. (D) Quantification of the migration assay. Bars indicate the migration percentage (gap area compared to T = 24h) ± standard error of the mean (SEM). P-values from the two hairpins were integrated by Fisher’s method (* p < 0.05, ** p < 0.001, by 1-tail Student’s t-test). (E) Quantification of Boyden chamber invasion assays in triplicate. Bars represent the proportion of invading cells ± SEM. P-values from the two hairpins were integrated by Fisher’s method (** p < 0.001, 1-tail t-test). (F) Functional, in vivo validation of tumorigenic effects. Tumor growth curves, up to 35 days, are shown for mice engrafted with control and silenced 22Rv1 cells. In vivo assays where performed in triplicate; * p < 0.05 and ** p < 0.001, by 2-tail, two-way ANOVA. (G) Heatmap showing the effect of selected drug perturbations (columns) on the activity of MRB:14 MR proteins (rows) at 24h. Drug names are followed by their EC20 concentration, based on dose response curves. The color bar on top of the heatmap indicates the significance of the average MRB:14 differential activity. (H) Modified migration assay of DU145 cells after drug treatment to activate MRB:14, assessed at 24h after drug treatment. (I) Average gap area (gap remaining) quantitation by integrating measurements of ≥ 3 images along the gap, after subtracting any residual gap area in DMSO-treated cells. Percentage gap remaining is calculated with respect to images at 0h time. See also Figure S7 and Table S5.

References

    1. Alvarez MJ, Shen Y, Giorgi FM, Lachmann A, Ding BB, Ye BH, and Califano A. (2016). Functional characterization of somatic mutations in cancer using network-based inference of protein activity. Nat Genet 48, 838–847. - PMC - PubMed
    1. Alvarez MJ, Subramaniam PS, Tang LH, Grunn A, Aburi M, Rieckhof G, Komissarova EV, Hagan EA, Bodei L, Clemons PA, et al. (2018). A precision oncology approach to the pharmacological targeting of mechanistic dependencies in neuroendocrine tumors. Nat Genet 50, 979–989. - PMC - PubMed
    1. Ashburner M, Ball CA, Blake JA, Botstein D, Butler H, Cherry JM, Davis AP, Dolinski K, Dwight SS, Eppig JT, et al. (2000). Gene ontology: tool for the unification of biology. The Gene Ontology Consortium. Nat Genet 25, 25–29. - PMC - PubMed
    1. Aytes A, Mitrofanova A, Lefebvre C, Alvarez MJ, Castillo-Martin M, Zheng T, Eastham JA, Gopalan A, Pienta KJ, Shen MM, et al. (2014). Cross-species regulatory network analysis identifies a synergistic interaction between FOXM1 and CENPF that drives prostate cancer malignancy. Cancer Cell 25, 638–651. - PMC - PubMed
    1. Bailey MH, Tokheim C, Porta-Pardo E, Sengupta S, Bertrand D, Weerasinghe A, Colaprico A, Wendl MC, Kim J, and Reardon B. (2018). Comprehensive characterization of cancer driver genes and mutations. Cell 173, 371–385. e318. - PMC - PubMed

Publication types