. 2021 Mar 4;81(5):922-939.e9.
doi: 10.1016/j.molcel.2020.12.026.

R-2-hydroxyglutarate attenuates aerobic glycolysis in leukemia by targeting the FTO/m6A/PFKP/LDHB axis

Affiliations

R-2-hydroxyglutarate attenuates aerobic glycolysis in leukemia by targeting the FTO/m6A/PFKP/LDHB axis

Ying Qing et al. Mol Cell. .

Abstract

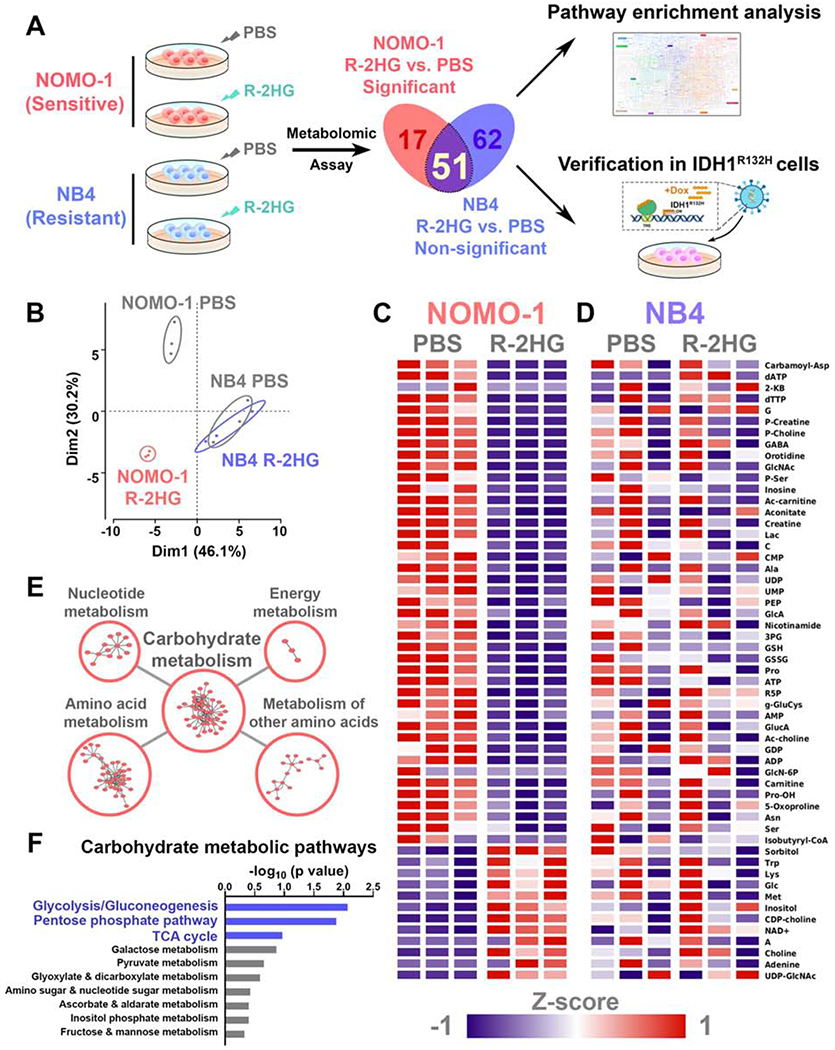
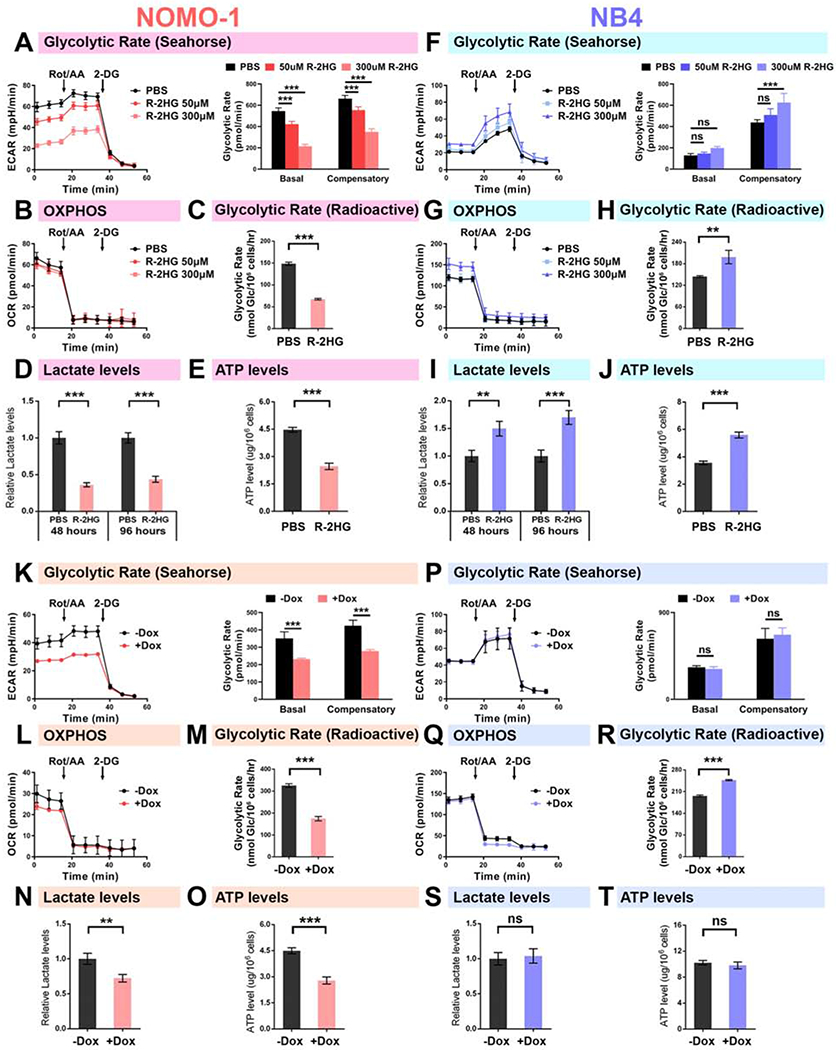
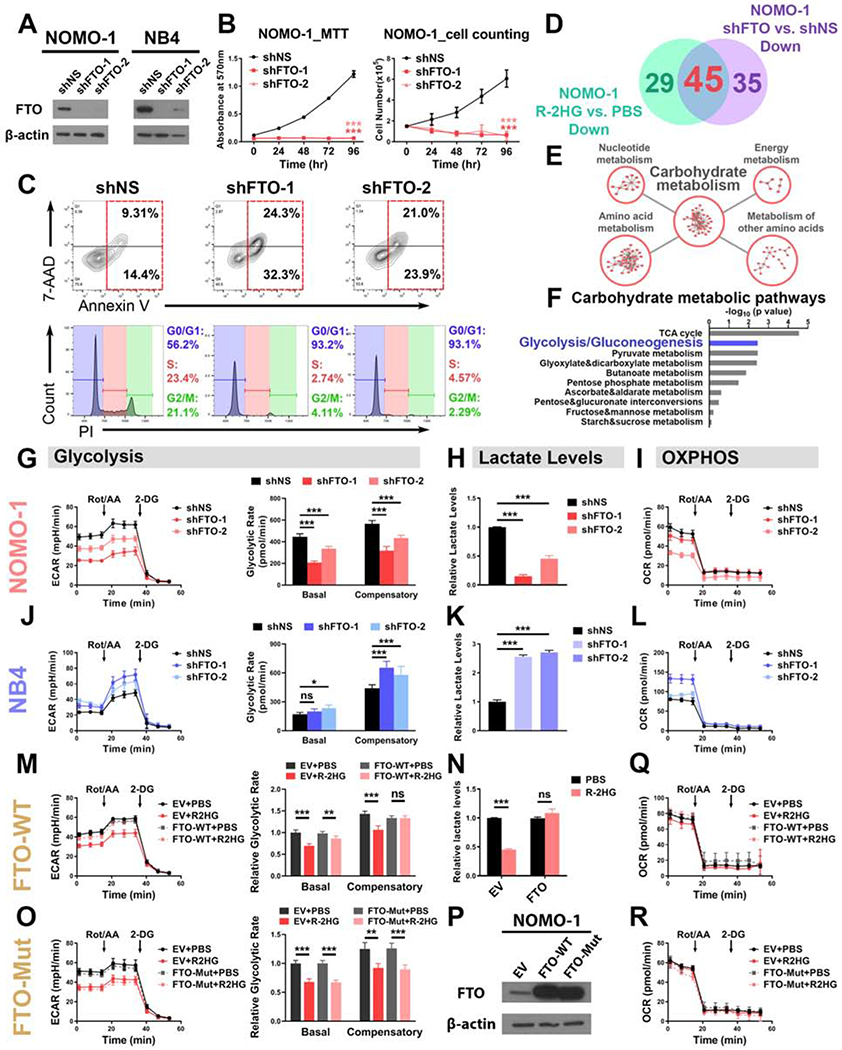
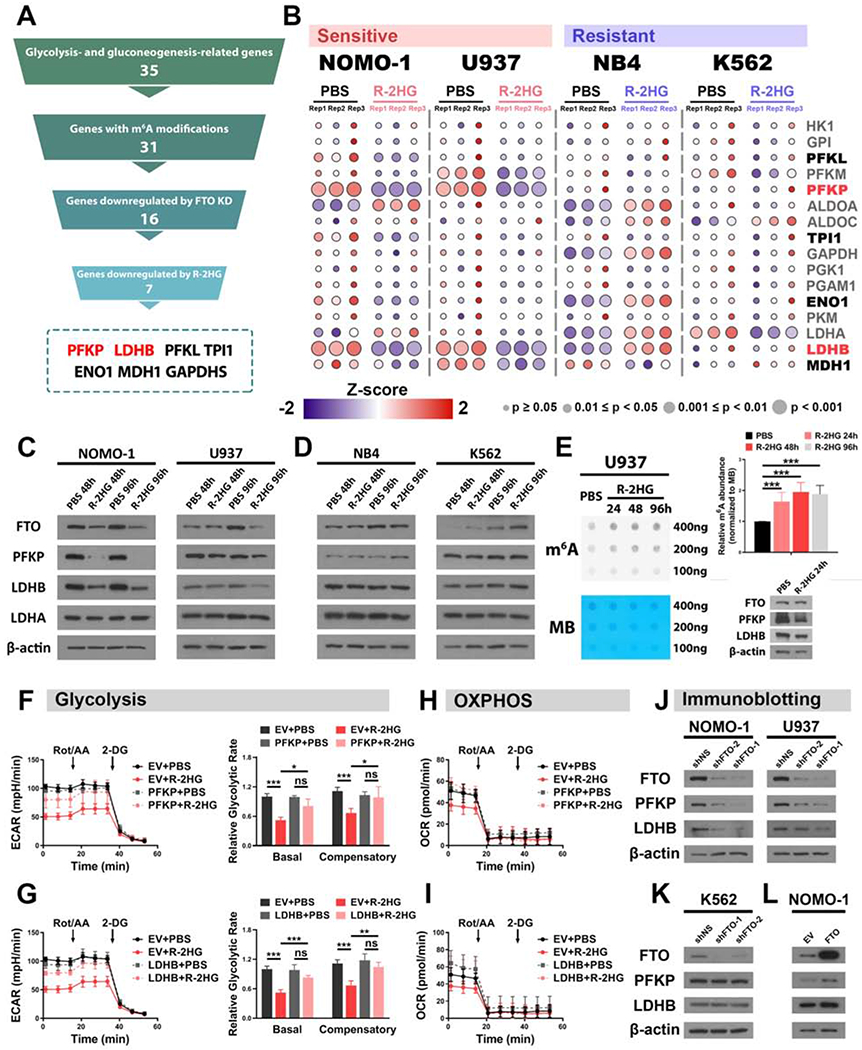
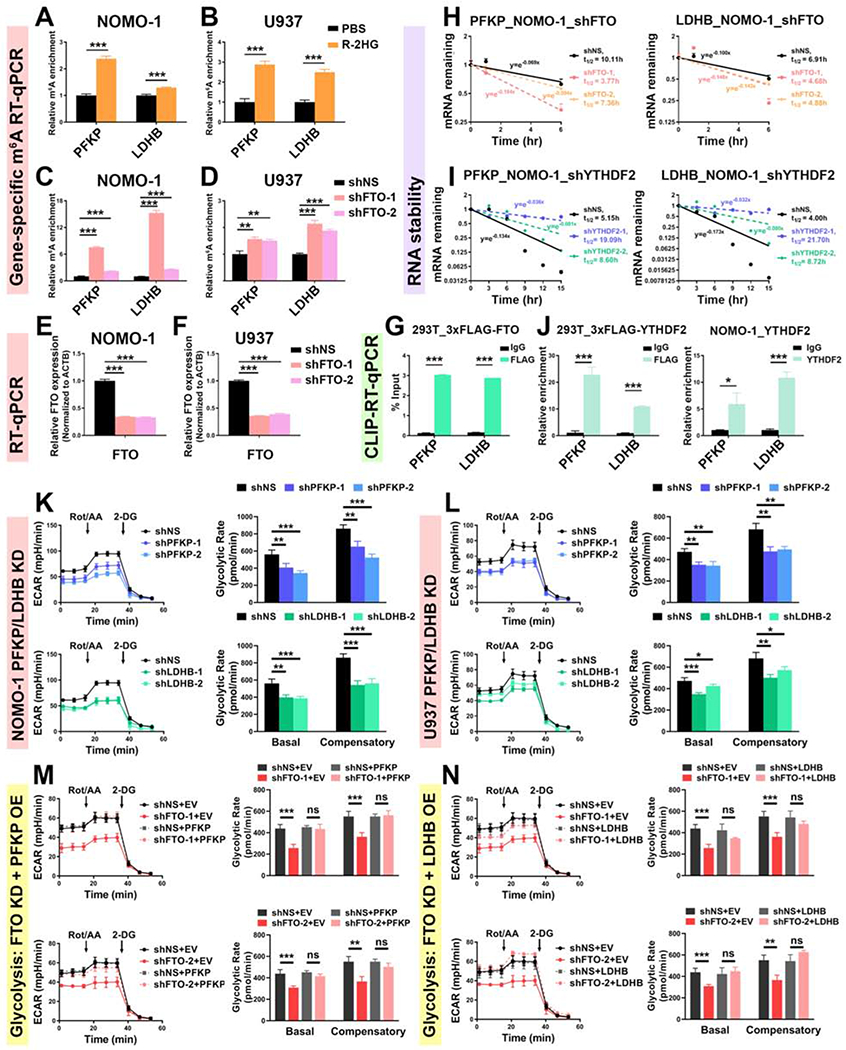
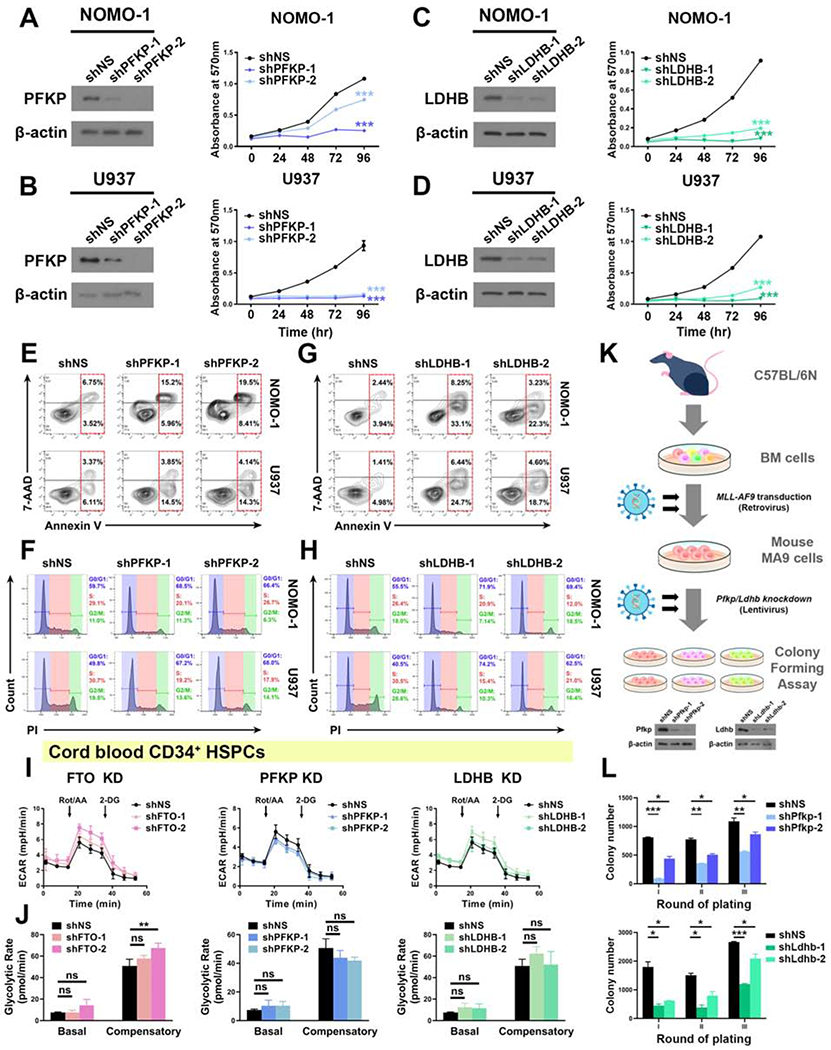
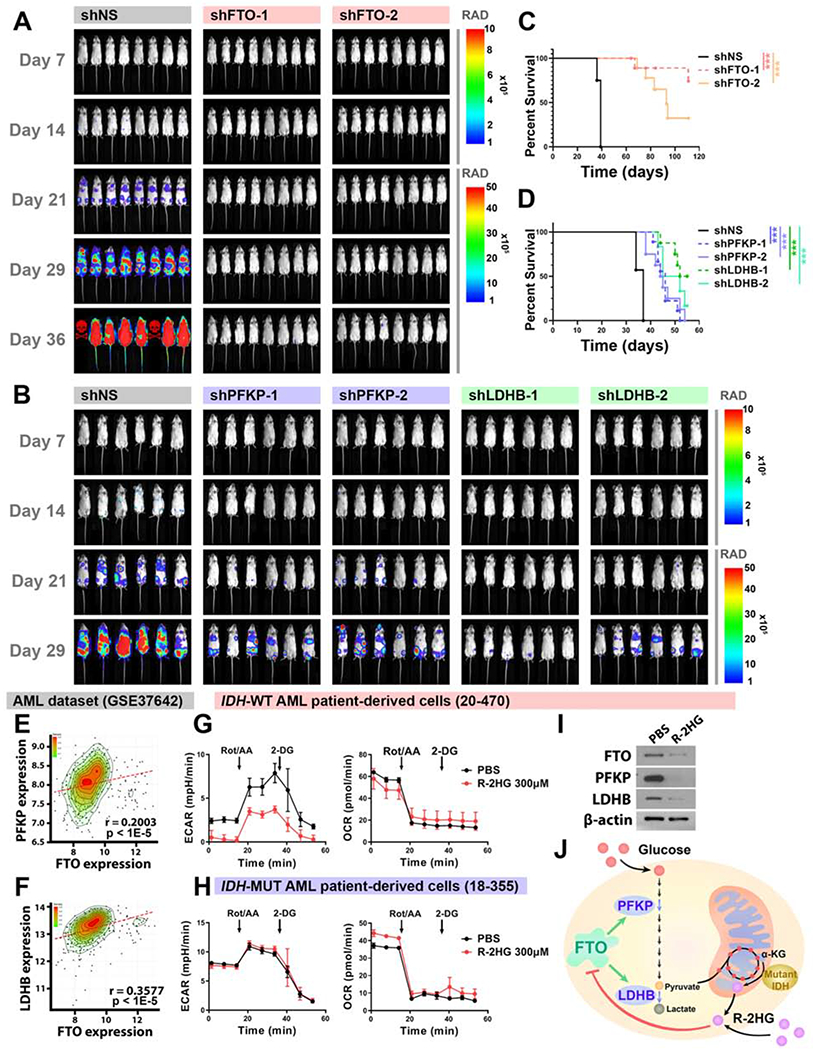
R-2-hydroxyglutarate (R-2HG), a metabolite produced by mutant isocitrate dehydrogenases (IDHs), was recently reported to exhibit anti-tumor activity. However, its effect on cancer metabolism remains largely elusive. Here we show that R-2HG effectively attenuates aerobic glycolysis, a hallmark of cancer metabolism, in (R-2HG-sensitive) leukemia cells. Mechanistically, R-2HG abrogates fat-mass- and obesity-associated protein (FTO)/N6-methyladenosine (m6A)/YTH N6-methyladenosine RNA binding protein 2 (YTHDF2)-mediated post-transcriptional upregulation of phosphofructokinase platelet (PFKP) and lactate dehydrogenase B (LDHB) (two critical glycolytic genes) expression and thereby suppresses aerobic glycolysis. Knockdown of FTO, PFKP, or LDHB recapitulates R-2HG-induced glycolytic inhibition in (R-2HG-sensitive) leukemia cells, but not in normal CD34+ hematopoietic stem/progenitor cells, and inhibits leukemogenesis in vivo; conversely, their overexpression reverses R-2HG-induced effects. R-2HG also suppresses glycolysis and downregulates FTO/PFKP/LDHB expression in human primary IDH-wild-type acute myeloid leukemia (AML) cells, demonstrating the clinical relevance. Collectively, our study reveals previously unrecognized effects of R-2HG and RNA modification on aerobic glycolysis in leukemia, highlighting the therapeutic potential of targeting cancer epitranscriptomics and metabolism.

Keywords: FTO; LDHB; N(6)-methyladenosine (m(6)A) modification; PFKP; R-2HG; RNA stability; YTHDF2; cancer metabolism; glycolysis; leukemia.


Conflict of interest statement

Declaration of interests J.C. is a scientific founder of Genovel Biotech Corp. and holds equities with the company.

Figures

Figure 1.
Figure 1.. R-2HG differentially regulates cellular metabolism in sensitive and resistant leukemia cells
(A) Flow chart for the identification and verification strategy of differentially R-2HG-regulated metabolic pathways between NOMO-1 and NB4 cells. Graphical element is adapted from KEGG pathway map (Kanehisa, 2019). (B) PCA plots of all the detected metabolites in PBS- or R-2HG-treated NOMO-1 and NB4 cell samples. (C and D) Heatmaps showing relative intracellular level changes of the 51 overlapping metabolites in PBS- or R-2HG-treated NOMO-1 (C) and NB4 (D) cells. Data are represented as Z-score normalized intracellular levels. (E) Top 5 enriched KEGG metabolic pathway classes in the 51 overlapping metabolites. The p values for the 5 classes are: Nucleotide metabolism, p = 2.69×10⁻⁷; Amino acid metabolism, p = 0.00414; Metabolism of other amino acids, p = 0.00652; Carbohydrate metabolism, p = 0.0126; Energy metabolism, p = 0.0836. (F) Top 10 enriched KEGG carbohydrate metabolic pathways in the 51 overlapping metabolites. Pathways are arranged by their −log10 (p value). See also Figure S1 and Tables S1 and S2.
Figure 2.
Figure 2.. R-2HG suppresses glycolysis in sensitive, but not resistant leukemia cells
(A) Effects of R-2HG on glycolytic rates (as determined by Seahorse Glycolytic Rate Assay) in NOMO-1 cells upon treatment with R-2HG for 24 h. The extracellular acidification rate (ECAR) over time (left panel) and the calculated glycolytic rates at different stages of measurement (right panel) are shown. (B) Effects of R-2HG on oxygen consumption rates (OCR) in NOMO-1 cells. (C-E) Effects of R-2HG on glycolytic rates (C; as detected by radioactive glycolysis assay), lactate levels (D), and ATP levels (E) in NOMO-1 cells treated with 300 μM R-2HG for 48 h. (F and G) Effects of R-2HG on glycolytic rates (F) and OCR (G) in NB4 cells treated with R-2HG for 24 h. (H-J) Effects of R-2HG on glycolytic rates (H), lactate levels (I), and ATP levels (J) in NB4 cells treated with 300 μM R-2HG for 48 h. (K) Effects of endogenous R-2HG on glycolytic rates in NOMO-1 cells, as determined by the Seahorse Glycolytic Rate Assay. Cells were treated with doxycycline (Dox) for 48 h to induce IDH1R132H expression. (L) Effects of endogenous R-2HG on OCR in NOMO-1 cells. (M-O) Effects of endogenous R-2HG on glycolytic rates (M; as detected by radioactive glycolysis assay), lactate levels (N), and ATP levels (O) in NOMO-1 cells. (P and Q) Effects of endogenous R-2HG on glycolytic rates (P; as determined by the Seahorse Glycolytic Rate Assay) and OCR (Q) in NB4 cells. (R-T) Effects of endogenous R-2HG on glycolytic rates (R; as detected by radioactive glycolysis assay), lactate levels (S), and ATP levels (T) in NB4 cells. Data are represented as mean ± SD. ns, not significant (p ≥ 0.05); **, p < 0.01; ***, p < 0.001. See also Figure S2.
Figure 3.
Figure 3.. FTO mediates the glycolytic inhibitory effect of R-2HG in sensitive leukemia cells
(A) Verification of FTO KD efficiency in NOMO-1 and NB4 cells. (B) FTO KD in NOMO-1 cells inhibited cell proliferation/growth, as determined by MTT (left panel) and cell counting (right panel) assays. (C) Effects of FTO KD on apoptosis (upper panel) and cell cycle (lower panel) in NOMO-1 cells. (D) Venn diagram showing numbers of metabolites downregulated in NOMO-1 cells upon R-2HG treatment and FTO KD. (E) The top 5 enriched KEGG metabolic pathway classes detected by the pathway enrichment analysis of the shared downregulated metabolites. (F) List of the top 10 enriched carbohydrate metabolic pathways. (G-I) Effects of FTO KD on glycolytic rates (G), lactate levels (H), and mitochondrial respiration (I) in NOMO-1 cells. (J-L) Effects of FTO KD on glycolytic rates (J), lactate levels (K), and mitochondrial respiration (L) in NB4 cells. (M and N) Overexpression of wild-type FTO rescued the glycolytic rates (M) and lactate levels(N) in 50 μM R-2HG-treated NOMO-1 cells. (O) Overexpression of catalytic-dead FTO failed to rescue the glycolytic inhibition induced by R-2HG (50 μM) in NOMO-1 cells. (P) Confirmation of wild-type and catalytic-dead FTO overexpression efficiency. EV: empty vector. (Q and R) Effects of wild-type (Q) and catalytic-dead (R) FTO on mitochondrial respiration in NOMO-1 cells with and without R-2HG (50 μM) treatment. Data are represented as mean ± SD. ns, not significant (p ≥ 0.05); *, p < 0.05; **, p < 0.01; ***, p < 0.001. See also Figure S3 and Table S4.
Figure 4.
Figure 4.. The R-2HG/FTO axis modulates PFKP and LDHB expression to regulate glycolysis in sensitive leukemia cells
(A) Pyramid flowchart of the screening strategy to identify downstream metabolic target genes of the R-2HG/FTO axis. (B) Heatmaps showing the relative expression of the screened out genes (marked in bold) along with other glycolytic enzymes in PBS- or R-2HG-treated sensitive and resistant cells. The color represents normalized expression level, and the diameter indicates significance of the difference between PBS- and R-2HG-treated samples. Among all tested genes, HK1, PFKL, PFKM, PFKP, PKM, LDHA, and LDHB are glycolysis-related, while MDH1 is gluconeogenesis-related; all other genes are related to both glycolysis and gluconeogenesis. (C and D) Protein levels of FTO and the representative glycolytic enzymes in PBS- or 300 μM R-2HG-treated sensitive cells (C) and resistant cells (D). (E) Effects of 300 μM R-2HG on global m6A modification and expression of target genes in U937 cells. Methylene blue (MB) staining is shown as a loading control. The quantification of normalized m6A signal is shown in the right upper panel. (F and G) Rescue effects of PFKP (F) and LDHB (G) on glycolysis rates in R-2HG treated NOMO-1 cells. (H and I) Mitochondrial respiration was measured in PBS- or R-2HG-treated NOMO-1 cells, with or without forced expression of PFKP (H) or LDHB (I). (J and K) Effects of FTO KD on protein levels of PFKP and LDHB in sensitive (J) and resistant (K) cells. (L) Effects of FTO overexpression on protein levels of PFKP and LDHB in NOMO-1 cells. Data are represented as mean ± SD. ns, not significant (p ≥ 0.05); *, p < 0.05; **, p < 0.01; ***, p < 0.001. See also Figure S4 and Table S5.
Figure 5.
Figure 5.. Expression of PFKP and LDHB is downregulated by the R-2HG/FTO axis via an m6A-dependent mechanism
(A and B) Relative m6A abundance in PFKP and LDHB transcripts in NOMO-1 (A) and U937 (B) cells upon 300 μM R-2HG for 48 h. (C and D) The m6A abundance changes in PFKP and LDHB transcripts in NOMO-1 (C) and U937 (D) cells upon FTO KD. (E and F) Verification of FTO KD efficiency in NOMO-1 (E) and U937 (F) cells. (G) Determination of the direct binding of FTO with PFKP and LDHB transcripts. (H and I) Effects of FTO (H) and YTHDF2 (I) KD on the stability of PFKP (left panel) and LDHB (right panel) mRNAs. (J) Determination of the direct binding of YTHDF2 with PFKP and LDHB transcripts in 293T (left panel) and NOMO-1 (right panel) cells. (K and L) Effects of PFKP (upper panel) and LDHB (lower panel) KD on glycolytic rates in NOMO-1 (K) and U937 (L) cells. The same control shNS groups were used for the analysis. (M and N) FTO KD-induced glycolytic inhibition by either shFTO-1 (upper panel) or shFTO-2 (lower panel) could be rescued by forced expression of PFKP (M) or LDHB (N). The same control groups (shNS+EV, shNS+PFKP, and shNS+LDHB) were used for the analysis. Data are represented as mean ± SD. ns, not significant (p ≥ 0.05); *, p < 0.05; **, p < 0.01; ***, p < 0.001. See also Figure S5.
Figure 6.
Figure 6.. Effects of PFKP or LDHB KD in leukemia cells and normal CD34+ HSPCs
(A and B) Effects of KD of PFKP (left panel) on cell proliferation/growth (right panel) in NOMO-1 (A) and U937 (B) cells. (C and D) Effects of KD of LDHB (left panel) on cell proliferation/growth (right panel) in NOMO-1 (C) and U937 (D) cells. (E and F) Effects of PFKP KD on apoptosis (E) and cell cycle (F) in NOMO-1 and U937 cells. (G and H) Effects of LDHB KD on apoptosis (G) and cell cycle (H) in NOMO-1 and U937 cells. (I and J) Effects of KD of FTO (left panel), PFKP (middle panel), and LDHB (right panel) on glycolytic rates in normal CD34+ HSPCs. The same control shNS group was used for the analysis. (K) Schematic illustration of mouse MA9 cell colony forming assay. (L) Effects of Pfkp (upper panel) or Ldhb (lower panel) KD on colony forming/replating capacity of mouse MA9 cells. Data are represented as mean ± SD. ns, not significant (p ≥ 0.05); *, p < 0.05; **, p < 0.01; ***, p < 0.001. See also Figure S6.
Figure 7.
Figure 7.. The FTO/m6A/PFKP/LDHB axis regulates leukemogenesis in vivo and has clinical relevance
(A) KD of FTO decreased leukemia burden in vivo. Representative in vivo pseudocolor bioluminescence images of NRGS mice transplanted with control or FTO-KD MONO-MAC-6 cells. Unit of Radiance is “photons/second/cm2/steradian”. (B) KD of PFKP or LDHB decreased leukemia burden in vivo. (C and D) Kaplan-Meier survival curves showing the effects of FTO KD (C) and PFKP or LDHB KD (D) on progression of human AML cells in NRGS mice. (E and F) Positive correlation between FTO and PFKP (E) or LDHB (F) in expression in AML. (G and H) Effects of R-2HG treatment (24 h) on glycolytic rates (left panel) and mitochondrial respiration (right panel) in IDH-wildtype (G) and IDH-mutant (H) AML patient-derived cells. (I) Effects of R-2HG treatment (48 h) on protein levels of FTO, PFKP, and LDHB in IDH-wildtype AML patient-derived cells. (J) Cartoon illustration of the proposed model in this study. Data are represented as mean ± SD. ***, p < 0.001. See also Figure S7 and Table S6.

References

    1. Ashcroft SJ, Weerasinghe LC, Bassett JM, and Randle PJ (1972). The pentose cycle and insulin release in mouse pancreatic islets. The Biochemical journal 126, 525–532. - PMC - PubMed
    1. Bonnet S, Archer SL, Allalunis-Turner J, Haromy A, Beaulieu C, Thompson R, Lee CT, Lopaschuk GD, Puttagunta L, Bonnet S, et al. (2007). A mitochondria-K+ channel axis is suppressed in cancer and its normalization promotes apoptosis and inhibits cancer growth. Cancer Cell 11, 37–51. - PubMed
    1. Brisson L, Banski P, Sboarina M, Dethier C, Danhier P, Fontenille MJ, Van Hee VF, Vazeille T, Tardy M, Falces J, et al. (2016). Lactate Dehydrogenase B Controls Lysosome Activity and Autophagy in Cancer. Cancer Cell 30, 418–431. - PubMed
    1. Campeau E, Ruhl VE, Rodier F, Smith CL, Rahmberg BL, Fuss JO, Campisi J, Yaswen P, Cooper PK, and Kaufman PD (2009). A versatile viral system for expression and depletion of proteins in mammalian cells. PLoS One 4, e6529. - PMC - PubMed
    1. Cancer Genome Atlas Research, N., Brat DJ, Verhaak RG, Aldape KD, Yung WK, Salama SR, Cooper LA, Rheinbay E, Miller CR, Vitucci M, et al. (2015). Comprehensive, Integrative Genomic Analysis of Diffuse Lower-Grade Gliomas. N Engl J Med 372, 2481–2498. - PMC - PubMed

Publication types

MeSH terms