. 2021 Mar 10;29(3):408-424.e7.
doi: 10.1016/j.chom.2020.12.004. Epub 2021 Jan 11.

A microbial metabolite remodels the gut-liver axis following bariatric surgery

Affiliations

A microbial metabolite remodels the gut-liver axis following bariatric surgery

Snehal N Chaudhari et al. Cell Host Microbe. .

Abstract

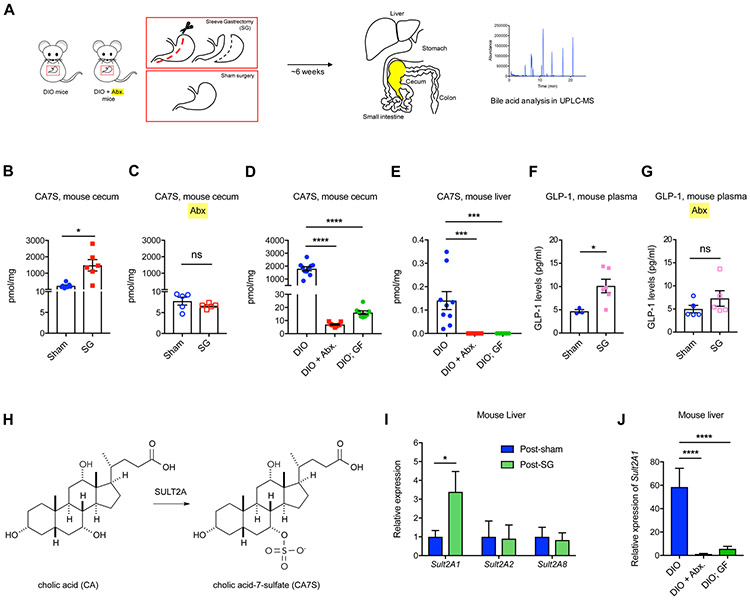
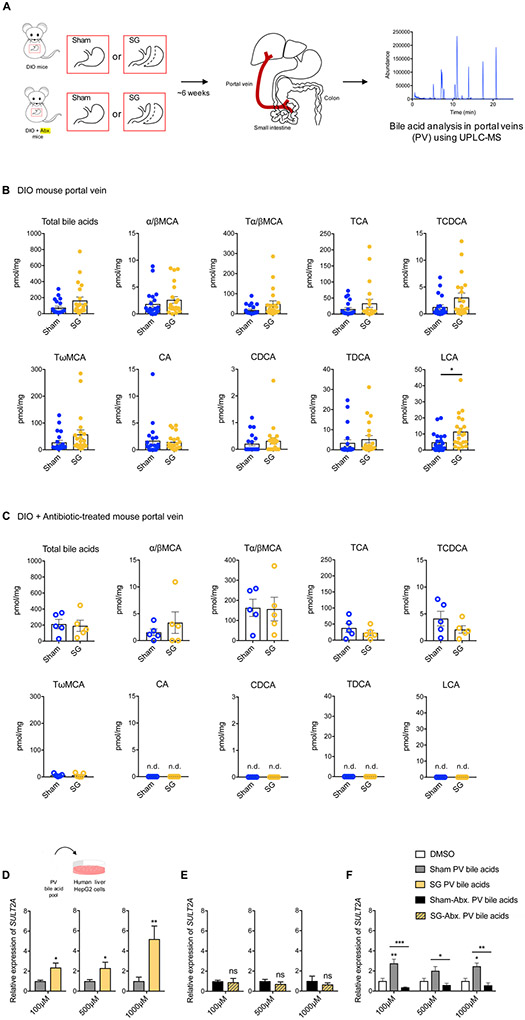
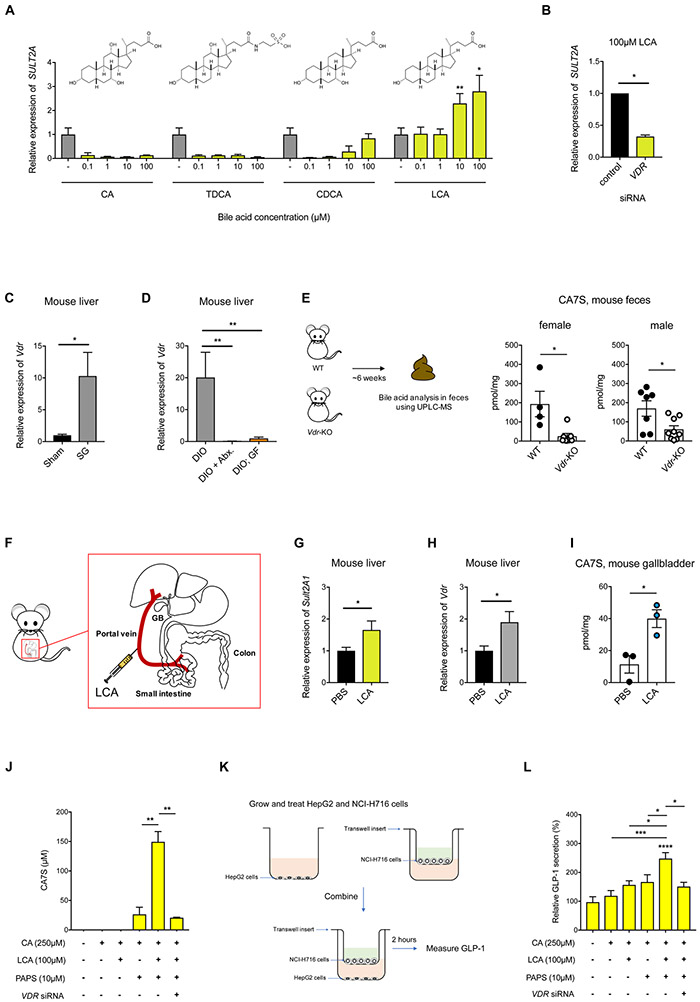
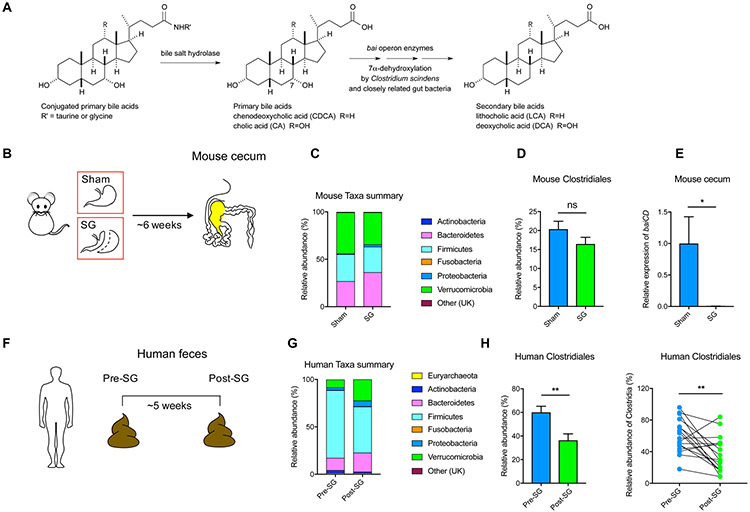
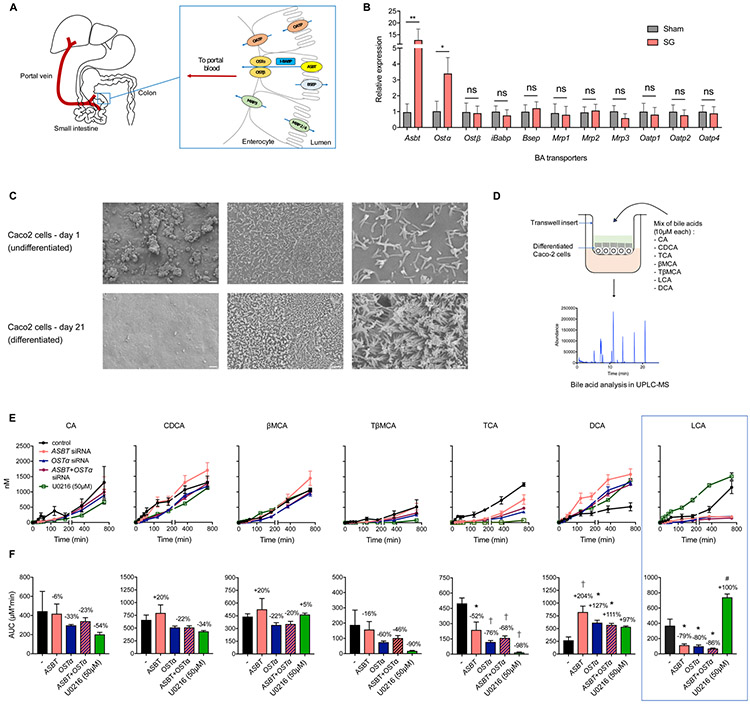
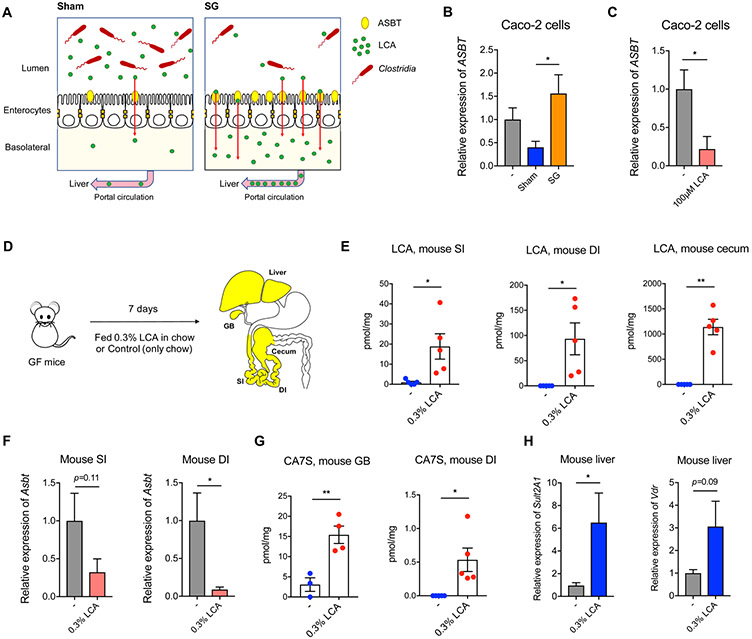
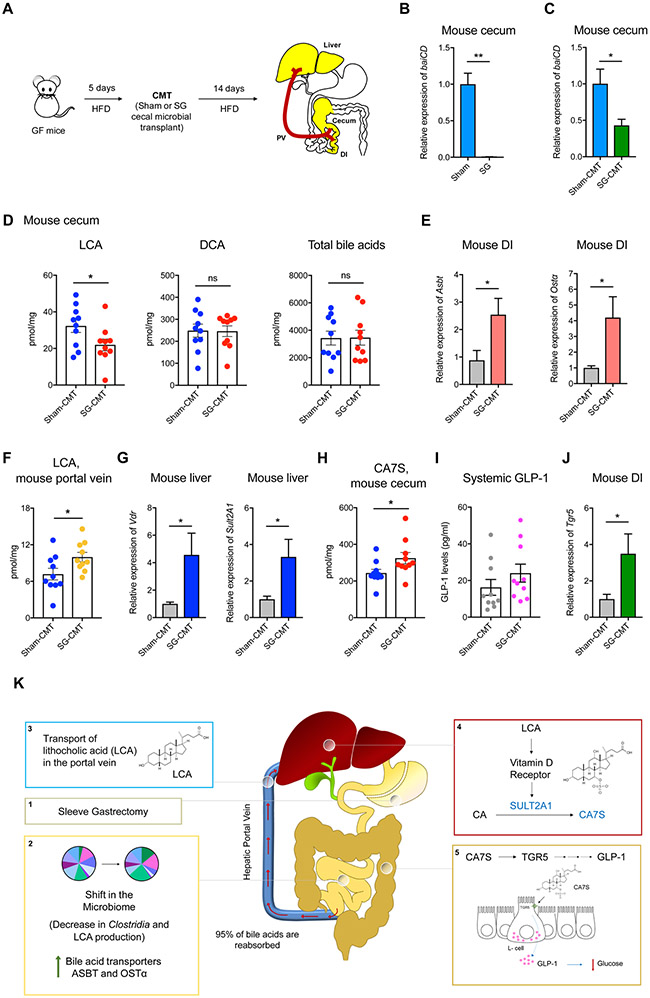
Bariatric surgery is the most effective treatment for type 2 diabetes and is associated with changes in gut metabolites. Previous work uncovered a gut-restricted TGR5 agonist with anti-diabetic properties-cholic acid-7-sulfate (CA7S)-that is elevated following sleeve gastrectomy (SG). Here, we elucidate a microbiome-dependent pathway by which SG increases CA7S production. We show that a microbial metabolite, lithocholic acid (LCA), is increased in murine portal veins post-SG and by activating the vitamin D receptor, induces hepatic mSult2A1/hSULT2A expression to drive CA7S production. An SG-induced shift in the microbiome increases gut expression of the bile acid transporters Asbt and Ostα, which in turn facilitate selective transport of LCA across the gut epithelium. Cecal microbiota transplant from SG animals is sufficient to recreate the pathway in germ-free (GF) animals. Activation of this gut-liver pathway leads to CA7S synthesis and GLP-1 secretion, causally connecting a microbial metabolite with the improvement of diabetic phenotypes.

Keywords: bariatric surgery; bile acids; gut-liver axis; microbiome.


Conflict of interest statement

Declaration of interests CA7S is a subject of patents held by HMS and BWH on which S.N.C., D.A.H., E.G.S., and A.S.D. are inventors. A.S.D. is a consultant for Takeda Pharmaceuticals and HP Hood. E.G.S. is a consultant for Vicarious Surgical, Inc. and was previously on the scientific advisory board of Kitotech, Inc.

Figures

Figure 1.
Figure 1.. Sleeve Gastrectomy (SG)-mediated increase in levels of CA7S and GLP-1 requires a microbiome
(A) Schematic of SG and sham surgery in diet-induced obese (DIO) mice treated with or without antibiotics (Abx.). (B,C) CA7S levels in cecal contents of mice subjected to SG or Sham surgeries treated with or without antibiotics (Abx.) (B, Sham n=7, SG n=6, *p=0.01; C, n=5 in each group, ns=not significant p=0.26, Welch’s t test). (D,E) CA7S levels in cecal contents (D) and liver (E) of conventional DIO mice were significantly higher than antibiotic-treated (+ Abx.) or GF DIO mice (Cecum: DIO, n=10, DIO + Abx., n=9, DIO; GF, n=8, DIO vs. DIO + Abx. ****p<1.00x10⁻⁴, DIO vs. DIO;GF ****p<1.00x10⁻⁴; Liver: DIO, n=9, DIO + Abx., n=9, DIO; GF, n=8; DIO vs. DIO + Abx. ***p=2.00x10⁻⁴, DIO vs. DIO; GF ***p=5.00x10⁻⁴, one-way ANOVA followed by Dunnett’s multiple comparisons test). (F,G) GLP-1 levels in systemic circulation of mice subjected to SG or Sham surgeries treated with or without antibiotics. (Data not marked with asterisk(s) are not significant. For F, Sham n=3, SG n=6, *p=0.01; for G, n=5 in each group, p=0.26, Welch’s t test). (H) The mammalian sulfotransferase enzyme SULT2A (mSULT2A in mice and hSULT2A in humans) catalyzes the conversion of the primary bile acid cholic acid (CA) to cholic acid-7-sulfate (CA7S). (I) qRT-PCR quantification of mSult2A isoforms reported to sulfate bile acids in the murine liver. Expression levels were normalized to 18S (data not marked with asterisk(s) are not significant. n=11 in each group, mSult2A1 *p=0.04, mSult2A2 p=0.92, mSult2A8 p=0.78, Welch’s t test). (J) As measured by qRT-PCR, the hepatic expression of mSult2A1 was significantly higher in DIO mice than DIO + Abx. mice and DIO;GF mice. Expression levels were normalized to mouse ribosomal 18S (DIO, n=9, DIO + Abx., n=9, DIO;GF, n=8; DIO vs. DIO + Abx. ****p<1x10⁻⁴, DIO vs. DIO;GF ****p<1x10⁻⁴, one-way ANOVA followed by Dunnett’s multiple comparisons test). All data are presented as mean ± SEM.
Figure 2.
Figure 2.. Portal vein BAs induce expression of hSULT2A1 in hepatocytes in vitro
(A) Schematic of portal vein BA analysis in indicated groups of mice. (B) Portal vein BAs in DIO mice 6 weeks post-Sham and SG (n=21 in each group; data not marked with asterisk(s) are not significant). All bile acids with measurable concentrations above the limit of detection are shown. Lithocholic acid (LCA) was the only bile acid whose levels were significantly increased post-SG (*p=0.01). (Total bile acids, p=0.51, α/βMCA, alpha-muricholic acid and beta-muricholic acid, p=0.35, Tα/βMCA, tauro-alpha- and tauro-beta-muricholic acid, p=0.08; TCA, tauro-cholic acid, p=0.20; TCDCA, tauro-chenodeoxycholic acid, p=0.07; TωMCA, tauro-omega-muricholic acid, p=0.11; CA, cholic acid, p=0.78; CDCA, chenodeoxycholic acid, p=0.45; TDCA, tauro-deoxycholic acid, p=0.45; Welch’s t test). (C) Portal vein BAs in DIO mice treated with antibiotics post-sham and SG (n=5 in each group; data not marked with asterisk(s) are not significant. LCA, CA, TDCA, and CDCA were undetectable in portal veins of both groups. (Total bile acids, p=0.81, α/βMCA, alpha-muricholic acid and beta-muricholic acid, p=0.43; Tα/βMCA, tauro-alpha- and tauro-beta-muricholic acid, p=0.93; TCA, tauro-cholic acid, p=0.36; TCDCA, tauro-chenodeoxycholic acid, p=0.23; TωMCA, tauro-omega-muricholic acid, p=0.98; CA, cholic acid; CDCA, chenodeoxycholic acid; TDCA, tauro-deoxycholic acid; LCA, lithocholic acid, not detected (n.d.), Welch’s t test). (D-F) Concentrated pools of bile acids mimicking the mean physiological ratios of individual portal vein bile acids measured in conventional sham and SG and antibiotic-treated sham and SG mice were generated in vitro in DMSO. HepG2 cells were treated with dilutions of these pools (total bile acid concentrations of 100 μM, 500 μM, and 1000 μM). (D) As measured by qRT-PCR, the expression of hSULT2A was increased in conventional SG PV BA-treated cells compared to conventional sham PV BA-treated cells. For each concentration, expression of sham hSULT2A was normalized to 1. hSULT2A expression was normalized to human GAPDH (≥3 biological replicates per condition, SG PV bile acids, 100 μM *p=0.01, 500 μM *p=0.02, 1000 μM **p=1.00x10⁻³, Welch’s t test). (E) There were no significant differences in hSULT2A expression in cells incubated with Abx-treated SG and sham PV BA pools. For each concentration, expression of sham hSULT2A was normalized to 1. hSULT2A expression was normalized to human GAPDH (≥3 biological replicates per condition, SG-Abx. PV bile acids, ns=not significant, 100 μM p=0.82, 500 μM p=0.37, 1000 μM p=0.60, Welch’s t test). (F) As measured by qRT-PCR, the expression of hSULT2A was increased in conventional sham PV BA-treated cells and decreased in antibiotic sham PV BA-treated cells relative to DMSO control. hSULT2A expression was normalized to human GAPDH (≥3 biological replicates per condition, data not marked with asterisk(s) are not significant, 100 μM DMSO vs. Sham **p=5.60x10⁻³; 100 μM DMSO vs. Sham-Abx. p=0.82; 100 μM Sham vs. Sham-Abx. ***p=1.00x10⁻⁴; 500 μM DMSO vs. Sham p=0.29; 500 μM DMSO vs. Sham-Abx. p=0.98; 500 μM Sham vs. Sham-Abx. *p=0.04; 1000 μM DMSO vs. Sham *p=0.03; 1000 μM DMSO vs. Sham-Abx. p=0.97; 1000 μM Sham vs. Sham-Abx. **p=2.30x10⁻³, two-way ANOVA followed by Dunnett’s multiple comparisons test). All data are presented as mean ± SEM.
Figure 3.
Figure 3.. LCA induces expression of SULT via the Vitamin D receptor (VDR), resulting in production of CA7S and GLP-1 secretion
(A) qRT-PCR quantification of hSULT2A expression level in HepG2 cells treated with indicated concentrations of CA, TDCA, CDCA, or LCA normalized to human GAPDH. LCA increased hSULT2A expression in a dose-dependent manner relative to DMSO control. (≥3 biological replicates per condition, data marked with asterisk(s) are only for induction of hSULT2A. CA, 0.1 μM **p=8.90x10⁻³, 1 μM **p=5.40x10⁻³, 10 μM **p=5.30x10⁻³, 100 μM **p=8.40x10⁻³; TDCA, 0.1 μM ****p=1.00x10⁻⁴, 1 μM ****p=1.00x10⁻⁴, 10 μM ****p=1.00x10⁻⁴, 100 μM ****p=1.00x10⁻⁴; CDCA, 0.1 μM **p=1.80x10⁻³, 1 μM **p=2.50x10⁻³, 10 μM **p=9.30x10⁻³, 100 μM p=0.21; LCA, 0.1 μM p=0.92, 1 μM p=0.95, 10 μM **p=5.86x10⁻³, 100 μM *p=0.04, one-way ANOVA followed by Dunnett’s multiple comparisons test). (B) siRNA-mediated knockdown of VDR significantly reduced LCA-mediated induction of hSULT2A in HepG2 cells compared to negative control siRNA (≥3 biological replicates per condition, *p=0.01, Welch’s t test). (C) Vdr expression levels in mouse livers were increased in SG compared to sham mice as determined by qRT-PCR. Expression was normalized to mouse ribosomal 18S (n=11 in each group; *p=0.02, Welch’s t test). (D) Hepatic expression of Vdr was increased in DIO mice compared to DIO + Abx. mice and DIO; GF mice. Expression levels were normalized to mouse ribosomal 18S (DIO, n=9, DIO + Abx., n=10, DIO;GF, n=8; DIO vs. DIO + Abx. **p=3.50x10⁻³, DIO vs. DIO;GF **p=3.90x10⁻³, one-way ANOVA followed by Dunnett’s multiple comparisons test). (E) CA7S levels were reduced in feces of Vdr-knockout (KO) mice compared to wild-type (WT) mice (female WT, n=4, Vdr-KO, n=7, *p=0.01, male WT, n=7, Vdr-KO, n=9, *p=0.01, Welch’s t test). (F) Schematic of portal vein injection with LCA (GB=gallbladder). (G,H) Quantitative real time PCR quantification of mSult2A1 (G) and Vdr (H) expression levels in mouse livers injected with LCA or PBS normalized to mouse ribosomal 18S (n=3; for (G) *p=0.02, for (H) *p=0.03, Welch’s t test). (I) CA7S levels in the gallbladder of mice injected with LCA or PBS normalized to mouse ribosomal 18S (n=3; *p=0.02, Welch’s t test). (J) Synthesis of CA7S in HepG2 cells requires the cofactor PAPS, is induced upon incubation with LCA, and is dependent on VDR. Vdr siRNA was used to knockdown Vdr expression. 48 hours post-knockdown, substrate CA and ligand LCA was added as indicated. CA7S production was quantified by UPLC-MS after 16 hours. (≥3 biological replicates per condition, data marked with asterisk(s) are only for production of CA7S; CA+LCA+PAPS vs. CA+PAPS **p=2.70x10⁻³, CA+LCA+PAPS vs. CA+LCA+PAPS+Vdr siRNA **p=1.60x10⁻³, one-way ANOVA followed by Dunnett’s multiple comparisons test). (K) Schematic of co-culture study. Liver HepG2 cells were cultured in the basolateral chamber, while NCI-H716 enteroendocrine cells were cultured separately in transwell inserts, and combined to measure GLP-1 secretion for indicated treatments. (L) Secretion of GLP-1 by NCI-H716 cells co-cultured with HepG2 cells was induced by addition of LCA, CA, and PAPS to liver cells and was reduced by siRNA-mediated knockdown of VDR in liver cells. (≥3 biological replicates per condition, data not marked by asterisk(s) are not significant, DMSO vs. CA p=0.96; DMSO vs. CA+PAPS p=0.26; DMSO vs. CA+LCA p=0.12; DMSO vs. CA+LCA+PAPS ****p<1.00x10⁻⁴; DMSO vs. CA+LCA+PAPS+VDR siRNA p=0.49; CA vs. CA+LCA+PAPS ***p=3.00x10⁻³; CA+LCA vs. CA+LCA+PAPS *p=0.04; CA+PAPS vs. CA+LCA+PAPS *p=0.01; CA+LCA+PAPS vs. CA+LCA+PAPS+VDR siRNA *p=0.02, one-way ANOVA followed by Dunnett’s multiple comparisons test). All data are presented as mean ± SEM.
Figure 4.
Figure 4.. The production of the secondary bile acid LCA is decreased in mice and humans post-SG
(A) Host-produced conjugated bile acids are released into the gut post-prandially and converted into secondary bile acids through the enzymatic activity of gut bacteria. Deconjugation by bacterial bile salt hydrolases followed by 7α-dehydroxylation by enzymes encoded by the bile acid inducible (bai) operon converts cholic acid (CA) and chenodeoxycholic acid (CDCA) into deoxycholic acid (DCA) and lithocholic acid (LCA), respectively. (B) Schematic and timeline of sham and SG mouse cecal samples subjected to 16S sequencing. (C) Stacked bar plot showing mean relative abundances of phylum-level taxa in mouse samples (UK = Unknown, Sham, n=15; SG, n=17). (D) Relative abundance of Clostridiales in sham and SG mice (Sham, n=15; SG, n=17, p=0.16, ns=not significant, Welch’s t test). (E) qRT-PCR quantification of baiCD gene cluster expression levels in sham and SG mouse cecal contents normalized to bacterial 16S ribosomal DNA (Sham, n=10, SG, n=14, *p=0.02, Welch’s t test). (F) Schematic and timeline of human pre- and post-SG fecal samples subjected to 16S sequencing. (G) Stacked bar plot showing mean relative abundances of phylum-level taxa in human samples (UK = Unknown, n=17 patients). (H) Relative abundance of Clostridiales in pre- and post-SG human feces (n=17 patients, **p=4.80x10⁻³, paired t test). All data are presented as mean ± SEM.
Figure 5.
Figure 5.. Intestinal BA transport proteins ASBT and OSTα facilitate selective transport of LCA into the portal vein
(A) Schematic of proteins involved in BA transport from the intestinal lumen into the portal vein. (B) qRT-PCR quantification of BA transport protein expression levels in sham and SG mouse distal ileum normalized to mouse ribosomal 18S. The expression of Asbt (apical sodium-dependent bile acid transporter) and Ostα (organic solute transporter α) were significantly increased post-SG. (Sham, n=15; SG, n=17; Asbt **p=8.80x10⁻³, Ostα *p=0.04, Ostβ p=0.89, iBabp p=0.76, Bsep p=0.64, Mrp1 p=0.89, Mrp2 p=0.89, Mrp3 p=0.35, Oatp1 p=0.78, Oatp2 p=0.68, Oatp4 p=0.84, ns=not significant, Welch’s t test). (C) SEM images of undifferentiated and differentiated Caco-2 cells in transwells. Scale bars indicate (L to R): 400 μm, 20 μm, and 4 μm. (D) Schematic of BA transport study. Caco-2 cells differentiated in transwells were treated with a defined mixture of indicated BAs at 10 μM each, followed by measurement of BA transport to the basolateral chamber. (E,F) Transport of indicated BAs from the apical chamber across differentiated Caco-2 cells into the basolateral chamber over 12 hours as measured by UPLC-MS. Area-under-the-curve graphs in (F) correspond to timecourses directly above in (E). siRNA-mediated knockdown of ASBT, OSTα, or ASBT+OSTα reduced transport of LCA and TCA, increased transport of DCA, and did not affect transport of CA, CDCA, βMCA, or TβMCA. Treatment with U0126 (50 μM), a small molecule that increases expression of ASBT, increased transport of LCA but not the other BAs tested. (≥3 biological replicates per condition, *p<0.05, #p<0.01 p<1.00x10⁻³, data not marked are not significant; CA (ASBT) p=0.99, CA (OSTα) p=0.91, CA (ASBT+OSTα) p=0.97, CA (U0126) p=0.65; CDCA (ASBT) p=0.78, CDCA (OSTα) p=0.73, CDCA (ASBT+OSTα) p=0.73, CDCA (U0126) p=0.38; βMCA (ASBT) p=0.81, βMCA (OSTα) p=0.74, βMCA (ASBT+OSTα) p=0.81, βMCA (U0126) p=0.99; TβMCA (ASBT) p=0.99, TβMCA (OSTα) p=0.66, TβMCA (ASBT+OSTα) p=0.83, TβMCA (U0126) p=0.31; TCA (ASBT) *p=0.01, TCA (OSTα) p=7.00x10⁻⁴, TCA (ASBT+OSTα) p=1.70x10⁻⁴, TCA (U0126) p=1.00x10⁻⁴; DCA (ASBT) p=6.00x10⁻⁴, DCA (OSTα) *p=0.02, DCA (ASBT+OSTα) *p=0.04, DCA (U0126) p=0.08; LCA (ASBT) *p=0.03, LCA (OSTα) *p=0.02, LCA (ASBT+OSTα) *p=0.01, LCA (U0126) #p=2.80x10⁻³, one-way ANOVA followed by Turkey’s (HSD) post-hoc test). All data are presented as mean ± SEM.
Figure 6.
Figure 6.. LCA is sufficient to inhibit Asbt expression and induce production of CA7S
(A) Schematic of sham and SG intestine BA transport modulated by the production of LCA by Clostridia. Levels of Clostridia and LCA production are higher in sham mice. LCA inhibits Asbt expression, resulting in less transport of LCA into the portal vein. In contrast, levels of Clostridia and LCA are lower in SG mice, allowing for higher expression of Asbt and increased transport of LCA from the gut to the liver in SG animals. (B) The sham cecal pool of BAs inhibited expression of ASBT compared to the SG cecal pool of BAs (3 biological replicates per condition, Sham vs. SG cecal pool *p=0.02, one-way ANOVA followed by Dunnett’s multiple comparisons test (C) LCA (100 μM) inhibited expression of ASBT in Caco-2 cells. (3 biological replicates per condition, *p=0.02, Welch’s t test). (D) Schematic of GF mice administered 0.3% LCA (w/w) in chow for 1 week prior to harvesting tissues for analyses. (E) LCA feeding led to accumulation of LCA in the proximal small intestine (SI), distal ileum (DI) and cecum of GF mice. (n=5 in each group, SI *p=0.04; DI *p=0.04; cecum **p=1.70x10⁻³, Welch’s t test). (F) LCA inhibited expression of Asbt in SI and DI (n=5 in each group, SI p=0.11; DI *p=0.02, Welch’s t test). (G) Introduction of LCA in GF mice induced CA7S production and accumulation in the gallbladder (GB) and the distal ileum (DI) (GB, GF n=3, GF+LCA n=4, **p=6.50x10⁻³; DI, n=5 in each group, *p=0.03, Welch’s t test). (H) LCA feeding led to increased expression of mSult2A1 and Vdr in livers of mice fed 0.3% LCA in chow (n=5 in each group, mSult2A1 *p=0.04, Vdr p=0.09, Welch’s t test). All data are presented as mean ± SEM.
Figure 7.
Figure 7.. SG microbiota transfer recreates the CA7S pathway in GF mice
(A) Schematic of cecal microbial transplant (CMT). GF mice were fed a high-fat diet (HFD) for 5 days prior to CMT. Six weeks post-op sham and SG cecal stool were anaerobically homogenized and gavaged into GF animals. Two weeks post-gavage, mice were sacrificed, and their tissues were harvested for analyses. (B,C) qRT-PCR quantification of baiCD gene cluster expression levels in donor sham and SG mouse cecal contents (B) and recipient sham-CMT and SG-CMT mouse cecal contents (C) normalized to bacterial 16S ribosomal DNA (Sham, n=4, SG, n=4, **p=7.00x10⁻³; Sham-CMT, n=10, SG-CMT, n=10, *p=0.01, Welch’s t test). (D) LCA levels were reduced in cecal contents of SG-CMT compared to sham-CMT mice. DCA and total bile acid levels did not differ between the two groups (n=10 in each group; LCA, lithocholic acid *p=0.04; DCA, deoxycholic acid p=0.95; Total bile acids p=0.95, ns=not significant, Welch’s t test). (E) qRT-PCR quantification of BA transport protein expression levels in sham-CMT and SG-CMT mouse distal ileum (DI) normalized to mouse ribosomal 18S. The expression of Asbt (apical sodium-dependent bile acid transporter) and Ostα (organic solute transporter α) were significantly increased in SG-CMT (n=10 in each group, Asbt *p=0.02; Ostα *p=0.02, Welch’s t test). (F) Portal vein LCA in sham-CMT and SG-CMT mice. LCA was the only bile acid whose levels were significantly increased post-SG (n=10 in each group, LCA *p=0.03, Welch’s t test) (G) qRT-PCR quantification of mSult2A1 and Vdr expression levels in sham-CMT and SG-CMT mouse livers normalized to mouse ribosomal 18S. mSult2A1 and Vdr expression was significantly increased in SG-CMT (n=10 in each group, mSult2A1 *p=0.02; Vdr *p=0.02, Welch’s t test) (H) CA7S levels were increased in cecal contents of SG-CMT compared to sham-CMT mice. (n=10 in each group; CA7S, cholic acid-7-sulfate *p=0.04, Welch’s t test). (I) SG-CMT (cecal microbial transplant) mice have higher levels of GLP-1 compared to Sham-CMT (n=10 in each group, p=0.25, not significant, Welch’s t test). (J) qRT-PCR quantification of Tgr5 expression levels in sham-CMT and SG-CMT mouse distal ileum (DI) normalized to 18S. Tgr5 expression was significantly increased in SG-CMT (n=10 in each group, Tgr5 *p=0.03, Welch’s t test). All data are presented as mean ± SEM. (K) Model for LCA-mediated induction of CA7S synthesis and downstream GLP-1 secretion post-SG. Sleeve gastrectomy (1) results in a shift in the microbiome, specifically a decrease in Clostridia and LCA production, thus inducing an increase of the BA transporters ASBT and OSTα in the intestine (2), which in turn selectively transport LCA into the portal vein (3); LCA is delivered to the liver, where this molecule agonizes VDR, thereby increasing the expression of hSULT2A/mSult2A1 and CA7S synthesis (4). CA7S is then stored in the gallbladder and secreted into the gut. In the colon, CA7S agonizes and increases expression of TGR5 in intestinal L cells, resulting in secretion of GLP-1 (5), an incretin hormone that exerts global glucoregulatory effects.

Comment in

References

    1. Abbasi J (2017). Unveiling the "Magic" of Diabetes Remission After Weight-Loss Surgery. JAMA 317, 571–574. - PubMed
    1. Adhikari AA, Seegar TCM, Ficarro SB, McCurry MD, Ramachandran D, Yao L, Chaudhari SN, Ndousse-Fetter S, Banks AS, Marto JA, et al. (2020). Development of a covalent inhibitor of gut bacterial bile salt hydrolases. Nat Chem Biol 16, 318–326. - PMC - PubMed
    1. Alnouti Y (2009). Bile Acid sulfation: a pathway of bile acid elimination and detoxification. Toxicol Sci 108, 225–246. - PubMed
    1. Bachmanov AA, Reed DR, Beauchamp GK, and Tordoff MG (2002). Food intake, water intake, and drinking spout side preference of 28 mouse strains. Behav Genet 32, 435–443. - PMC - PubMed
    1. Besnard P, Landrier JF, Grober J, and Niot I (2004). [Is the ileal bile acid-binding protein (I-BABP) gene involved in cholesterol homeostasis?]. Med Sci (Paris) 20, 73–77. - PubMed

Publication types