. 2021 Mar:127:102045.
doi: 10.1016/j.tube.2020.102045. Epub 2021 Jan 2.

Immune variations throughout the course of tuberculosis treatment and its relationship with adrenal hormone changes in HIV-1 patients co-infected with Mycobacterium tuberculosis

Affiliations

Immune variations throughout the course of tuberculosis treatment and its relationship with adrenal hormone changes in HIV-1 patients co-infected with Mycobacterium tuberculosis

María Belén Vecchione et al. Tuberculosis (Edinb). 2021 Mar.

Abstract

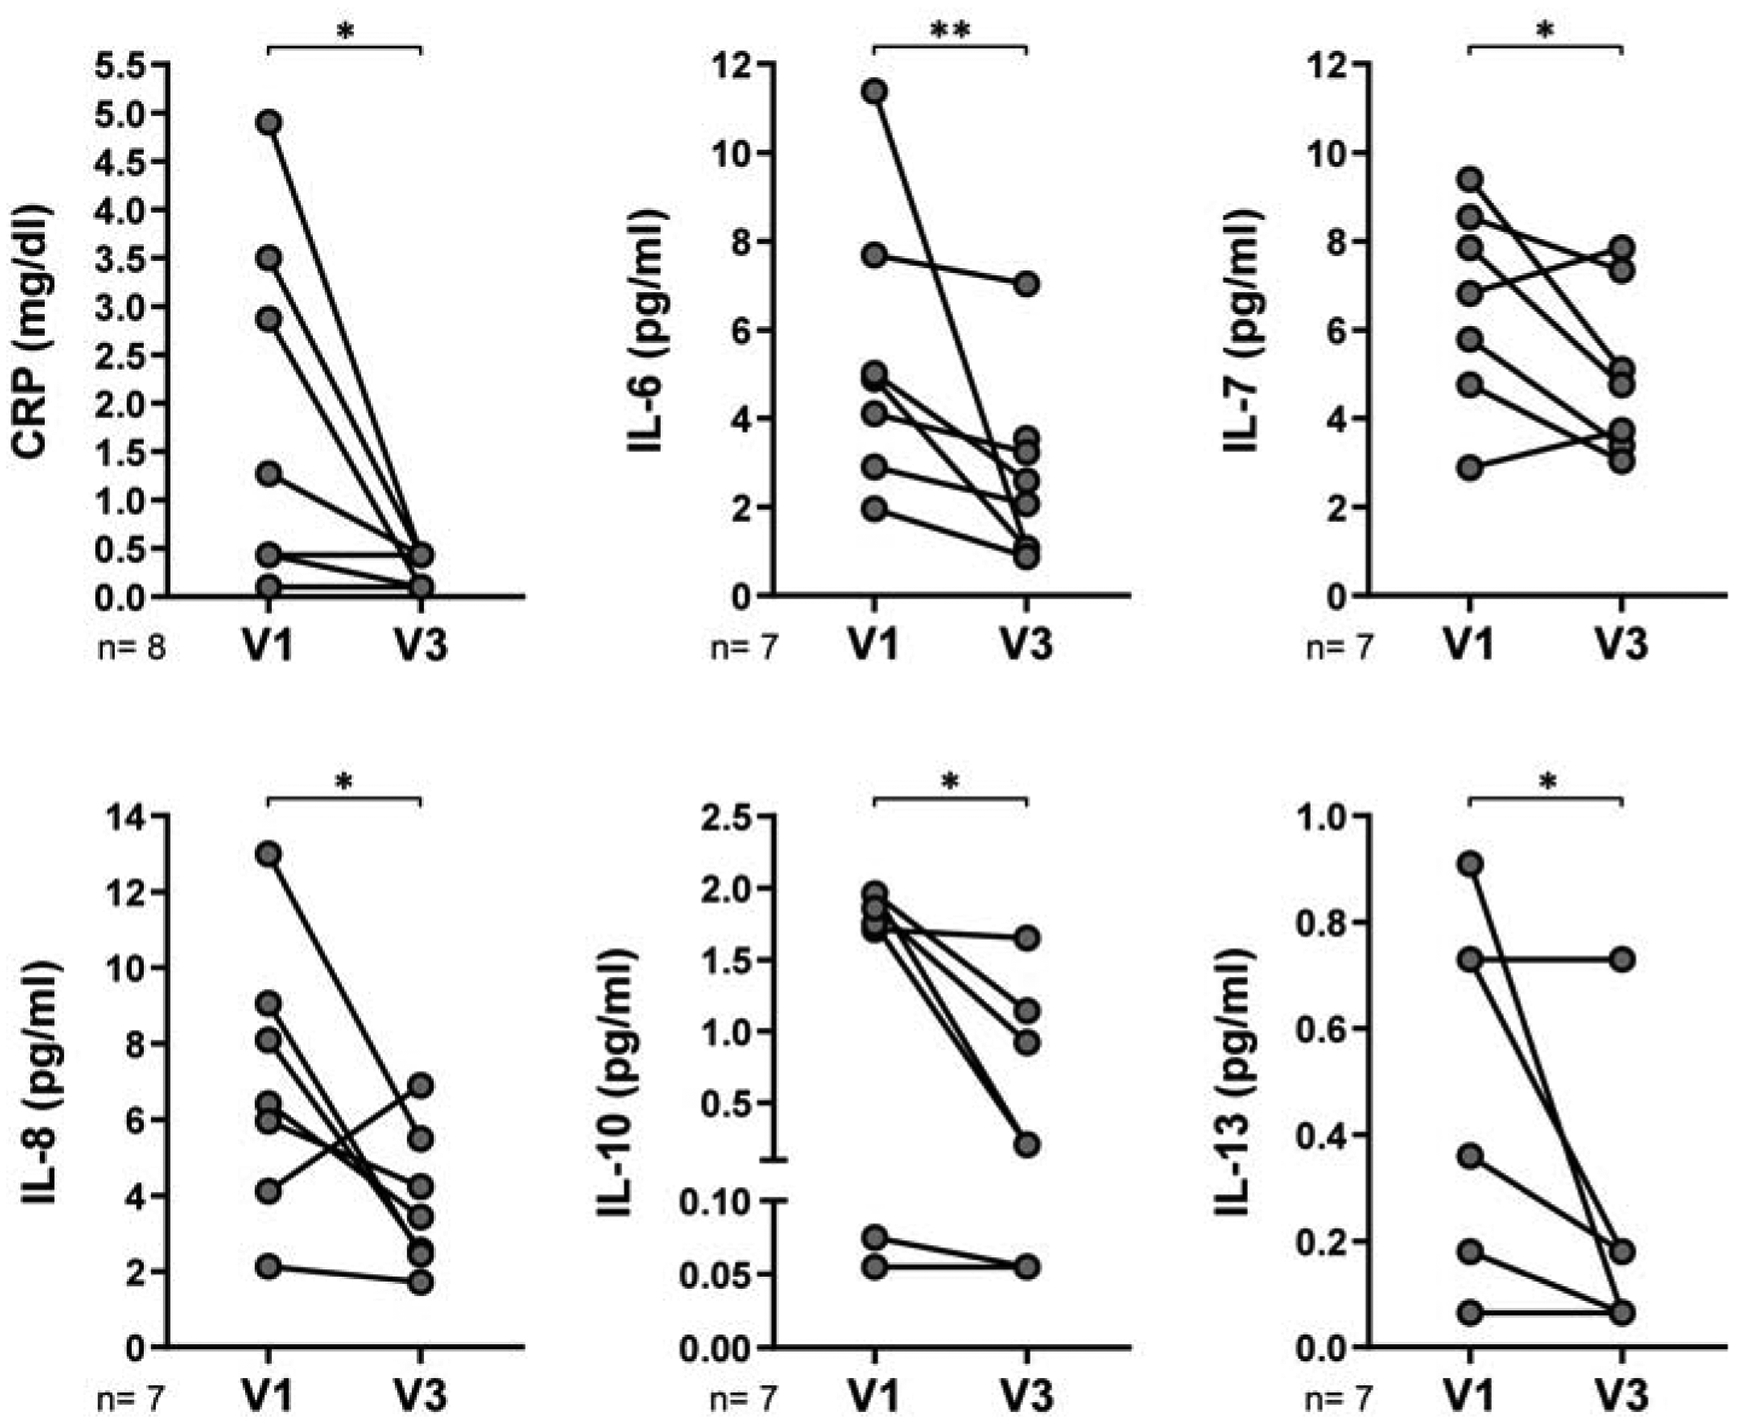
HIV infection is a major risk factor predisposing for Mycobacterium tuberculosis infection and progression to active tuberculosis (TB). As host immune response defines the course of infection, we aimed to identify immuno-endocrine changes over six-months of anti-TB chemotherapy in HIV+ people. Plasma levels of cortisol, DHEA and DHEA-S, percentages of CD4+ regulatory T cell subsets and number of IFN-γ-secreting cells were determined. Several cytokines, chemokines and C-reactive protein levels were measured. Results were correlated with clinical parameters as predictors of infection resolution and compared to similar data from HIV+ individuals, HIV-infected persons with latent TB infection and healthy donors. Throughout the course of anti-TB/HIV treatment, DHEA and DHEA-S plasma levels raised while cortisol diminished, which correlated to predictive factors of infection resolution. Furthermore, the balance between cortisol and DHEA, together with clinical assessment, may be considered as an indicator of clinical outcome after anti-TB treatment in HIV+ individuals. Clinical improvement was associated with reduced frequency of unconventional Tregs, increment in IFN-γ-secreting cells, diminution of systemic inflammation and changes of circulating cytokines and chemokines. This study suggests that the combined anti-HIV/TB therapies result in partial restoration of both, immune function and adrenal hormone plasma levels.

Keywords: Adrenal hormones; Cytokines; HIV-TB coinfection; Prospective study; Regulatory T cells; Tuberculosis.


Conflict of interest statement

Declaration of competing interest

The authors declare that they have no competing interests.

Figures

Figure 1.
Figure 1.. Clinical status of the study population.
Blood samples from HIV-TB patients were collected at the time of TB diagnosis (Visit 1 or V1) and approximately three (V2) and six (V3) months after TB treatment initiation. Additionally, samples from HIV, HIV-LTB and HD were collected. Plasma viral load, whole-blood CD4 T-cell counts and CD4/CD8 T cell ratio were measured. Data is presented as median with interquartile range (IQR). Each symbol represents an individual subject. Kruskal-Wallis test *p < 0.05, **p < 0.01, ***p < 0.005 and ***p < 0.001.
Figure 2.
Figure 2.. Evaluation of adrenal hormone plasma concentrations in HIV-TB patients, mono-infected HIV+ individuals, latent TB HIV+ subjects and HD.
Blood samples from HIV-TB patients were collected at the time of TB diagnosis (Visit 1 or V1) and approximately three (V2) and six (V3) months after TB treatment initiation. Additionally, samples from HIV, HIV-LTB and HD were collected. (A) Comparison of plasma levels of DHEA-S, DHEA and cortisol among the recruited groups. (B) Cortisol/DHEA-S and cortisol/DHEA ratios in HIV-TB, HIV, HIV-LTB and HD. Data is presented as median with interquartile range (IQR). Each symbol represents an individual subject. Kruskal-Wallis test *p < 0.05, **p < 0.01, ***p < 0.005 and ***p < 0.001.
Figure 3.
Figure 3.. Modulation of M. tuberculosis-induced IFN-γ production and the frequency of regulatory CD4+ T cell subsets throughout the course of tuberculosis treatment and among HIV-TB patients, mono-infected HIV+ individuals, latent TB HIV+ subjects and HD.
Blood samples from HIV-TB patients were collected at the time of TB diagnosis (Visit 1 or V1) and approximately three (V2) and six (V3) months after TB treatment initiation. Additionally, samples from HIV, HIV-LTB and HD were collected. (A) Absolute numbers of IFN-γ producer cells from PBMC of the recruited cohorts, previously stimulated with M. tuberculosis. Results were expressed as spot forming units (SFU)/106 PBMC, after subtraction of the negative-control values. (B) Analysis of Tregs and uTregs populations across the spectrum of TB infection. Data is presented as median with interquartile range (IQR). Each symbol represents an individual subject. Kruskal-Wallis test *p < 0.05, **p < 0.01, ***p < 0.005 and ***p < 0.001.
Figure 4.
Figure 4.. Heatmap representing the Spearman correlation matrix among adrenal hormones plasma levels, immunological status and clinical data from HIV-TB patients.
Correlation analysis among variables were performed for (A) V1, (B) V2 and (C) V3. Annotations on top and the side of the heatmap exhibit the parameters associated. Colored intersections indicate significant correlations (p<0.05) and values within the matrix exhibit Spearman’s rank correlation coefficient (r). Color scheme from green to red assesses the relationship between two variables and represents r values (from 1 to - 1).
Figure 5.
Figure 5.. Association among localization of TB, clinical parameters, plasma levels of adrenal hormones and immune status in HIV-TB patients.
Clinal data (A), hormone plasma levels (B) and specific Mtb immune response and frequency of regulatory CD4+ T cells (C) were associated with patients diagnosed with pulmonary (P) or extrapulmonary (E) TB at V1. Each symbol represents an individual subject. Mann-Whitney U test, *p<0.05, **p<0.01 and ***p<0.005.
Figure 6.
Figure 6.. Patient-to-patient comparison among clinical data, adrenal hormones plasma levels and immunological status and from HIV-TB at V1 and V3.
We contrasted (A) clinical data (viral load, absolute and nadir CD4+ T cell counts, CD4/CD8 cell ratio), (B) the levels measured for each hormone and (C) the immunological status from HIV-TB patients at V1 and V3. Each symbol represents an individual subject. Wilcoxon matched-pairs signed rank test, *p<0.05, **p<0.01, ***p<0.005 and ****p<0.001.
Figure 7.
Figure 7.. Patient-to-patient comparison among cytokine, chemokine and colony-stimulating factor levels from HIV-TB at V1 and V3.
We contrasted plasma levels of cytokines, chemokines and colony-stimulating factors from HIV-TB patients at V1 and V3. Each symbol represents an individual subject. Wilcoxon matched-pairs signed rank test, *p<0.05 and **p<0.01.

Similar articles

References

    1. World Health Organization. Global tuberculosis report 2019. 2019.
    1. Esmail H, Riou C, du Bruyn E, Lai RP-J, Harley YXR, Meintjes G, et al. The Immune Response to Mycobacterium tuberculosis in HIV-1-Coinfected Persons. Annu Rev Immunol 2018;36:annurev-immunol-042617–053420. 10.1146/annurev-immunol-042617-053420. - DOI - PubMed
    1. Tornheim JA, Dooley KE. Tuberculosis associated with HIV infection. Microbiol Spectr 2017;5:TNMI7–0028–2016. 10.1128/microbiolspec.TNMI7-0028-2016.Correspondence. - DOI - PMC - PubMed
    1. Díaz A, Bongiovanni B, D’Attilio L, Santucci N, Dídoli G, Fernández R del V, et al. The clinical recovery of tuberculosis patients undergoing specific treatment is associated with changes in the immune and neuroendocrine responses. Pathog Dis 2017;75:1–11. 10.1093/femspd/ftx087. - DOI - PubMed
    1. Kleynhans L, Ruzive S, Ehlers L, Thiart L, Chegou NN, Conradie M, et al. Changes in host immune-endocrine relationships during tuberculosis treatment in patients with cured and failed treatment outcomes. Front Immunol 2017;8:1–13. 10.3389/fimmu.2017.00690. - DOI - PMC - PubMed

Publication types

MeSH terms