. 2021 Apr:138:107731.
doi: 10.1016/j.bioelechem.2020.107731. Epub 2020 Dec 29.

A statistical framework for determination of minimal plasmid copy number required for transgene expression in mammalian cells

Affiliations

A statistical framework for determination of minimal plasmid copy number required for transgene expression in mammalian cells

Liangli Wang et al. Bioelectrochemistry. 2021 Apr.

Abstract

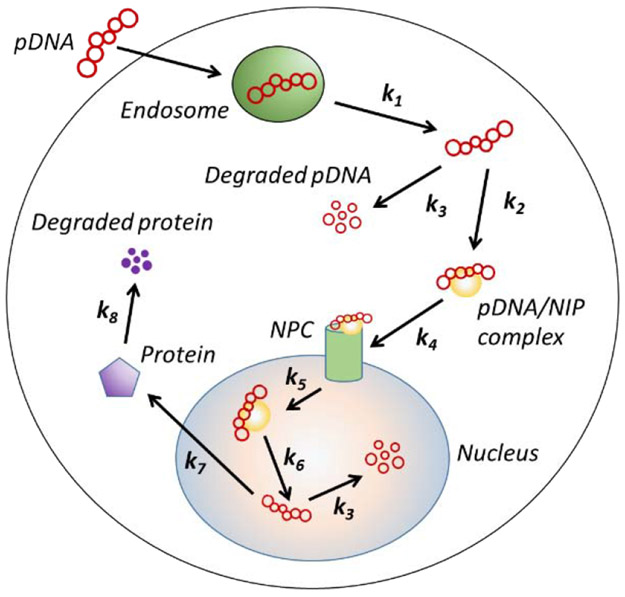
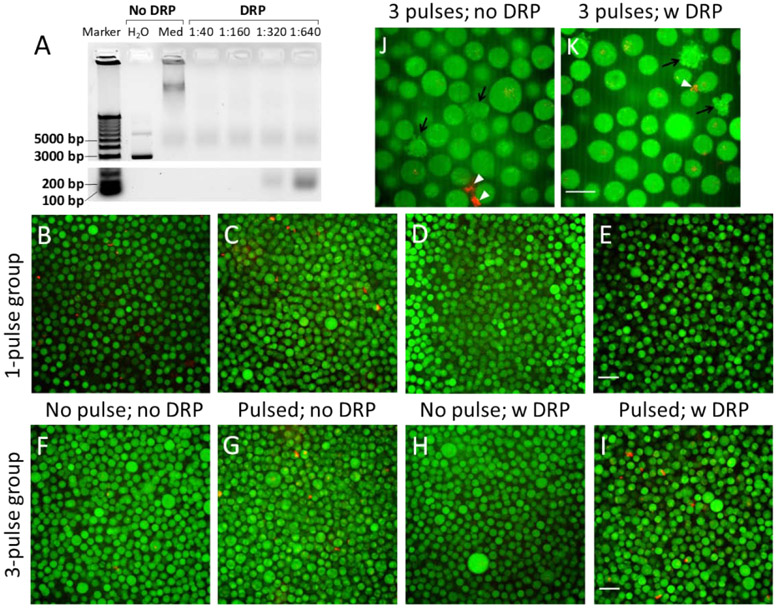
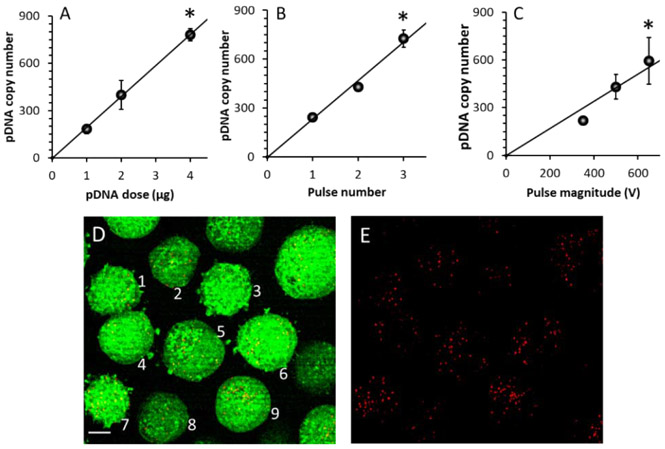
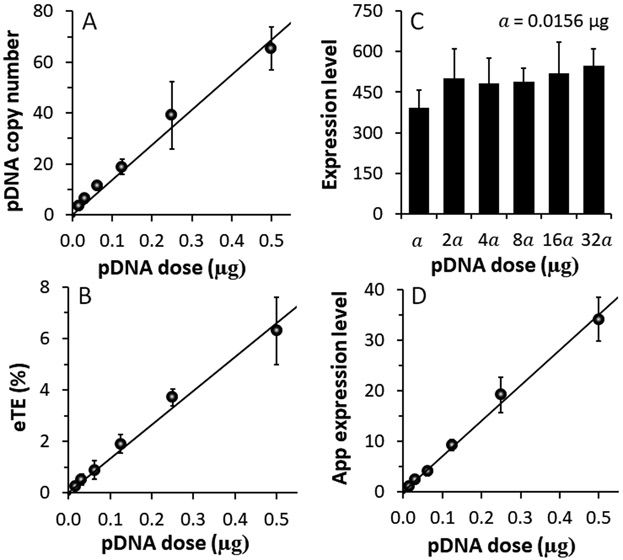
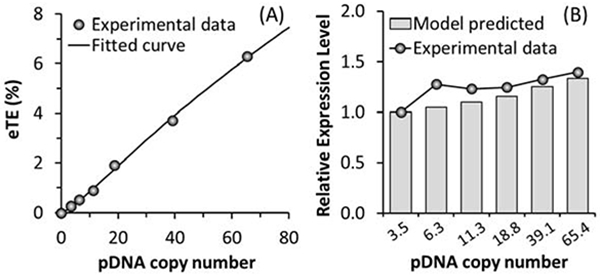
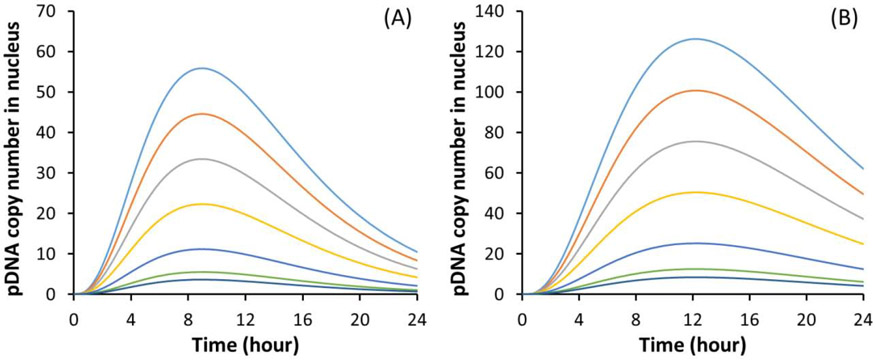
Plasmid DNA (pDNA) has been widely used for non-viral gene delivery. After pDNA molecules enter a mammalian cell, they may be trapped in subcellular structures or degraded by nucleases. Only a fraction of them can function as templates for transcription in the nucleus. Thus, an important question is, what is the minimal amount of pDNA molecules that need to be delivered into a cell for transgene expression? At present, it is technically a challenge to experimentally answer the question. To this end, we developed a statistical framework to establish the relationship between two experimentally quantifiable factors - average copy number of pDNA per cell among a group of cells after transfection and percent of the cells with transgene expression. The framework was applied to the analysis of electrotransfection under different experimental conditions in vitro. We experimentally varied the average copy number per cell and the electrotransfection efficiency through changes in extracellular pDNA dose, electric field strength, and pulse number. The experimental data could be explained or predicted quantitatively by the statistical framework. Based on the data and the framework, we could predict that the minimal number of pDNA molecules in the nucleus for transgene expression was on the order of 10. Although the prediction was dependent on the cell and experimental conditions used in the study, the framework may be generally applied to analysis of non-viral gene delivery.

Keywords: Copy number of DNA; Electroporation; Electrotransfection; Mathematical modeling; Non-viral gene delivery.


Conflict of interest statement

Declaration of Competing Interest The authors declare that they have no known competing financial interests or personal relationships that could have appeared to influence the work reported in this paper.

Figures

Figure 1.
Figure 1.
Schematic of kinetic model for intracellular pDNA transport. It includes endosomal escape, complex formation between pDNA and nuclear import protein (NIP), binding to nuclear pore complex (NPC), nuclear entry, dissociation of pDNA from NIP, protein synthesis, and degradation of pDNA and protein.
Figure 2.
Figure 2.
Validation of qPCR method for intracellular pDNA copy number measurement. (A) Typical image of agarose gel showing pDNA and its degraded fragments. Gel electrophoresis was performed after pDNA solutions prepared with complete culture medium were treated with the DRP diluted by different factors (1:40, 1:160, 1:320, and 1:640). The pDNA solutions in untreated control groups were prepared with pure water or complete culture medium (Med). (B)-(E) Typical fluorescence images of pDNA (red) and cells (green) after the buffer containing Rho-pDNA and cells (stained with CellTracker™ Green CMFDA) was treated with one electric pulse (650 V and 400 μs) (Pulsed). To remove extracellular pDNA after electrotransfection, the cells were treated with the DRP (1:100 dilution). The non-treated groups served as controls. (F)-(I) Typical fluorescence images of Rho-pDNA and cells. The experimental condition was similar to that in Panels B-E, except that the pulsing buffer was supplemented with 0.2% type B gelatin, and that 3 pulses (650 V/cm, 400 μs, 2 s interval) were applied to the cells. (J)&(K) Images of Rho-pDNA and cells at a higher magnification. The samples were from the same groups as those shown in Panels G&I, respectively. These images show apoptotic cells (black arrows) and pDNA aggregates either alone or complexed with membrane debris (white arrowheads). Scale bars: 40 μm in B-I; 20 μm in J&K.
Figure 3.
Figure 3.
Dependence of average pDNA copy number on pDNA dose and pulsing conditions. The copy number increased with increasing (A) the dose, (B) the pulse number, and (C) the pulse strength. The curves are the results of linear fitting. Error bar: SD; n = 3. *P < 0.05, the highest vs the lowest data points. (D)&(E) Super-resolution image of a sample. The experimental condition was the same as that described in Panel E of Figure 2. The signals from both red (Rho-pDNA) and green (cytosol) channels are shown in (D), and the red signal alone is shown in (E). The numbers 1 through 9 indicate the cells used for quantitative image analysis. Scale bar: 10 μm.
Figure 4.
Figure 4.
Dependences of electrotransfection efficiency and average pDNA copy number on pDNA dose. (A) The copy number increased linearly with the pDNA dose. n = 4. (B)-(D) Effects of pDNA dose on the electrotransfection efficiency measured with three parameters: (B) eTE, (C) geometric mean of expression level, and (D) apparent expression level. n = 3. The curves are the results of linear fitting. Error bar: SD.
Figure 5.
Figure 5.
Numerical simulations of electrotransfection efficiency and its dependence on average pDNA copy number per cell. (A) Regression analysis of experimental data for determination of model constants (σ and D0). The symbols are experimental data of the eTE and the curve is the result of fitting the model to the data. (B) Model prediction of relative transgene expression level. The predicted values are compared with the experimental data described in Figure 4C after the pDNA dose was converted to the pDNA copy number using the data shown in Figure 4A.
Figure 6.
Figure 6.
Numerical simulations of time-dependent pDNA copy numbers in the nucleus. (A) Baseline profiles of the simulated copy number at different initial conditions (Dc). The values of Dc for different curves (from bottom to top) are D0/3, D0/2, D0, 2D0, 3D0, 4D0, and 5D0, respectively; and D0 = 172. The peak level of the profile increases monotonically with increasing the value of Dc. (B) Profiles of the copy number when the rate constant for pDNA degradation is reduced from the baseline by 50%.

Similar articles

Cited by

References

    1. Cervia LD, Chang CC, Wang L, Yuan F, Distinct effects of endosomal escape and inhibition of endosomal trafficking on gene delivery via electrotransfection, PLoS One, 12 (2017) e0171699, 10.1371/journal.pone.0171699. - DOI - PMC - PubMed
    1. Chang CC, Wu M, Yuan F, Role of specific endocytic pathways in electrotransfection of cells, Mol Ther Methods Clin Dev, 1 (2014) 14058, 10.1038/mtm.2014.58. - DOI - PMC - PubMed
    1. Mao M, Wang L, Chang CC, Rothenberg KE, Huang J, Wang Y, Hoffman BD, Liton PB, Yuan F, Involvement of a Rac1-Dependent Macropinocytosis Pathway in Plasmid DNA Delivery by Electrotransfection, Mol Ther, 25 (2017) 803–815, 10.1016/j.ymthe.2016.12.009. - DOI - PMC - PubMed
    1. Wu M, Yuan F, Membrane binding of plasmid DNA and endocytic pathways are involved in electrotransfection of mammalian cells, PLoS One, 6 (2011) e20923, 10.1371/journal.pone.0020923. - DOI - PMC - PubMed
    1. Neumann E, Schaefer-Ridder M, Wang Y, Hofschneider PH, Gene transfer into mouse lyoma cells by electroporation in high electric fields, EMBO J, 1 (1982) 841–845. - PMC - PubMed

LinkOut - more resources