. 2021 Jan 10;13(2):226.
doi: 10.3390/cancers13020226.

Alterations of NK Cell Phenotype in the Disease Course of Multiple Myeloma

Affiliations

Alterations of NK Cell Phenotype in the Disease Course of Multiple Myeloma

Tatiana Pazina et al. Cancers (Basel). .

Abstract

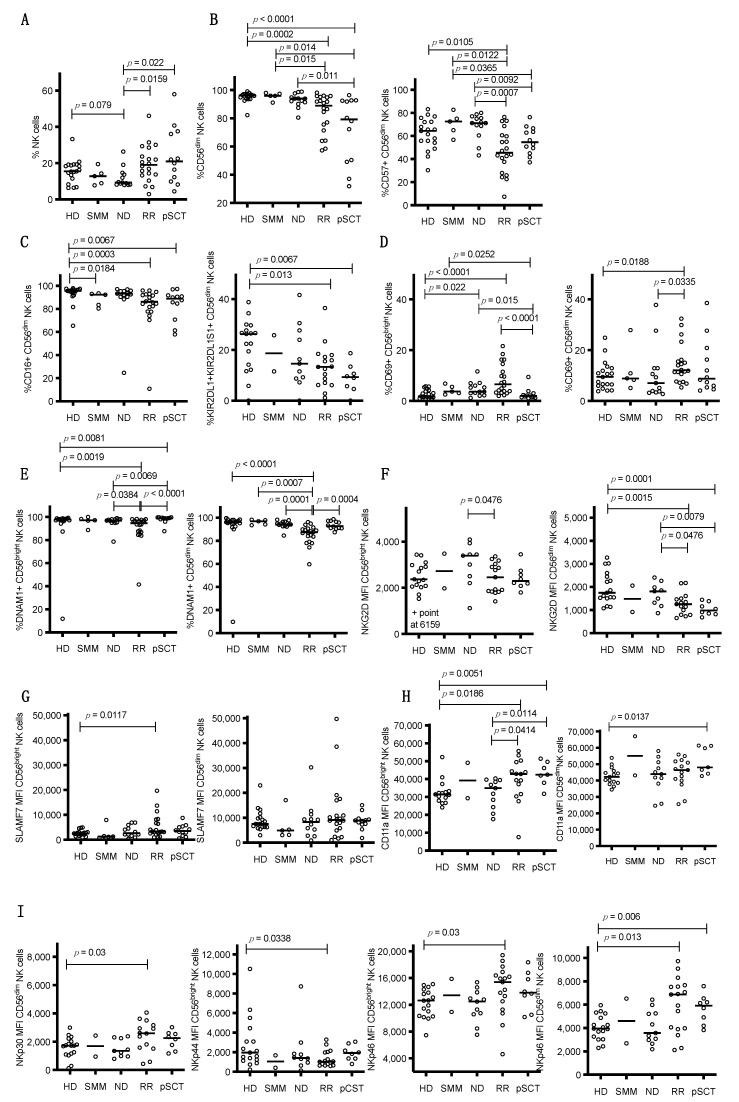
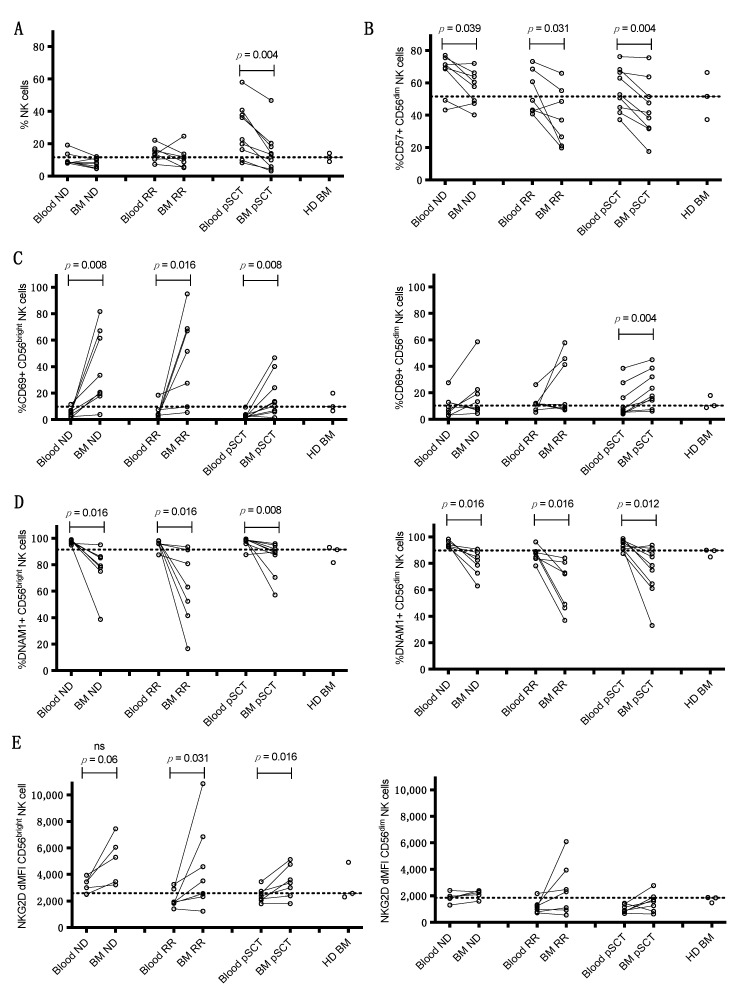
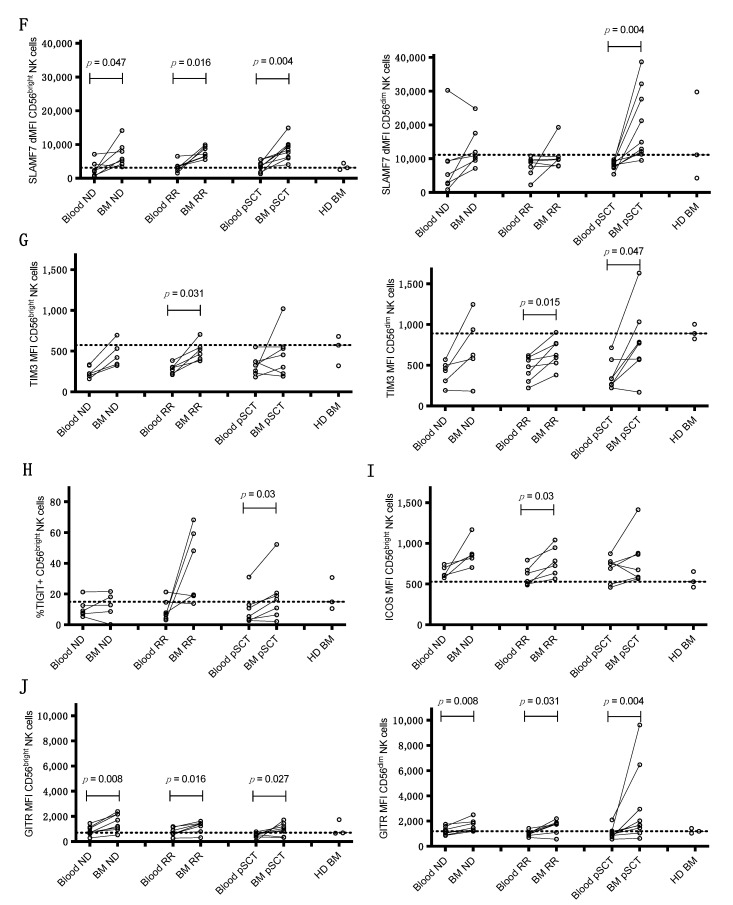
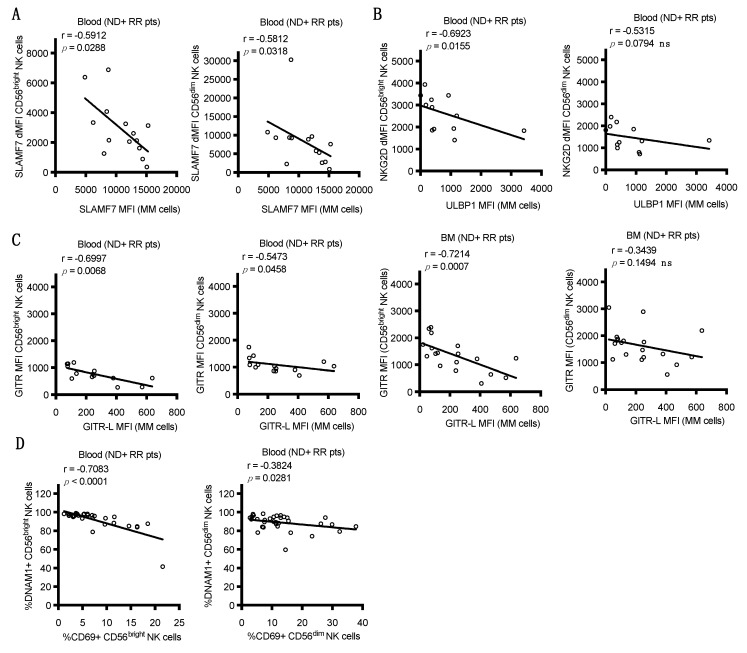
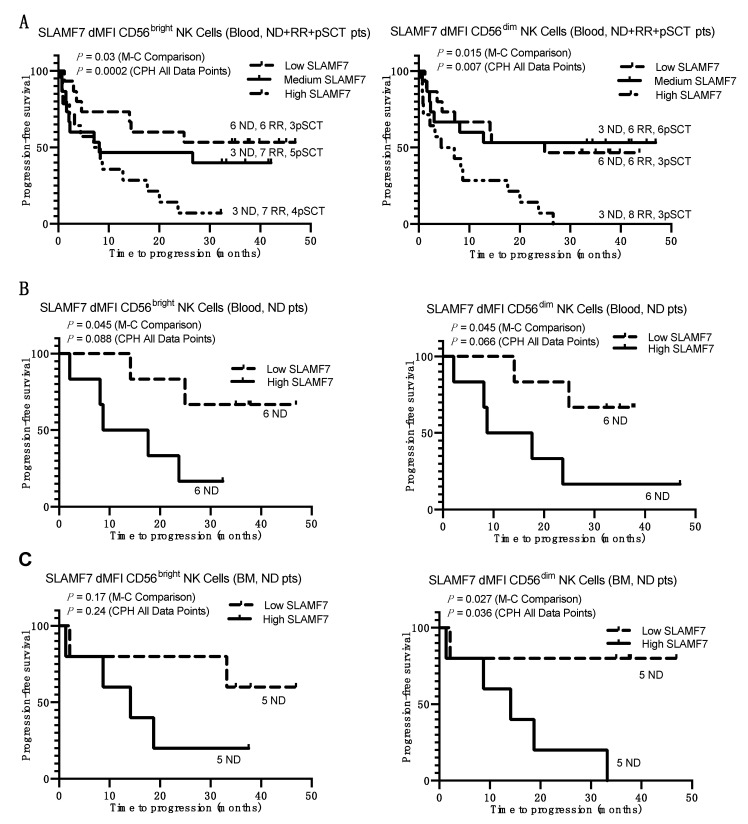
Accumulating evidence demonstrates important roles for natural killer (NK) cells in controlling multiple myeloma (MM). A prospective flow cytometry-based analysis of NK cells in the blood and bone marrow (BM) of MM patient subgroups was performed (smoldering (SMM), newly diagnosed (ND), relapsed/refractory, (RR) and post-stem cell transplantation (pSCT)). Assessments included the biomarker expression and function of NK cells, correlations between the expression of receptors on NK cells with their ligands on myeloma cells, and comparisons between MM patient subgroups and healthy controls. The most striking differences from healthy controls were found in RR and pSCT patients, in which NK cells were less mature and expressed reduced levels of the activating receptors DNAM-1, NKG2D, and CD16. These differences were more pronounced in the BM than in blood, including upregulation of the therapeutic targets TIM3, TIGIT, ICOS, and GITR. Their expression suggests NK cells became exhausted upon chronic encounters with the tumor. A high expression of SLAMF7 on blood NK cells correlated with shorter progression-free survival. This correlation was particularly evident in ND patients, including on mature CD56dim NK cells in the BM. Thus, our NK cell analysis identified possible therapeutic targets in MM and a biomarker with prognostic potential for disease progression.

Keywords: DNAM-1; GITR; NCR; NK cells; NKG2D; SLAMF7; blood; bone marrow; multiple myeloma.


Conflict of interest statement

This work was supported by grants from Bristol-Myers Squibb (BMS), which markets elotuzumab. The funders assisted in the original design of the study and provided editorial suggestions in the final stage of writing the manuscript, but had no role in the collection, analysis, or interpretation of the data or in the decision to publish the results. N.A.B. and M.D.R. were employees of BMS. K.S.C. and A.D.C. have received research funding from and have served on scientific advisory boards for BMS. K.S.C. has also received research funding from Janssen, Genentech, Horizon Pharma, NantKwest, and Immune Oncology Biosciences. T.P. is currently an employee of Janssen.

Figures

Figure 1
Figure 1
Percentages of various natural killer (NK) cell subsets and their expression of various NK cell markers in the blood of HDs and different MM patient subgroups. Each open circle designates a value for a distinct patient: HD = healthy donor, SMM = smoldering MM, ND = newly diagnosed, RR = relapsed/refractory, and pSCT = post-stem cell transplant, with horizontal lines marking medians. (A) The % of CD45+CD3CD56+ NK cells in the viable lymphocyte gate. (B) % of total CD45+CD3CD56+ NK cells that are CD56dim (left) and % CD56dim NK cells that are CD57+ (right), (C) % CD56dim NK cells that are CD16+ (left) and % CD56dim NK cells that are KIR2DS1+ and/or KIR2DL1+ (right), (D) % CD56bright (left) and CD56dim NK cells that are CD69+ (right), (E) % CD56bright (left) and CD56dim NK cells that are DNAM-1+ (right), (F) NKG2D expression level (NKG2D delta (d)MFI) on CD56bright (left) and CD56dim NK cells (right), (G) SLAMF7 expression level (SLAMF7 dMFI) on CD56bright (left) and CD56dim NK cells (right), (H) CD11a expression level (CD11a MFI) on CD56bright (left) and CD56dim NK cells (right), (I) natural cytotoxicity receptor (NCR) expression: NKp30 expression level (NKp30 dMFI) on CD56dim NK cells, NKp46 expression level (NKp46 dMFI) on CD56bright and CD56dim NK cells, and NKp44 expression level (NKp44 MFI) on CD56bright NK cells. Statistical comparisons between groups were calculated with an unpaired Wilcoxon rank-sum test.
Figure 2
Figure 2
Comparisons of expression levels of various surface markers on NK cells in the blood versus bone marrow (BM) of patients in different MM disease subgroups. Values in blood and BM from each patient are connected by solid black lines. (A) Comparisons of % of total viable lymphocytes that are CD45+CD3CD56+ NK cells in blood vs. BM. Comparison of various NK cell receptors and markers on blood vs. BM: (B) % CD56dim NK cells that are CD57+, (C) % CD56bright (left) and CD56dim NK cells that are CD69+ (right), (D) % CD56bright (left) and CD56dim NK cells that express DNAM-1 (right), (E) NKG2D expression level (NKG2D dMFI) on CD56bright (left) and CD56dim NK cells (right), (F) SLAMF7 expression level (SLAMF7 dMFI) on CD56bright (left) and CD56dim NK cells (right), (G) TIM3 expression level (TIM3 MFI) on CD56bright (left) and CD56dim NK cells (right), (H) % CD56bright NK cells that are TIGIT+, (I) ICOS expression level (ICOS MFI) on CD56bright NK cells, (J) GITR expression level (GITR MFI) on CD56bright (left) and CD56dim NK cells (right). Dashed lines in each panel designate the median expression of each receptor on NK cells from BM of the three HDs (right), demonstrating significant shifts in expression levels in the BM of many MM patients. p values comparing blood to BM were calculated using Wilcoxon paired signed-rank tests.
Figure 2
Figure 2
Comparisons of expression levels of various surface markers on NK cells in the blood versus bone marrow (BM) of patients in different MM disease subgroups. Values in blood and BM from each patient are connected by solid black lines. (A) Comparisons of % of total viable lymphocytes that are CD45+CD3CD56+ NK cells in blood vs. BM. Comparison of various NK cell receptors and markers on blood vs. BM: (B) % CD56dim NK cells that are CD57+, (C) % CD56bright (left) and CD56dim NK cells that are CD69+ (right), (D) % CD56bright (left) and CD56dim NK cells that express DNAM-1 (right), (E) NKG2D expression level (NKG2D dMFI) on CD56bright (left) and CD56dim NK cells (right), (F) SLAMF7 expression level (SLAMF7 dMFI) on CD56bright (left) and CD56dim NK cells (right), (G) TIM3 expression level (TIM3 MFI) on CD56bright (left) and CD56dim NK cells (right), (H) % CD56bright NK cells that are TIGIT+, (I) ICOS expression level (ICOS MFI) on CD56bright NK cells, (J) GITR expression level (GITR MFI) on CD56bright (left) and CD56dim NK cells (right). Dashed lines in each panel designate the median expression of each receptor on NK cells from BM of the three HDs (right), demonstrating significant shifts in expression levels in the BM of many MM patients. p values comparing blood to BM were calculated using Wilcoxon paired signed-rank tests.
Figure 3
Figure 3
Correlations of NK cell receptor expression with ligand expression on MM cells in BM from pooled ND and RR (ND+RR) patients. Each symbol is an individual patient. Statistics were calculated with Spearman’s rank correlation coefficient, lines are linear least squares fit for visual purposes only. Patients with corresponding blood and BM samples from ND+RR patients were examined for correlations between expression levels of the indicated receptors (y-axes) in blood or BM (as indicated) and expression of their corresponding ligands on myeloma cells in the BM (x-axes). (A) Correlations between dMFI of SLAMF7 expression on blood CD56bright (left) and CD56dim NK cells (right) and on myeloma (MM) cells in BM. (B) Comparisons of dMFI of NKG2D expression on blood CD56bright (left) and CD56dim NK cells (right) and the NKG2D ligand, ULBP1, on MM cells in BM. (C) Correlations between MFI expression levels of GITR on NK cell populations in blood (left panels) or in BM (right panels) with expression of GITR-L on MM cells in the BM. (D) Correlation between % CD56bright (left) or CD56dim (right) NK cells in blood that are DNAM-1+ and their % expressing the CD69 activation marker.
Figure 4
Figure 4
Kaplan–Meier survival plots showing time to progression as a function of SLAMF7 expression on NK cells in blood and BM. (A) Plots for the combined ND+ RR+ pSCT MM patients divided into tertiles based on their dMFI values for SLAMF7 expression on CD56bright (left) and CD56dim NK cells (right) in blood. Numbers of patients in each tertile that are ND, RR, or pSCT are indicated adjacent to each plotted line. (B,C) Plots for only ND MM patients divided into halves above and below the median of dMFI values for SLAMF7 expression on their CD56bright (left) and CD56dim NK cells (right) in peripheral blood (B) and BM (C). Line designations for high-, medium-, and low-expression tertiles and halves are indicated in the individual panels. p values are listed for a Cox proportional hazards (CPH) test performed on all data points and Mantel–Cox (M–C) statistical analysis of each patient group divided into tertiles or halves.

References

    1. Campbell K.S., Hasegawa J. Natural killer cell biology: An update and future directions. J. Allergy Clin. Immunol. 2013;132:536–544. doi: 10.1016/j.jaci.2013.07.006. - DOI - PMC - PubMed
    1. Cooper M.A., Fehniger T.A., Caligiuri M.A. The biology of human natural killer-cell subsets. Trends Immunol. 2001;22:633–640. doi: 10.1016/S1471-4906(01)02060-9. - DOI - PubMed
    1. Cooper M.A., Fehniger T.A., Turner S.C., Chen K.S., Ghaheri B.A., Ghayur T., Carson W.E., Caligiuri M.A. Human natural killer cells: A unique innate immunoregulatory role for the CD56bright subset. Blood. 2001;97:3146–3151. doi: 10.1182/blood.V97.10.3146. - DOI - PubMed
    1. Caligiuri M.A. Human natural killer cells. Blood. 2008;112:461–469. doi: 10.1182/blood-2007-09-077438. - DOI - PMC - PubMed
    1. Pazina T., Shemesh A., Brusilovsky M., Porgador A., Campbell K.S. Regulation of the functions of natural cytotoxicity receptors by interactions with diverse ligands and alterations in splice variant expression. Front. Immunol. 2017;8:369. doi: 10.3389/fimmu.2017.00369. - DOI - PMC - PubMed

LinkOut - more resources