. 2021 Jan 10;13(2):230.
doi: 10.3390/cancers13020230.

A Set of Cell Lines Derived from a Genetic Murine Glioblastoma Model Recapitulates Molecular and Morphological Characteristics of Human Tumors

Affiliations

A Set of Cell Lines Derived from a Genetic Murine Glioblastoma Model Recapitulates Molecular and Morphological Characteristics of Human Tumors

Barbara Costa et al. Cancers (Basel). .

Abstract

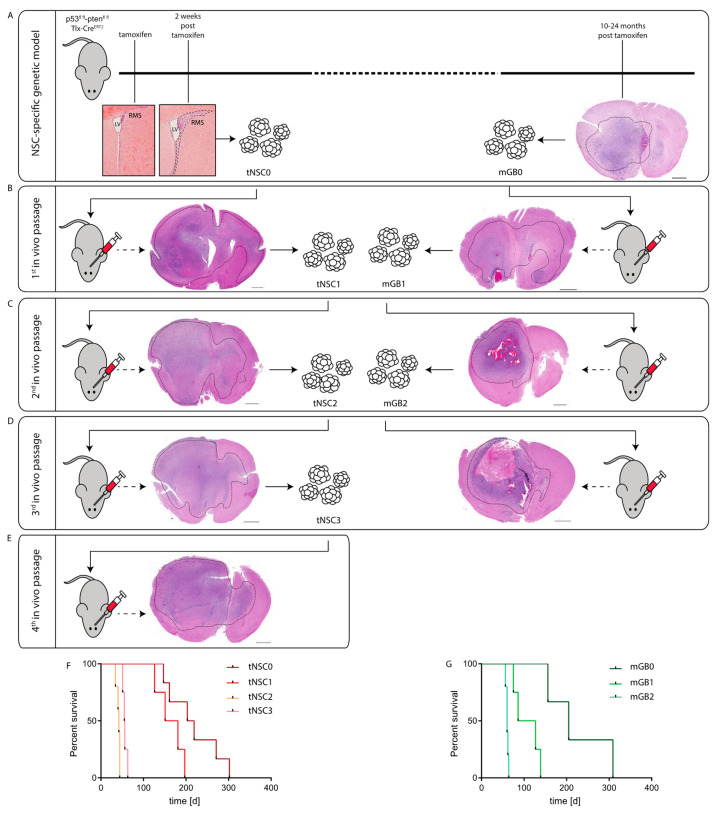
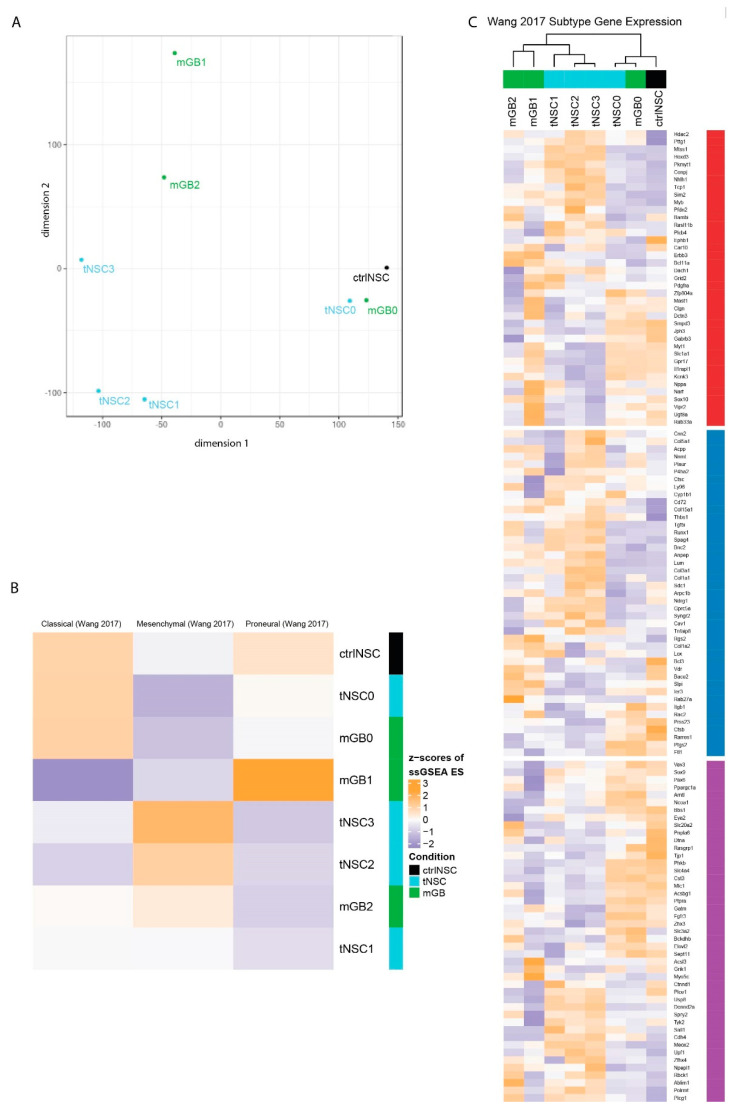
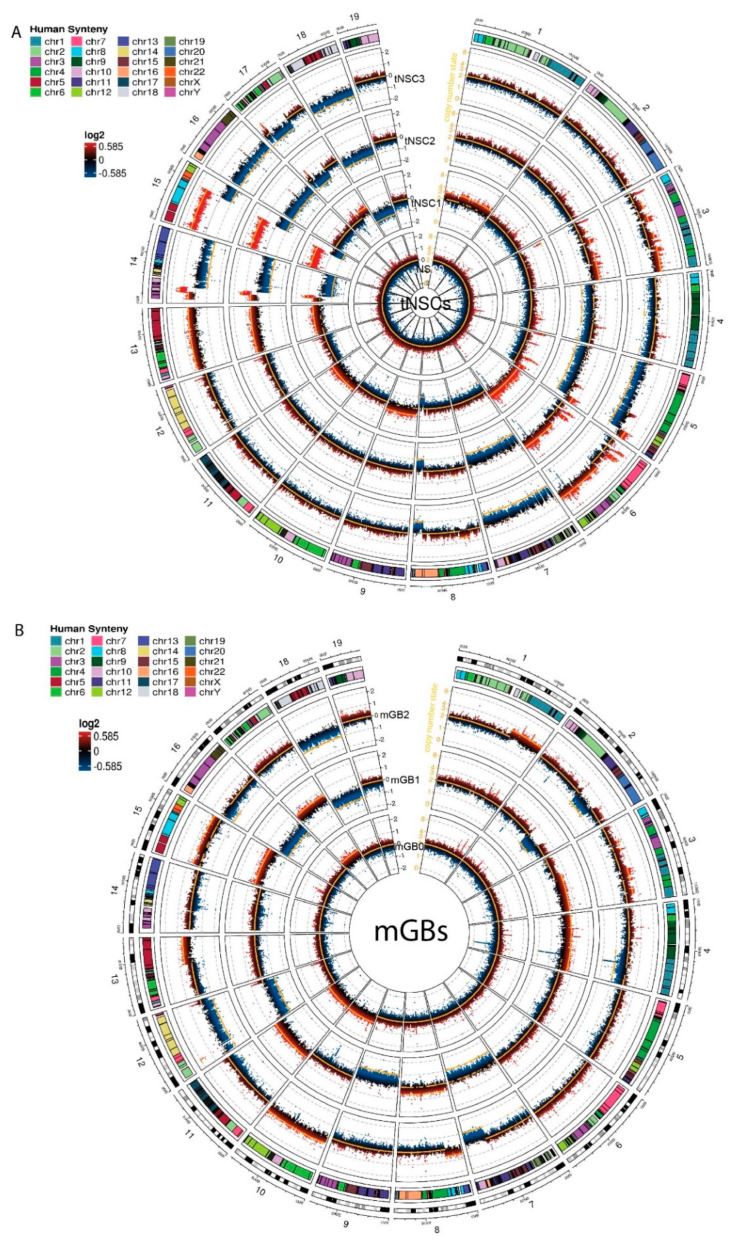
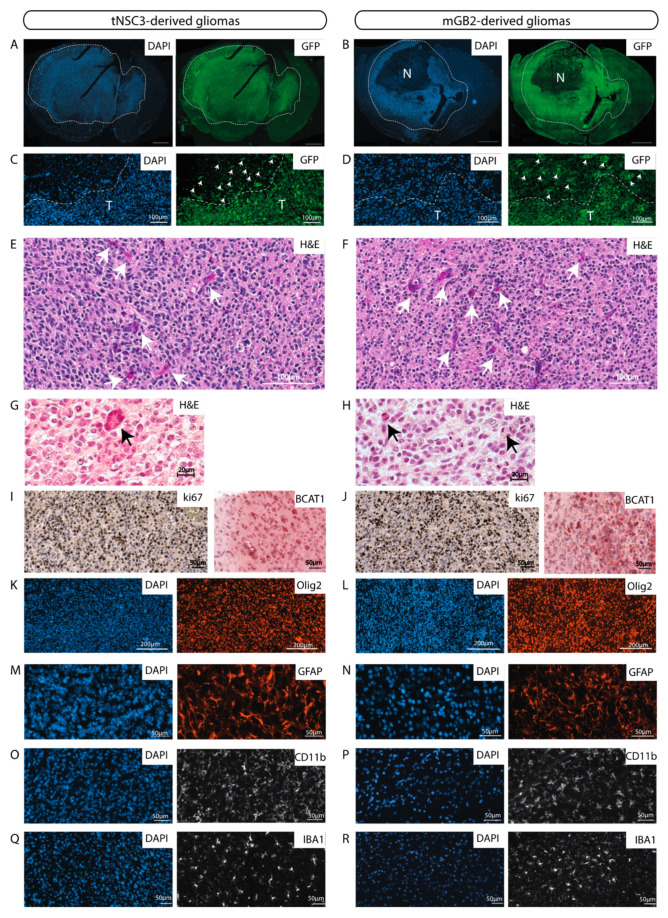
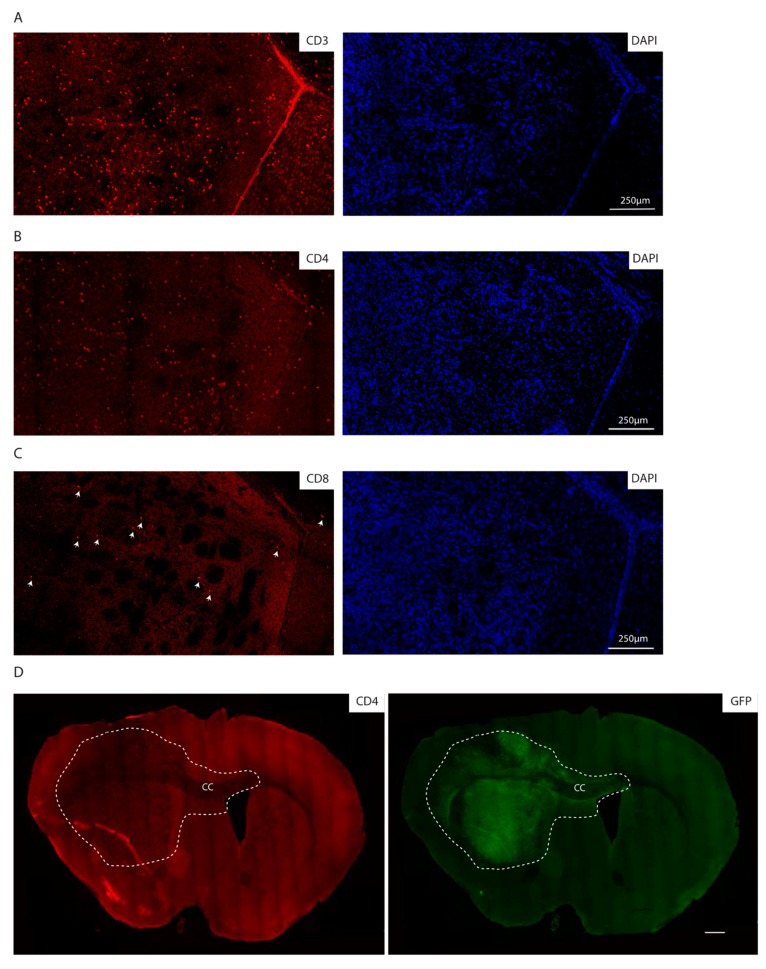
Glioblastomas (GBM) are the most aggressive tumors affecting the central nervous system in adults, causing death within, on average, 15 months after diagnosis. Immunocompetent in-vivo models that closely mirror human GBM are urgently needed for deciphering glioma biology and for the development of effective treatment options. The murine GBM cell lines currently available for engraftment in immunocompetent mice are not only exiguous but also inadequate in representing prominent characteristics of human GBM such as infiltrative behavior, necrotic areas, and pronounced tumor heterogeneity. Therefore, we generated a set of glioblastoma cell lines by repeated in vivo passaging of cells isolated from a neural stem cell-specific Pten/p53 double-knockout genetic mouse brain tumor model. Transcriptome and genome analyses of the cell lines revealed molecular heterogeneity comparable to that observed in human glioblastoma. Upon orthotopic transplantation into syngeneic hosts, they formed high-grade gliomas that faithfully recapitulated the histopathological features, invasiveness and immune cell infiltration characteristic of human glioblastoma. These features make our cell lines unique and useful tools to study multiple aspects of glioblastoma pathomechanism and to test novel treatments in an intact immune microenvironment.

Keywords: glioblastoma; mouse model; syngeneic cell line.


Conflict of interest statement

The authors declare no conflict of interest.

Figures

Figure 1
Figure 1
Generation of syngeneic glioma cell lines through in-vivo passaging of Pten/p53-deleted cells isolated from a genetic glioma model. (A) Schematic representation of the Pten/p53 genetic glioma model from which NSCs have been isolated either at early pre-malignant stage (left panel) or from a full-blown tumor (right panel). Scale bar = 1000 µm. Left panel: lateral ventricle (LV) with rostral migratory stream (RMS) at time of tamoxifen injection and at 2 weeks after tamoxifen-induced Pten/p53 recombination. Sections were stained with hematoxylin and eosin (H&E). Right panel: section of a full-blown tumor developed 18 months after tamoxifen-induced Pten/p53 deletion. Section was stained with hematoxylin and eosin (H&E). Scale bar = 1000 µm Dotted line shows tumor area. (B) First in vivo passage of tNSC0 (left panel) and mGB0 (right panel). Representative picture of a tNSC0-derived (left panel) and mGB0-derived (right panel) glioma. Sections were stained with hematoxylin and eosin (H&E). Scale bars = 1000 µm, (C) second in vivo passage of tNSC1 (left panel) and mGB1 (right panel). Representative picture of a tNSC1-derived (left panel) and mGB1-derived (right panel) glioma. Sections were stained with hematoxylin and eosin (H&E). Scale bars = 1000 µm. (D) Third in vivo passage of tNSC2 (left panel) and mGB2 (right panel). Representative picture of a tNSC2-derived (left panel) and mGB2-derived (right panel) glioma. Sections were stained with hematoxylin and eosin (H&E). Scale bar = 1000 µm, (E) fourth in vivo passage of tNSC3 (left panel). Representative picture of a tNSC3-derived (left panel). Sections were stained with hematoxylin and eosin (H&E). Scale bar = 1000 µm. (F) Kaplan–Meier survival curve of mice transplanted with tNSC0, tNSC1, tNSC2, and tNSC3 glioma cell lines. Time = days. tNSC0 (n = 7), tNSC1 (n = 6), tNSC2 (n = 6), tNSC3 (n = 7). (G) Kaplan–Meier survival curve of mice transplanted with mGB0, mGB1, and mGB2 glioma cell lines. Time = days. mGB0 (n = 6), mGB1 (n = 6), mGB2 (n = 6).
Figure 2
Figure 2
Transcriptomic characterization of the new glioma cell lines finds distinct expression profiles that correspond to known human glioblastoma subtypes. (A) Multidimensional scaling (MDS) analysis of whole transcriptomes from the newly generated glioma cell lines (tNSC0-3, mGB0-2) and of non-transformed NSCs (ctrlNSCs). (B) Heatmap showing z-scores of ssGSEA enrichment scores of the murine glioma cell lines for published glioblastoma subtype gene expression signatures. (C) Heatmap of z-scores of expression of glioblastoma subtype genes, as defined in Wang et al. Genes are labeled with their subtype. The gene expression of cell lines with sample replicates (tNSC4 and ctrlNSC: both n = 3) was averaged.
Figure 3
Figure 3
Copy number aberration analysis identifies specific chromosomal aberrations of the new murine glioma cell lines. (A,B) Circos plots showing copy number aberrations (CNA) of tNSCs (A) and mGBs (B) cell lines. CNVkit-calculated log2 ratios for each genomic bin are plotted as colored points (black y-axis scale; red corresponds to increased log2 ratios, and blue to decreased), with the inferred copy number state plotted as an orange line (orange y-axis scale). Each circular sector represents one chromosome. Human syntenic regions are shown at the top of each chromosome.
Figure 4
Figure 4
The murine GBM cell lines give rise to orthotopic tumors with characteristics of human glioblastomas. (A,B) GFP-Immunofluorescence staining (green) of tNSC3 (A) and mGB2 (B) orthotopic tumors. Cellular nuclei are stained with DAPI and pseudocolored in blue. Scale bars, 1000 µm. Dotted lines show tumor area. N indicates a necrotic area in the mGB2 orthotopic glioma. (C,D) Zoom-in of images from A and B, respectively, showing an area at the tumor border. T indicates tumor area delineated by dotted lines. Arrows denote GFP-positive glioma cells invading the surrounding normal brain parenchyma. (EH) Histopathological features of orthotopic tNSC3 (E,G) and mGB2 (F,H) gliomas. Sections were stained with hematoxylin and eosin (H&E). Arrows in E, F denote areas of microvascular proliferation; arrows in G, H indicate mitotic figures. (I,J) Ki67 expression (left) and BCAT1 (right) in orthotopic tNSC3 (I) and mGB2 (J) gliomas detected by immunohistochemistry. The sections were counterstained with hematoxylin. (KR) Immunofluorescence staining for Olig2 (K,L), Gfap (M,N), Cd11b (O,P), and Iba1 (Q,R) within tumor areas from orthotopic tNSC3 (K,M,O,Q) and mGB2 (L,N,P,R) gliomas. Cellular nuclei are stained with DAPI and pseudocolored in blue.
Figure 5
Figure 5
The syngeneic GBM show lymphocyte infiltration. (AC) Immunofluorescence staining of the core of an mGB2 orthotopic tumor for CD3 (A), CD4 (B), CD8 (C). Cellular nuclei are stained with DAPI and pseudocolored in blue. Arrows indicate CD8 positive cells. (D) Immunofluorescence staining of an mGB2 orthotopic tumor (entire brain section) for CD4 (in red) and GFP (in green). Scale bar, 500 µm. Dotted lines show tumor area. CC indicates corpus callosum.

References

    1. Weller M., van den Bent M., Tonn J.C., Stupp R., Preusser M., Cohen-Jonathan-Moyal E., Henriksson R., Le Rhun E., Balana C., Chinot O., et al. European Association for Neuro-Oncology (EANO) guideline on the diagnosis and treatment of adult astrocytic and oligodendroglial gliomas. Lancet Oncol. 2017;18:e315–e329. doi: 10.1016/S1470-2045(17)30194-8. - DOI - PubMed
    1. Louis D.N., Perry A., Reifenberger G., von Deimling A., Figarella-Branger D., Cavenee W.K., Ohgaki H., Wiestler O.D., Kleihues P., Ellison D.W. The 2016 World Health Organization Classification of Tumors of the Central Nervous System: A summary. Acta Neuropathol. 2016;131:803–820. doi: 10.1007/s00401-016-1545-1. - DOI - PubMed
    1. Brennan C.W., Verhaak R.G., McKenna A., Campos B., Noushmehr H., Salama S.R., Zheng S., Chakravarty D., Sanborn J.Z., Berman S.H., et al. The somatic genomic landscape of glioblastoma. Cell. 2013;155:462–477. doi: 10.1016/j.cell.2013.09.034. - DOI - PMC - PubMed
    1. Wang Q., Hu B., Hu X., Kim H., Squatrito M., Scarpace L., deCarvalho A.C., Lyu S., Li P., Li Y., et al. Tumor Evolution of Glioma-Intrinsic Gene Expression Subtypes Associates with Immunological Changes in the Microenvironment. Cancer Cell. 2017;32:42–56.e6. doi: 10.1016/j.ccell.2017.06.003. - DOI - PMC - PubMed
    1. Oh T., Fakurnejad S., Sayegh E.T., Clark A.J., Ivan M.E., Sun M.Z., Safaee M., Bloch O., James C.D., Parsa A.T. Immunocompetent murine models for the study of glioblastoma immunotherapy. J. Transl. Med. 2014;12:107. doi: 10.1186/1479-5876-12-107. - DOI - PMC - PubMed