. 2021 Jan 8;22(2):592.
doi: 10.3390/ijms22020592.

Precursor B-ALL Cell Lines Differentially Respond to SYK Inhibition by Entospletinib

Affiliations

Precursor B-ALL Cell Lines Differentially Respond to SYK Inhibition by Entospletinib

Sina Sender et al. Int J Mol Sci. .

Abstract

Background: Impaired B-cell receptor (BCR) function has been associated with the progress of several B-cell malignancies. The spleen tyrosine kinase (SYK) represents a potential therapeutic target in a subset of B-cell neoplasias. In precursor B-acute lymphoblastic leukemia (B-ALL), the pathogenic role and therapeutic potential of SYK is still controversially discussed. We evaluate the application of the SYK inhibitor entospletinib (Ento) in pre- and pro-B-ALL cell lines, characterizing the biologic and molecular effects.

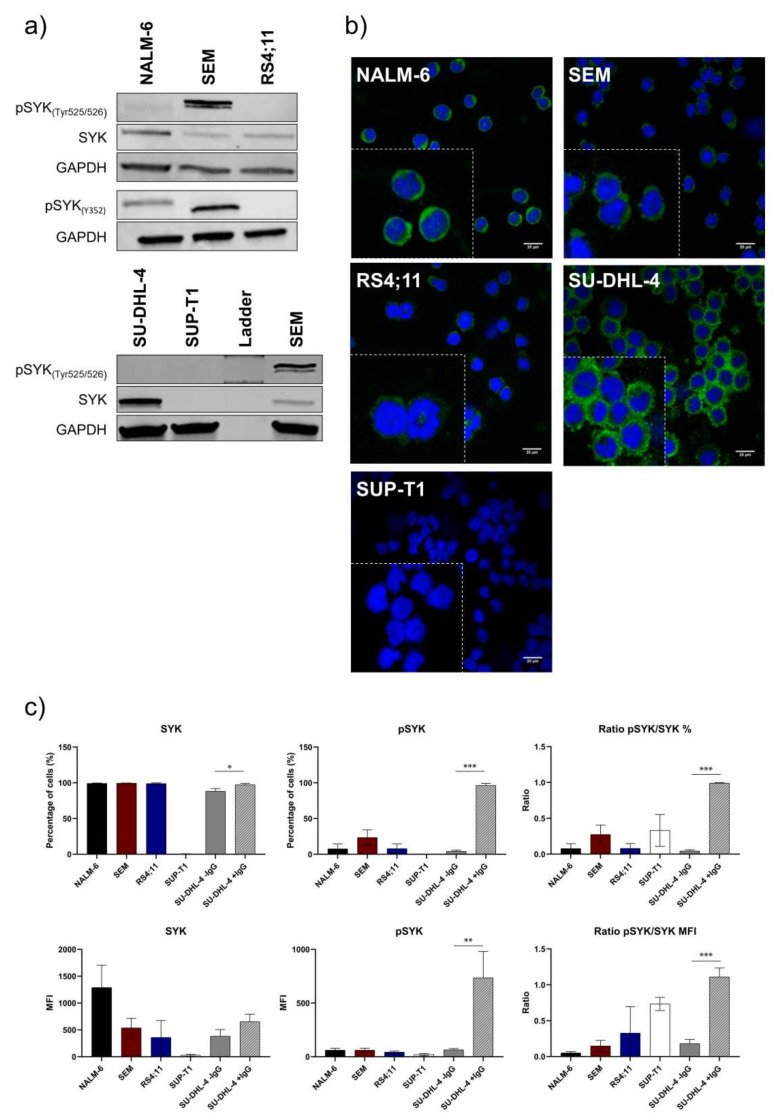
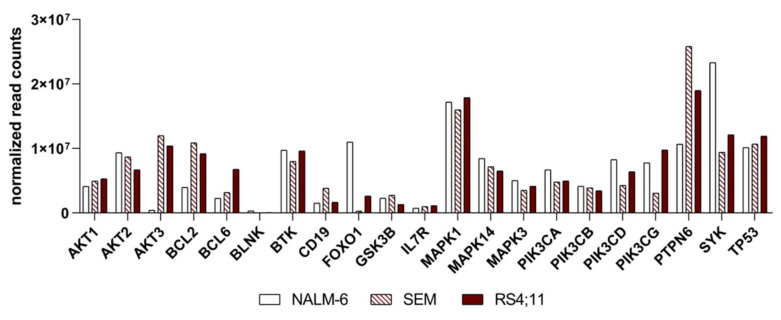
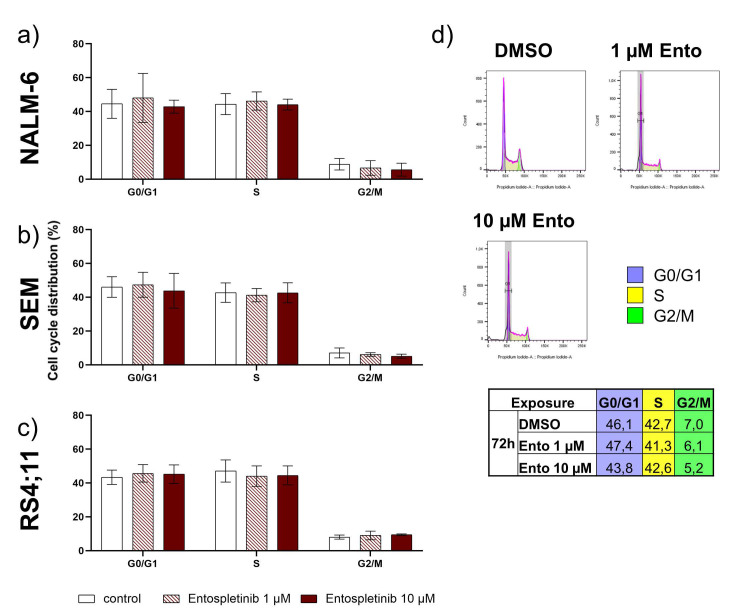
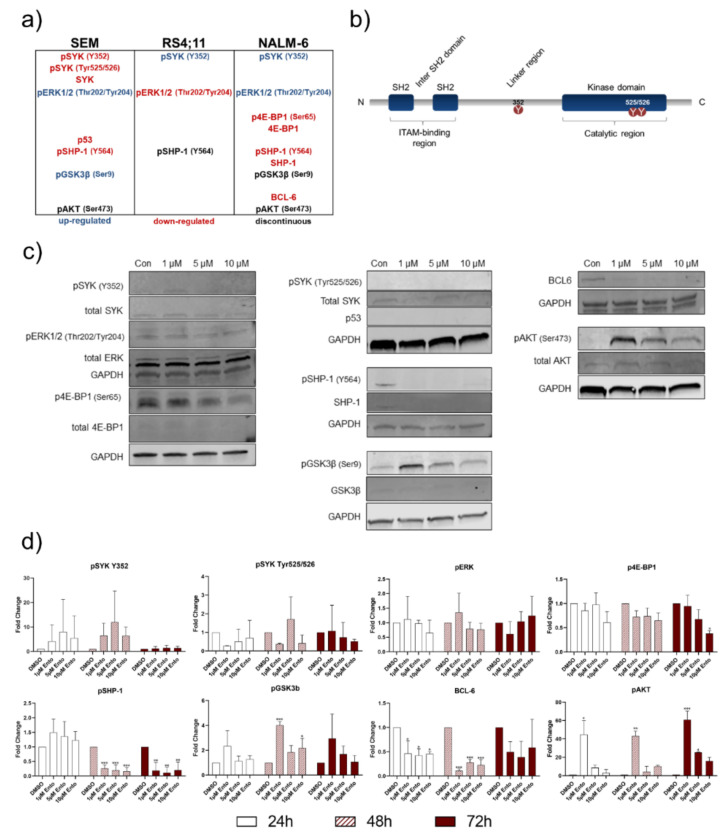
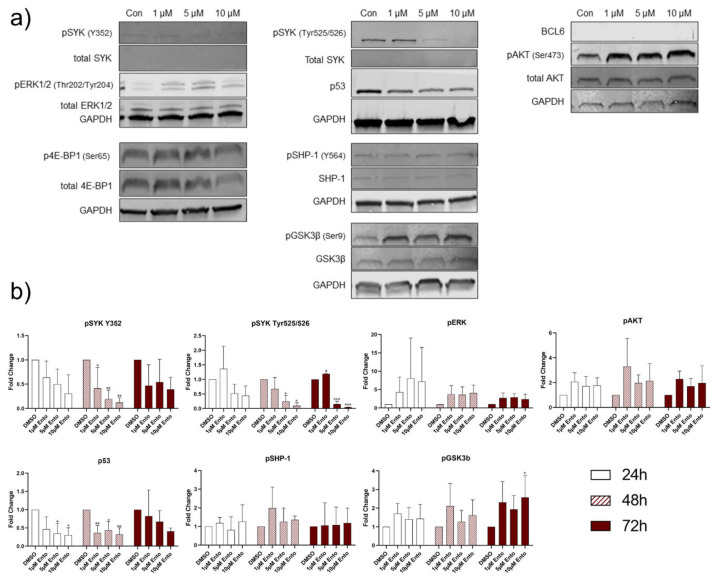
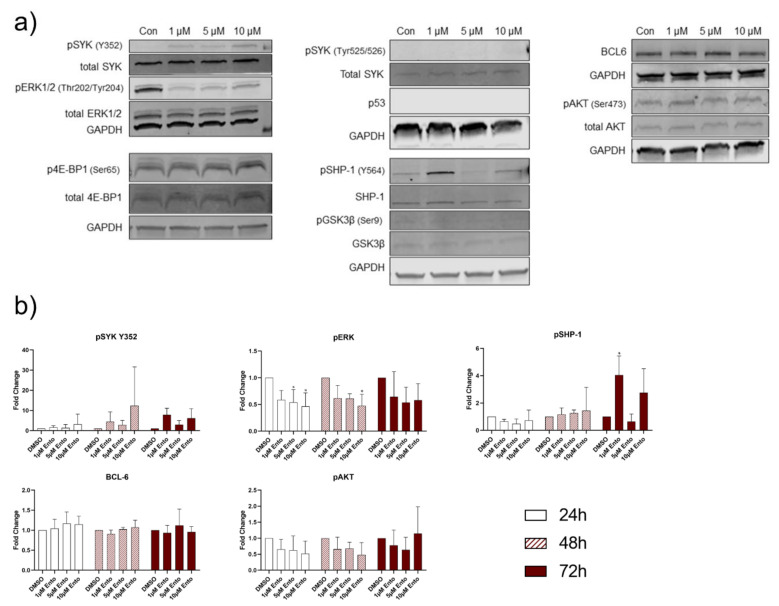
Methods: SYK expression was characterized in pre-B-ALL (NALM-6) and pro-B-ALL cell lines (SEM and RS4;11). The cell lines were exposed to different Ento concentrations and the cell biological response analyzed by proliferation, metabolic activity, apoptosis induction, cell-cycle distribution and morphology. BCR pathway gene expression and protein modulations were further characterized.

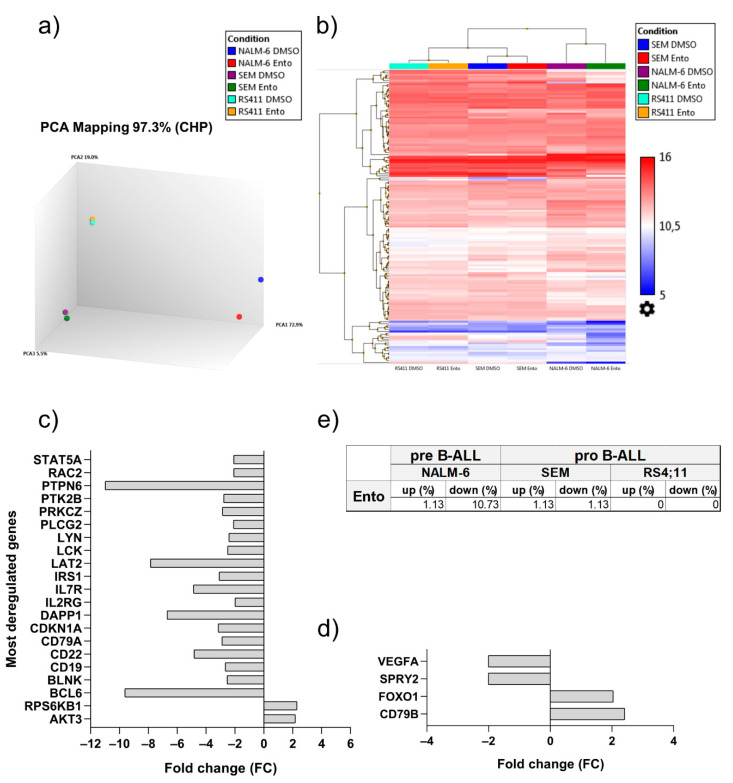
Results: Ento significantly induced anti-proliferative and pro-apoptotic effects in NALM-6 and SEM, while barely affecting RS4;11. Targeted RNAseq revealed pronounced gene expression modulation only in NALM-6, while Western Blot analyses demonstrated that vital downstream effector proteins, such as pAKT, pERK, pGSK3β, p53 and BCL-6, were affected by Ento exposure in the inhibitor-sensitive cell lines.

Conclusion: Different acting modes of Ento, independent of pre-BCR dependency, were characterized, unexpected in SEM. Accordingly, SYK classifies as a potential target structure in a subset of pro-B-ALLs.

Keywords: B-ALL; BCR; Ento; GS-9973; SYK; acute lymphoblastic leukemia; entospletinib; expression analysis; pathway-specific inhibitors.


Conflict of interest statement

The authors declare no conflict of interest.

Figures

Figure 1
Figure 1
Basal characterization of SYK and pSYK expression in B-ALL cell lines. Characterization of basal SYK protein expression in B-ALL cell lines. Highest SYK expression was observed in pre-B-ALL NALM-6, while pro-B-ALL SEM showed the highest pSYK expression. (a) SYK and pSYK expression of two phosphorylation sites (Tyr525/526 and Y352) under non-stimulating conditions in the B-ALL cell lines and the DLBCL cell line SU-DHL-4 as well as the T-cell lymphoma cell line SUP-T1 (positive and negative control, respectively). (b) Immunofluorescent staining of SYK in the B-ALL cell lines and control cell lines (composite image of the Alexa Fluor Plus 488 green-labeled SYK and blue DAPI-stained nucleus) by confocal microscopy. (c) Intracellular staining of SYK-FITC and pSYK(Y348)-PE by flow cytometry in unstimulated B-ALL cells showing SYK and pSYK expression based on percentage (%) and mean fluorescent intensity (MFI) (SUP-T1 cell line as the negative control and IgG-stimulated SU-DHL-4 as the positive control). The mean fluorescence intensity (MFI) of all cell lines is expressed in arbitrary units (AU). Data are presented as the mean ± SD. Statistical significance was calculated by t-test and displayed as * p < 0.033, ** p < 0.002, *** p < 0.001 (n ≥ 3).
Figure 2
Figure 2
Basal expression of the B-cell receptor and PI3K/AKT pathway genes. Representation of the BCR and PI3K/AKT pathway key regulators in all B-ALL cell lines. Basal expression of selected essential BCR and PI3K/AKT pathway genes; targeted sequencing normalized read counts.
Figure 3
Figure 3
Cell viability after entospletinib exposure in B-ALL cell lines. Time- and concentration-dependent reduction in cell proliferation and metabolic activity in the pre-B-ALL cell line NALM-6 and pro-B-ALL cell lines SEM and RS4;11 by entospletinib. Cell proliferation and metabolic activity for entospletinib serially diluted at different concentrations (0.001 µM–20 µM) for 24 h, 48 h and 72 h (a) NALM-6, (b) SEM and (c) RS4;11. Data are presented as the mean ± SD. Statistical significance was calculated by one-way ANOVA followed by Dunnett’s multiple comparison test as a post-hoc analysis and displayed as * p < 0.033, ** p < 0.002, *** p < 0.001 versus the control group (n ≥ 3).
Figure 4
Figure 4
Apoptosis induction in B-ALL after entospletinib (Ento) exposure. Concentration-dependent apoptosis induction by entospletinib in pre-B-ALL NALM-6 and pro-B-ALL SEM. B-ALL cells were exposed to serially diluted entospletinib concentrations (0,001 µM–20 µM). Apoptosis induction was determined by Annexin V/PI staining for an exposure time of 24 h, 48 h and 72 h. (a) NALM-6 cells, (b) SEM and (c) RS4;11, respectively. (d) Representative light microscopy images (×100) of entospletinib-exposed B-ALL cells after 72 h. Cytospins were stained with May-Gruenwald Giemsa stain (Pappenheim method) after 24 h, 48 h and 72 h entospletinib exposure at different concentrations (1 µM, 5 µM and 10 µM). Data are presented as the mean ± SD. Statistical significance was calculated by one-way ANOVA followed by Dunnett’s test as a post-hoc analysis and displayed as * p < 0.033, ** p < 0.002, *** p < 0.001 versus the control group (n ≥ 3). Black asterisks indicate significance of late apoptotic/necrotic cells and red asterisks indicate significance of early apoptotic cells.
Figure 5
Figure 5
Flow cytometric cell-cycle analysis of the B-ALL cells after entospletinib exposure. B-ALL cell lines NALM-6, SEM and RS4;11 were exposed to 1 µM or 10 µM entospletinib for 72 h. (a) Mean cell-cycle distribution of NALM-6, (b) SEM and (c) RS4,11. (d) Representative histograms of the cell-cycle distribution of the SEM cells exposed to entospletinib or the vehicle, calculated by FlowJo Software, and the mean calculation of the cell-cycle phases. Data are presented as the mean ± SD. Statistical significance was calculated by one-way ANOVA followed by Dunnett’s test as a post-hoc (n ≥ 3).
Figure 6
Figure 6
Entospletinib-induced gene expression changes in the B-ALL cell lines. Entospletinib-induced gene expression changes within the BCR and PI3K/AKT pathway predominantly in pre-B-ALL NALM-6 and slightly in pro-B-ALL SEM. (a) Principle component analysis of the control and 1 µM Ento-exposed B-ALL cell lines revealed distinct clustering of the appropriate cell line samples and variance in the NALM-6 cells after Ento exposure. (b) Hierarchical clustering of all the relevant regulated genes demonstrates the gene expression changes in the B-ALL cell lines. (c) Fold changes of the significantly deregulated genes in NALM-6 and (d) SEM. (e) Percentagewise deregulation after 1 µM Ento exposure.
Figure 7
Figure 7
Entospletinib-induced distinct downstream protein modifications in pre-B-ALL NALM-6. Western Blot analyses revealed distinct changes in the SYK downstream proteins in pre-B-ALL NALM-6. (a) Condensed conclusion of protein modifications in all tested B-ALL cell lines. (b) Schematic illustration of the SYK protein structure, showing the amino acids used to examine the phosphorylation status. (c) Representative Western blot images of NALM-6 cells after 72 h entospletinib exposure. (d) Western blot quantification of key proteins after 24 h, 48 h and 72 h exposure (≥3 independent Western blots). Data are presented as the mean ± SD. Statistical significance was calculated by one-way ANOVA followed by Dunnett’s test as a post-hoc analysis and displayed as * p < 0.033, ** p < 0.002, *** p < 0.001 versus the control group (n ≥ 3).
Figure 8
Figure 8
Entospletinib-induced distinct downstream protein modifications in pro-B-ALL SEM. (a) Representative Western blot images of SEM cells after 72 h exposure. (b) Western blot quantification of key proteins (≥3 independent Western blots for 24 h, 48 h and 72 h time points). Data are presented as the mean ± SD. Statistical significance was calculated by one-way ANOVA followed by Dunnett’s test as a post-hoc analysis and displayed as * p < 0.033, ** p < 0.002, *** p < 0.001 versus the control group (n ≥ 3).
Figure 9
Figure 9
Entospletinib induced moderate downstream protein modifications in pro-B-ALL RS4;11. Entospletinib induces moderate protein expression changes in pro-B-ALL RS4;11. (a) Representative Western Blot images of RS4;11 cells after Ento exposure (b) Western Blot quantification of key proteins (≥ 3 independent Western Blots for 24 h, 48 h and 72 h time points). Data are presented as the mean ± SD. Statistical significance was calculated by One-way ANOVA followed by Dunnett’s test as post hoc (n ≥ 3).

Similar articles

Cited by

References

    1. Kenkre V.P., Kahl B.S. The Future of B-Cell Lymphoma Therapy: The B-Cell Receptor and its Downstream Pathways. Curr. Hematol. Malig. Rep. 2012;7:216–220. doi: 10.1007/s11899-012-0127-0. - DOI - PubMed
    1. Mócsai A., Ruland J., Tybulewicz V.L.J. The SYK tyrosine kinase: A crucial player in diverse biological functions. Nat. Rev. Immunol. 2010;10:387–402. doi: 10.1038/nri2765. - DOI - PMC - PubMed
    1. Turner M., Mee P.J., Costello P.S., Williams O., Price A.A., Duddy L.P., Furlong M.T., Geahlen R.L., Tybulewicz V.L. Perinatal lethality and blocked B-cell development in mice lacking the tyrosine kinase Syk. Nature. 1995;378:298–302. doi: 10.1038/378298a0. - DOI - PubMed
    1. Köhrer S., Havranek O., Seyfried F., Hurtz C., Coffey G.P., Kim E., Hacken E.T., Jäger U., Vanura K., O’Brien S., et al. Pre-BCR signaling in precursor B-cell acute lymphoblastic leukemia regulates PI3K/AKT, FOXO1 and MYC, and can be targeted by SYK inhibition. Leukemia. 2016;30:1246–1254. doi: 10.1038/leu.2016.9. - DOI - PMC - PubMed
    1. Cornall R.J., Cheng A.M., Pawson T., Goodnow C.C. Role of Syk in B-cell development and antigen-receptor signaling. Proc. Natl. Acad. Sci. USA. 2000;97:1713–1718. doi: 10.1073/pnas.97.4.1713. - DOI - PMC - PubMed

MeSH terms

LinkOut - more resources