Analysis of the Choroid and Its Relationship with the Outer Retina in Patients with Diabetes Mellitus Using Binarization Techniques Based on Spectral-Domain Optical Coherence Tomography
- PMID: 33435599
- PMCID: PMC7826830
- DOI: 10.3390/jcm10020210
Analysis of the Choroid and Its Relationship with the Outer Retina in Patients with Diabetes Mellitus Using Binarization Techniques Based on Spectral-Domain Optical Coherence Tomography
Abstract
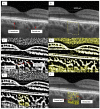
(1) Background: We aimed to reveal the relationship between the choroid and the outer retina with optical coherence tomography (OCT) in patients with diabetes mellitus (DM) with mild or no diabetic retinopathy (DR) in order to find early biomarkers for progressing retinopathy. (2) Methods: We performed a prospective study including 61 eyes of patients with type 1 or type 2 DM and 36 eyes of healthy controls. All subjects were imaged with Spectralis OCT. The choroid was assesseed using enhanced depth imaging OCT (EDI-OCT). Binarization of subfoveal choroidal images was done with public domain software, ImageJ (version 1.53a; National Institutes of Health, Bethesda, Maryland, USA). (3) Results: Luminal area, stromal area and total choroidal area were significantly decreased in diabetic patients compared to control: 0.23 ± 0.07 vs. 0.28 ± 0.08, p = 0.012; 0.08 ± 0.03 vs. 0.10 ± 0.04, p = 0.026; 0.31 ± 0.09 vs. 0.38 ± 0.11, p = 0.008. The thickness of retinal pigment epithelium (RPE) correlated positively with the choroidal vascularity index (CVI). The correlations between outer nuclear layer (ONL), photoreceptors (PR) and foveal choroidal thickness (FChT) were moderately negative. (4) Conclusion: Thicker RPE and a thinner PR layer may be assigned the role of early biomarkers signaling the conversion time to progressing retinopathy.
Keywords: OCT; binarization; choroid parameters; choroidal thickness; choroidal vascularity index; diabetic retinopathy; outer retina.
Conflict of interest statement
The authors declare no conflict of interest.
Figures


Similar articles
-
Choroidal vascularity index - a novel optical coherence tomography parameter for disease monitoring in diabetes mellitus?Acta Ophthalmol. 2016 Nov;94(7):e612-e616. doi: 10.1111/aos.13044. Epub 2016 May 6. Acta Ophthalmol. 2016. PMID: 27151819
-
Choroidal Morphologic and Vascular Features in Patients With Myopic Choroidal Neovascularization and Different Levels of Myopia Based on Image Binarization of Optical Coherence Tomography.Front Med (Lausanne). 2022 Jan 4;8:791012. doi: 10.3389/fmed.2021.791012. eCollection 2021. Front Med (Lausanne). 2022. PMID: 35059417 Free PMC article.
-
Choroidal Assessment in Patients with Type 2 Diabetes Mellitus and Non-Proliferative Diabetic Retinopathy by Swept-Source Ocular Coherence Tomography and Image Binarization.Medicina (Kaunas). 2022 Jul 10;58(7):918. doi: 10.3390/medicina58070918. Medicina (Kaunas). 2022. PMID: 35888637 Free PMC article.
-
Choroidal Changes in Diabetic Patients With Different Stages of Diabetic Retinopathy.Cureus. 2020 Oct 9;12(10):e10871. doi: 10.7759/cureus.10871. Cureus. 2020. PMID: 33178524 Free PMC article. Review.
-
[Choroidal changes in patients with diabetes mellitus].Vestn Oftalmol. 2023;139(6):158-165. doi: 10.17116/oftalma2023139061158. Vestn Oftalmol. 2023. PMID: 38235643 Russian.
Cited by
-
Effectiveness of Low-Level Red Light in Controlling Myopia Progression in Children: A Systematic Review and Meta-Analysis.Cureus. 2025 Mar 10;17(3):e80336. doi: 10.7759/cureus.80336. eCollection 2025 Mar. Cureus. 2025. PMID: 40206924 Free PMC article. Review.
-
Retinal and Choroidal Vascularization Parameters in Patients with Type 2 Diabetes Without Diabetic Retinopathy.Clin Ophthalmol. 2024 Oct 25;18:3019-3029. doi: 10.2147/OPTH.S480207. eCollection 2024. Clin Ophthalmol. 2024. PMID: 39473830 Free PMC article.
-
Choroidal vascularity index in health and systemic diseases: a systematic review.Int J Retina Vitreous. 2024 Nov 18;10(1):87. doi: 10.1186/s40942-024-00607-8. Int J Retina Vitreous. 2024. PMID: 39558436 Free PMC article. Review.
-
Acute hyperglycemia compromises the responses of choroidal vessels using swept-source optical coherence tomography during dark and light adaptations.Front Endocrinol (Lausanne). 2023 Feb 9;14:1049326. doi: 10.3389/fendo.2023.1049326. eCollection 2023. Front Endocrinol (Lausanne). 2023. PMID: 36843596 Free PMC article.
-
Correlation between Choroidal Vascularity Index and Outer Retina in Patients with Diabetic Retinopathy.J Clin Med. 2022 Jul 4;11(13):3882. doi: 10.3390/jcm11133882. J Clin Med. 2022. PMID: 35807164 Free PMC article.
References
-
- Fryczkowski A.W., Sato E.S., Hodes B.L. Changes in the Diabetic Choroidal Vasculature: Scanning Electron Microscopy Findings. Ann. Ophthalmol. 1988;20:299–305. - PubMed
LinkOut - more resources
Full Text Sources
Other Literature Sources
Research Materials

