

A network-based model to explore the role of testing in the epidemiological control of the COVID-19 pandemic
- PMID: 33435892
- PMCID: PMC7803001
- DOI: 10.1186/s12879-020-05750-9
A network-based model to explore the role of testing in the epidemiological control of the COVID-19 pandemic
Abstract
Background: Testing is one of the most effective means to manage the COVID-19 pandemic. However, there is an upper bound on daily testing volume because of limited healthcare staff and working hours, as well as different testing methods, such as random testing and contact-tracking testing. In this study, a network-based epidemic transmission model combined with a testing mechanism was proposed to study the role of testing in epidemic control. The aim of this study was to determine how testing affects the spread of epidemics and the daily testing volume needed to control infectious diseases.
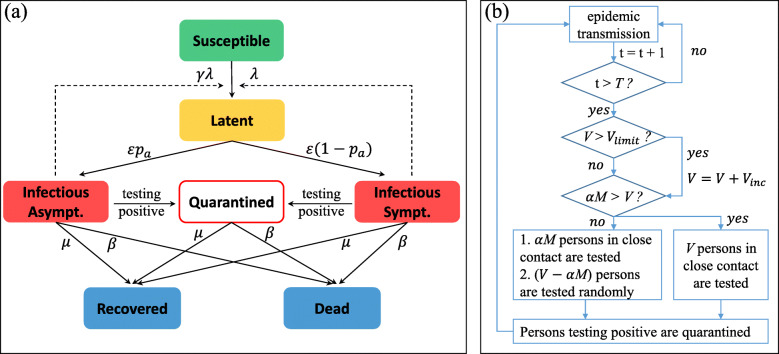
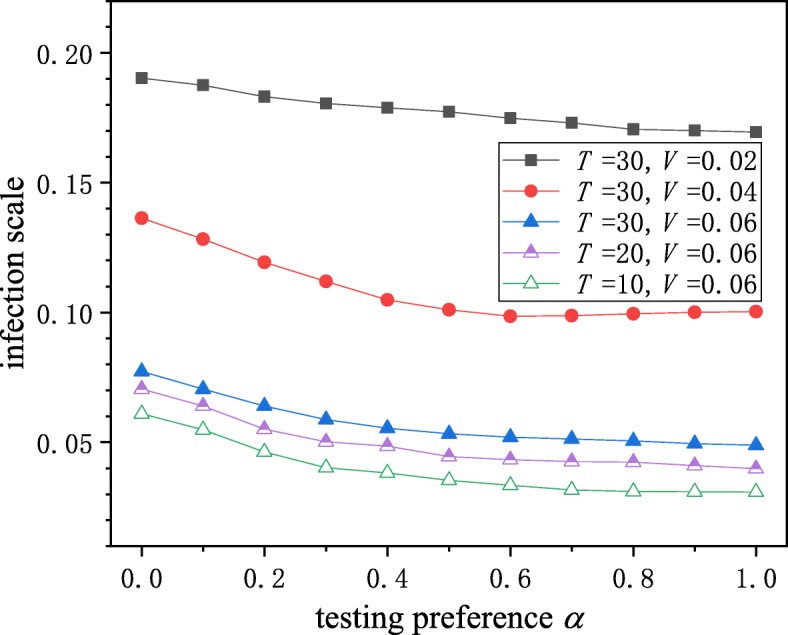
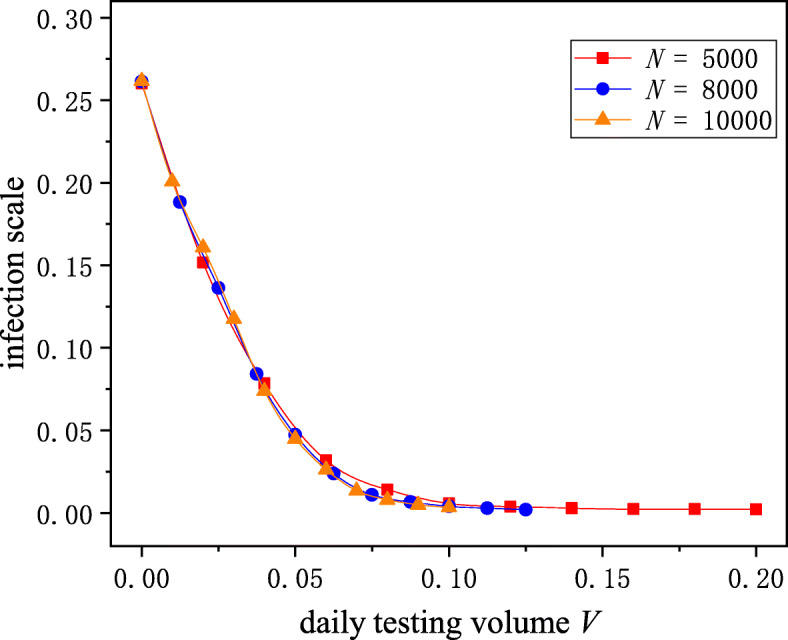
Methods: We simulated the epidemic spread process on complex networks and introduced testing preferences to describe different testing strategies. Different networks were generated to represent social contact between individuals. An extended susceptible-exposed-infected-recovered (SEIR) epidemic model was adopted to simulate the spread of epidemics in these networks. The model establishes a testing preference of between 0 and 1; the larger the testing preference, the higher the testing priority for people in close contact with confirmed cases.
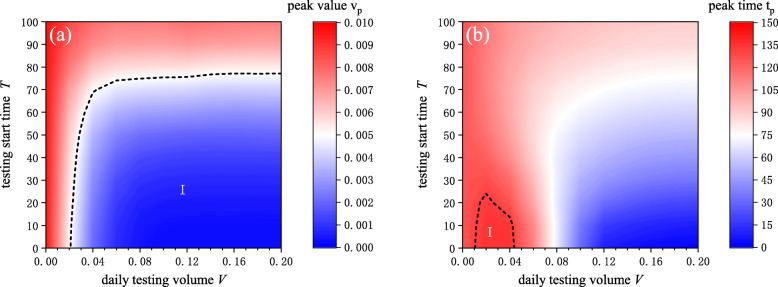
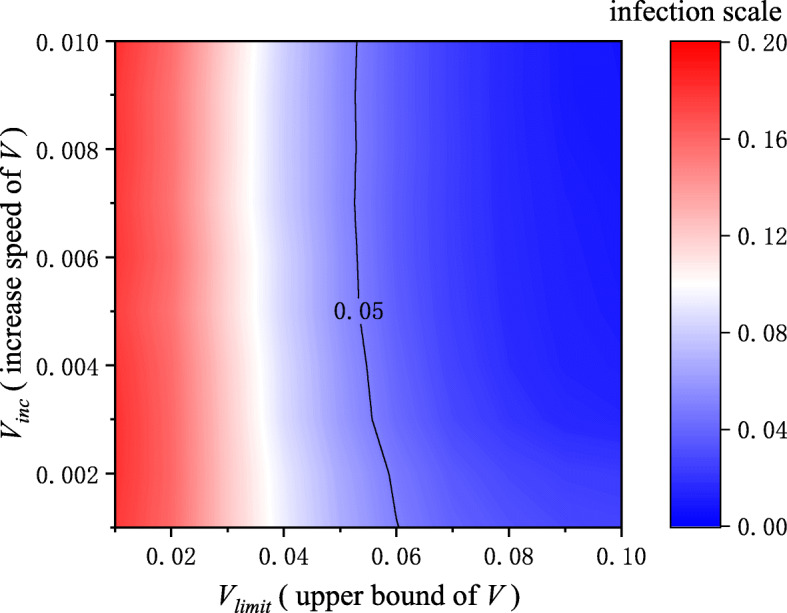
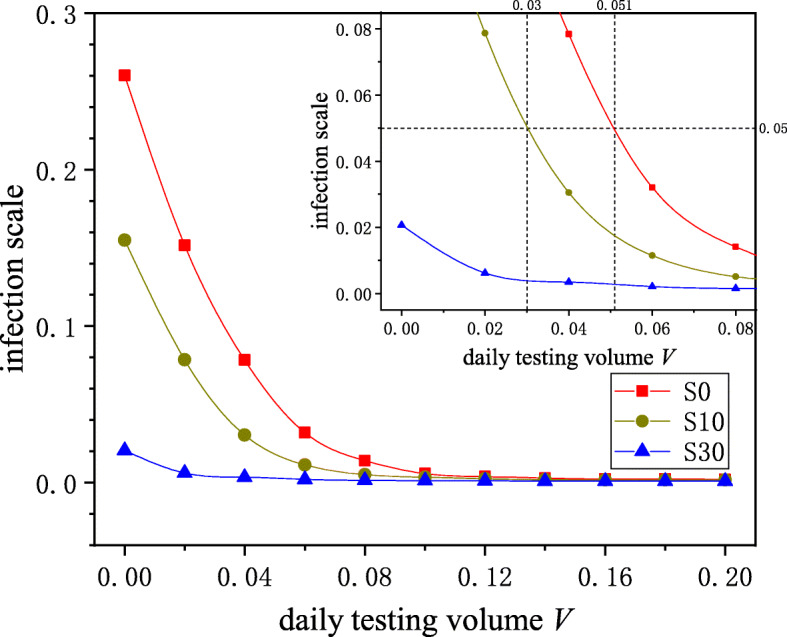
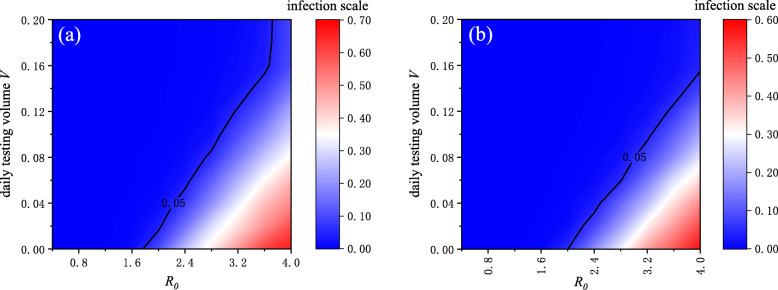
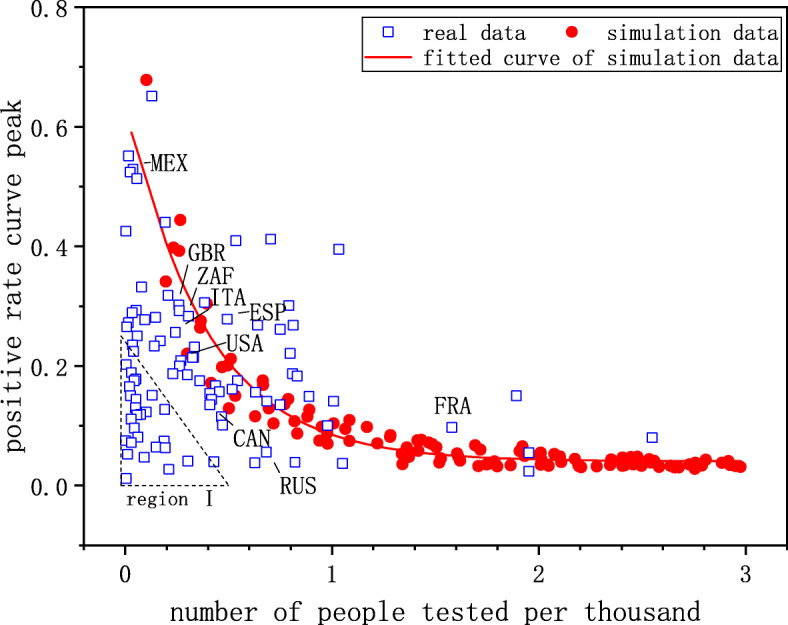
Results: The numerical simulations revealed that the higher the priority for testing individuals in close contact with confirmed cases, the smaller the infection scale. In addition, the infection peak decreased with an increase in daily testing volume and increased as the testing start time was delayed. We also discovered that when testing and other measures were adopted, the daily testing volume required to keep the infection scale below 5% was reduced by more than 40% even if other measures only reduced individuals' infection probability by 10%. The proposed model was validated using COVID-19 testing data.
Conclusions: Although testing could effectively inhibit the spread of infectious diseases and epidemics, our results indicated that it requires a huge daily testing volume. Thus, it is highly recommended that testing be adopted in combination with measures such as wearing masks and social distancing to better manage infectious diseases. Our research contributes to understanding the role of testing in epidemic control and provides useful suggestions for the government and individuals in responding to epidemics.
Keywords: COVID-19; Complex networks; Infectious disease control; Numerical simulation; Testing.
Conflict of interest statement
The authors declare that they have no competing interests.
Figures
References
-
- World Health Organization. WHO coronavirus disease (COVID-19) dashboard. 2020. https://covid19.who.int/. Accessed 28 Aug 2020.
-
- International Monetary Fund. World Economic Outlook Update: A crisis like no other, an uncertain recovery. 2020. https://www.imf.org/en/publications/weo. Accessed 28 Aug 2020.
-
- Grassly N, Pons Salort M, Parker E, et al.Report 16: Role of testing in covid-19 control.Imperial College London; 2020. 10.25561/78439.
-
- Reid S, Reid C, Vermund S. Antiretroviral therapy in sub-saharan africa: adherence lessons from tuberculosis and leprosy. Int J STD AIDS. 2004;15(11):713–6. - PubMed
-
- Mendis K, Rietveld A, Warsame M, Bosman A, Greenwood B, Wernsdorfer WH. From malaria control to eradication: The who perspective. Trop Med Int Health. 2009;14(7):802–9. - PubMed
MeSH terms
Grants and funding
LinkOut - more resources
Full Text Sources
Other Literature Sources
Medical
