. 2021 Feb;31(2):171-185.
doi: 10.1101/gr.263814.120. Epub 2021 Jan 12.

Post-transcriptional circadian regulation in macrophages organizes temporally distinct immunometabolic states

Affiliations

Post-transcriptional circadian regulation in macrophages organizes temporally distinct immunometabolic states

Emily J Collins et al. Genome Res. 2021 Feb.

Abstract

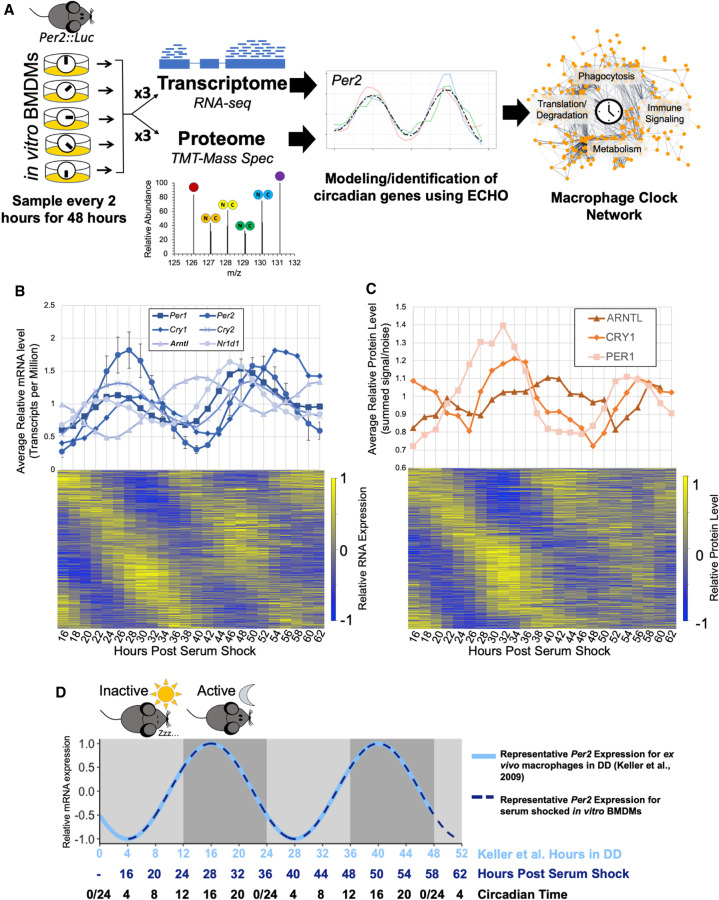
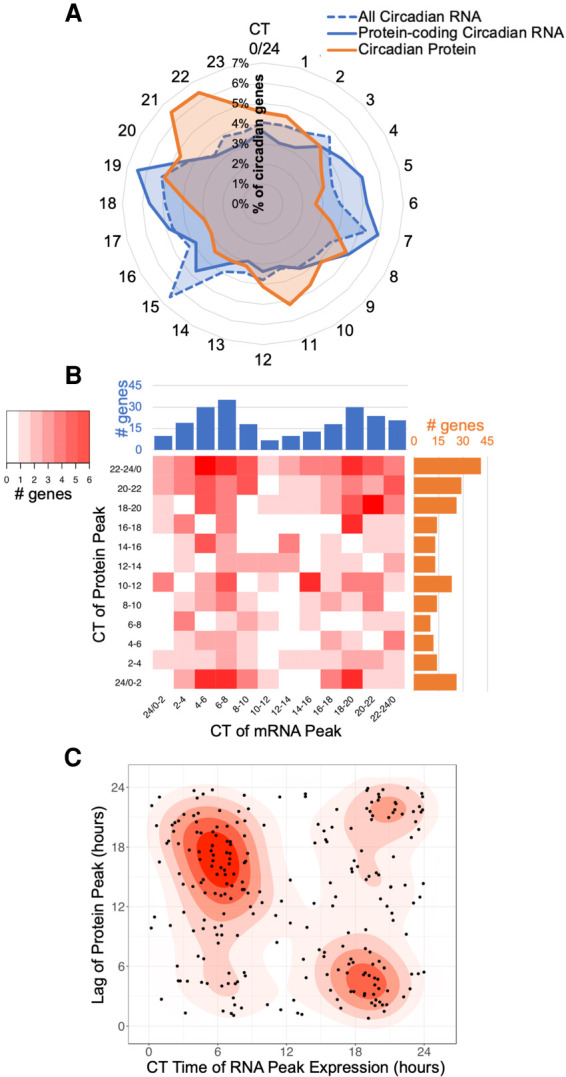
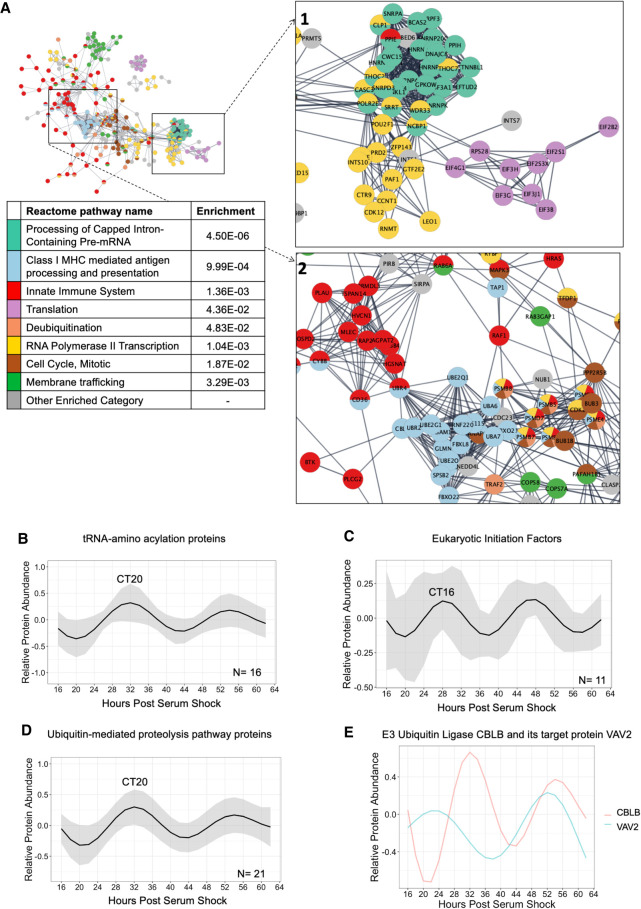
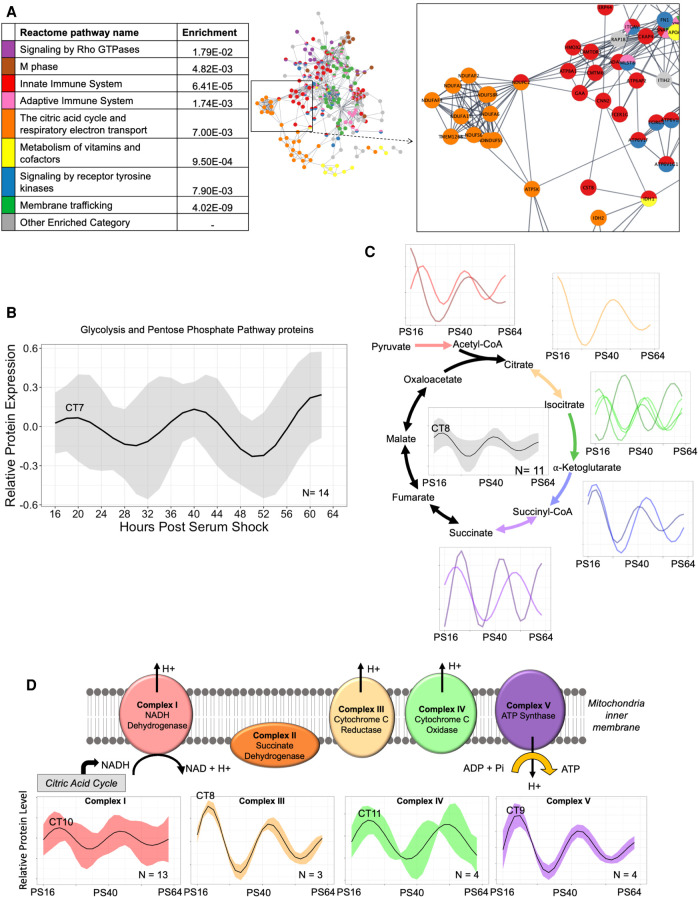
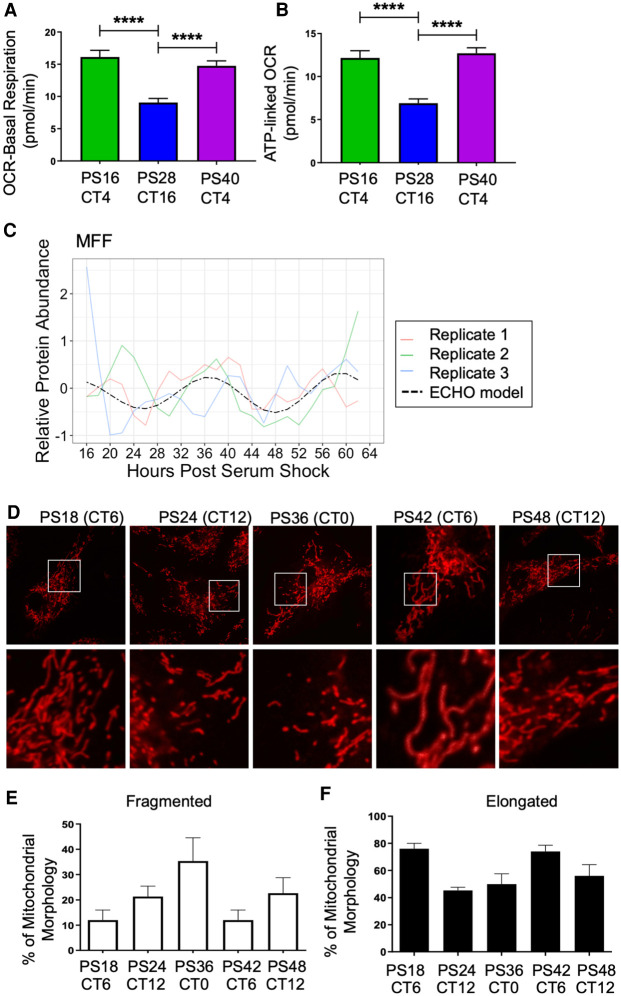
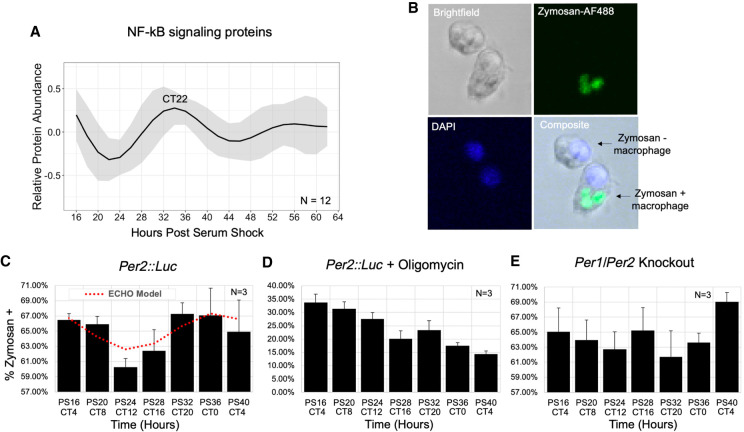
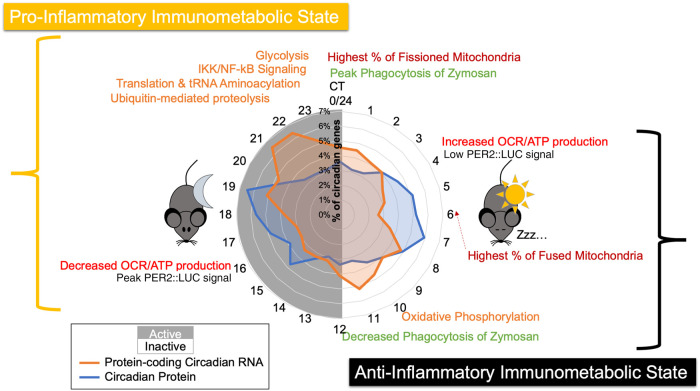
Our core timekeeping mechanism, the circadian clock, plays a vital role in immunity. Although the mechanics of circadian control over the immune response is generally explained by transcriptional activation or repression derived from this clock's transcription-translation negative-feedback loop, research suggests that some regulation occurs beyond transcriptional activity. We comprehensively profiled the transcriptome and proteome of murine bone marrow-derived macrophages and found that only 15% of the circadian proteome had corresponding oscillating mRNA, suggesting post-transcriptional regulation influences macrophage clock regulatory output to a greater extent than any other tissue previously profiled. This regulation may be explained by the robust temporal enrichment we identified for proteins involved in degradation and translation. Extensive post-transcriptional temporal-gating of metabolic pathways was also observed and further corresponded with daily variations in ATP production, mitochondrial morphology, and phagocytosis. The disruption of this circadian post-transcriptional metabolic regulation impaired immune functionality. Our results demonstrate that cell-intrinsic post-transcriptional regulation is a primary driver of circadian output in macrophages and that this regulation, particularly of metabolic pathways, plays an important role in determining their response to immune stimuli.


Figures

Figure 1.
Figure 1.
Multi-omics profiling details extensive circadian regulation of the macrophage transcriptome and proteome. (A) A schematic of the analysis of macrophage circadian regulation. Bone marrow derived macrophages (BMDMs) from Per2::Luc mice were synchronized in vitro via serum shock and sampled in triplicate for global proteome and transcriptome profiling with 10-plex tandem mass tag mass spectrometry and RNA-seq, respectively. Circadianly oscillating genes were identified using the ECHO program to determine the macrophage circadian protein–protein interaction network. (B) All detected clock gene transcripts oscillated circadianly, and error bars show the standard deviation for Per2 as a representative gene for the variation between triplicate values. Heat map in bottom panel shows relative expression for all identified circadian transcripts. (C) All detected clock proteins exhibited circadian abundances with delay from their respective transcripts. Points shown are an average of the summed signal/noise of peptides for the identified protein for up to three replicates depending on the detection at the given time point. Heat map in bottom panel shows relative expression for all identified circadian proteins. (D) A schematic summarizing how circadian time (CT) for our in vitro synchronized experimentation was inferred from comparison of Per2 mRNA oscillation timing we observed to the oscillation of Per2 mRNA reported in macrophages extracted from light-entrained mice transferred to constant dark conditions (Keller et al. 2009). Shading represents the relative inactive period (light gray) and active periods (dark gray) during the Dark:Dark (DD) experiment by Keller et al. Because mice are nocturnal, CT0/24 is the onset of the inactive period and CT12 is the onset of the active period.
Figure 2.
Figure 2.
Comparison of circadian transcripts and proteins reveals a significant role for post-transcriptional and post-translational regulation. (A) The percentage of total oscillating transcripts (blue) or proteins (orange) peaking at a given time was plotted on a radial histogram by circadian time of peak, binned in 1-h windows. (B) A heat map comparing the difference in the peak phases of corresponding oscillating transcripts (blue) and proteins (orange) binned into 2-h intervals over circadian time for genes circadian at both the mRNA and protein level. (C) Density graph displaying the lag time to protein creation from the peak time of corresponding oscillating transcript levels for genes circadian at both the mRNA and protein level.
Figure 3.
Figure 3.
Functional pathway enrichments indicate late phase post-transcriptional/-translational regulation. (A) A global view of the STRINGdb network of the proteins in enriched Reactome categories that peak in the late wave (CT15–3), with insets focusing on key interactions, including (1) Translation, RNA Polymerase II Transcription, and Processing of Capped Intron-Containing Pre-mRNA, and (2) Class I MHC mediated antigen processing and presentation, and Innate Immune System. Interactions shown as strings are filtered to highest confidence interactions (confidence > 0.9). Colors denote independent Reactome categories. Gray coloring represents genes from enriched Reactome categories that did not represent a large proportion of the protein–protein interactome or described redundant categories. (B) An average of the modeled fits of all 16 circadian proteins in the tRNA-amino acelyation reactome category. Shading indicates ±1 standard deviation of models at each time point. The circadian time of the first peak is labeled. (C) An average of the modeled fits of all 11 circadian proteins identified as elogation initiation factors. (D) An average of the modeled fits of all 21 circadian proteins in the ubiquitin-proteasome category, as defined by KEGG. Shading indicates ±1 standard deviation of models at each time point. (E) Modeled fits for the E3 ubiquitin ligase CBLB and a protein it targets for degradation, VAV2.
Figure 4.
Figure 4.
Circadian regulation of central metabolic pathways coordinates mitochondrial ATP synthesis in the early phase. (A) A global view of the STRINGdb network of the proteins in enriched Reactome categories that peak in the early wave (CT3–15), with an inset focusing on key interactions, including the citric acid cycle and respiratory electron transport. Interactions shown as strings are filtered to highest confidence interactions (confidence > 0.9). Colors denote independent Reactome categories. Gray coloring represents genes from enriched Reactome categories that did not represent a significant proportion of the protein–protein interactome or described redundant categories. (B) An average of the oscillations for circadian proteins in the glycolysis and pentose phosphate pathways (PPPs). The average relative protein abundance model of all circadian proteins identified in each phase is represented, with the shaded region representing the standard deviation between models at each time point. The circadian time of the first peak is labeled. (C) A schematic of the subunits involved in the TCA cycle which had component proteins identified as rhythmic. An average curve and shaded standard deviation of the overall TCA cycle (center) as well as individual modeled fits for all circadian proteins in the identified corresponding enzyme complex are shown next to each step. The circadian time of the first peak is labeled. (D) A schematic of the subunits involved in the ETC which had component proteins identified as rhythmic. Average curve and shaded standard deviation of the modeled fits for all circadian proteins in the identified enzyme complex are shown below. The circadian time of the first peak is labeled.
Figure 5.
Figure 5.
Circadian regulation of metabolism and mitochondrial morphology leads to a peak in mitochondrial-linked oxygen consumption rate in the early phase. Seahorse-derived measurements at different time points for the rate of (A) basal respiration and (B) ATP-linked OCR, in picomoles/min for 50,000 cells/well and 30 total wells per time point. (****) P ≤ 0.0001. (C) The oscillation of MFF protein in the proteomics time course. Across circadian time in synchronized BMDMs, mitochondria were stained using MitoTracker Red CMXRos (D), and the amount of fragmented (E) and elongated (F) mitochondria were quantified by confocal microscopy by measuring the length of over 50 mitochondrial particles per cell for 25 cells per sample in triplicate independent time courses. Mitochondria with intermediate lengths were considered “tubular” and therefore neither elongated nor fragmented.
Figure 6.
Figure 6.
Macrophage phagocytosis of zymosan shows metabolism-related circadian variation in vitro. (A) An average of the modeled fits of all 12 circadian proteins in the NF-kB signaling pathway. The circadian time of the first peak is labeled. (B) Representative confocal microscopy images demonstrating identification of macrophages positive and negative for phagocytosis of zymosan-AlexaFluor488. Cells were also DAPI-stained to aid in cell counting. The levels of phagocytosis are reported as a percent of cells with one or more particles of zymosan in (C) Per2::Luc, (D) Per2::Luc co-incubated with oligomycin, and (E) Per1/Per2 knockout BMDMs at a 4-h resolution for 24 h (N = 3). Trace of significant circadian oscillation as determined by ECHO (BH adj P-value = 0.0026) is plotted on the Per2::Luc graph in a dotted red line. Error bars represent standard error of the mean (SEM) for triplicate samples. All parameters for ECHO and JTK analyses, including noncircadian oscillatory fits for D and E, are reported in Supplemental Table S5.
Figure 7.
Figure 7.
Summary model of the circadian regulation of distinct immunometabolic states. A summary schematic displaying key findings, spatially organized by circadian time of day, with a radial histogram in the center to indicate when circadian proteins and circadian mRNAs peak in abundance. Orange text represents enriched categories identified in the proteome, red represents the occurrence of mitochondrial morphology/functional observations, green represents phagocytosis assay observations, and black text shows the trough and peak of PER2 levels as determined by PER2::LUC luminescence signal. For reference, Post Shock 16, our first time course time point, is equivalent to CT4, as described in Figure 1D.

Similar articles

  • Prescription of Controlled Substances: Benefits and Risks.
    Preuss CV, Kalava A, King KC. Preuss CV, et al. 2025 Jul 6. In: StatPearls [Internet]. Treasure Island (FL): StatPearls Publishing; 2025 Jan–. 2025 Jul 6. In: StatPearls [Internet]. Treasure Island (FL): StatPearls Publishing; 2025 Jan–. PMID: 30726003 Free Books & Documents.
  • Antidepressants for pain management in adults with chronic pain: a network meta-analysis.
    Birkinshaw H, Friedrich C, Cole P, Eccleston C, Serfaty M, Stewart G, White S, Moore A, Phillippo D, Pincus T. Birkinshaw H, et al. Health Technol Assess. 2024 Oct;28(62):1-155. doi: 10.3310/MKRT2948. Health Technol Assess. 2024. PMID: 39367772 Free PMC article.
  • Signs and symptoms to determine if a patient presenting in primary care or hospital outpatient settings has COVID-19.
    Struyf T, Deeks JJ, Dinnes J, Takwoingi Y, Davenport C, Leeflang MM, Spijker R, Hooft L, Emperador D, Domen J, Tans A, Janssens S, Wickramasinghe D, Lannoy V, Horn SRA, Van den Bruel A; Cochrane COVID-19 Diagnostic Test Accuracy Group. Struyf T, et al. Cochrane Database Syst Rev. 2022 May 20;5(5):CD013665. doi: 10.1002/14651858.CD013665.pub3. Cochrane Database Syst Rev. 2022. PMID: 35593186 Free PMC article.
  • Short-Term Memory Impairment.
    Cascella M, Al Khalili Y. Cascella M, et al. 2024 Jun 8. In: StatPearls [Internet]. Treasure Island (FL): StatPearls Publishing; 2025 Jan–. 2024 Jun 8. In: StatPearls [Internet]. Treasure Island (FL): StatPearls Publishing; 2025 Jan–. PMID: 31424720 Free Books & Documents.
  • Sexual Harassment and Prevention Training.
    Cedeno R, Bohlen J. Cedeno R, et al. 2024 Mar 29. In: StatPearls [Internet]. Treasure Island (FL): StatPearls Publishing; 2025 Jan–. 2024 Mar 29. In: StatPearls [Internet]. Treasure Island (FL): StatPearls Publishing; 2025 Jan–. PMID: 36508513 Free Books & Documents.

Cited by

References

    1. Abbas A, Lichtman A, Pillai, S. 2018. Innate immunity. In Cellular and molecular immunology, 9th ed (ed. Merritt J), pp. 82–90. Elsevier, Philadelphia.
    1. Abruzzi KC, Rodriguez J, Menet JS, Desrochers J, Zadina A, Luo W, Tkachev S, Rosbash M. 2011. Drosophila CLOCK target gene characterization: implications for circadian tissue-specific gene expression. Genes Dev 25: 2374–2386. 10.1101/gad.178079.111 - DOI - PMC - PubMed
    1. Angajala A, Lim S, Phillips JB, Kim J-H, Yates C, You Z, Tan M. 2018. Diverse roles of mitochondria in immune responses: novel insights into immuno-metabolism. Front Immunol 9: 1605 10.3389/fimmu.2018.01605 - DOI - PMC - PubMed
    1. Arjona A, Silver AC, Walker WE, Fikrig E. 2012. Immunity's fourth dimension: approaching the circadian–immune connection. Trends Immunol 33: 607–612. 10.1016/j.it.2012.08.007 - DOI - PMC - PubMed
    1. Ashburner M, Ball CA, Blake JA, Botstein D, Butler H, Cherry JM, Davis AP, Dolinski K, Dwight SS, Eppig JT, et al. 2000. Gene Ontology: tool for the unification of biology. Nat Genet 25: 25–29. 10.1038/75556 - DOI - PMC - PubMed