

OGTT Glucose Response Curves, Insulin Sensitivity, and β-Cell Function in RISE: Comparison Between Youth and Adults at Randomization and in Response to Interventions to Preserve β-Cell Function
- PMID: 33436401
- PMCID: PMC7896250
- DOI: 10.2337/dc20-2134
OGTT Glucose Response Curves, Insulin Sensitivity, and β-Cell Function in RISE: Comparison Between Youth and Adults at Randomization and in Response to Interventions to Preserve β-Cell Function
Abstract
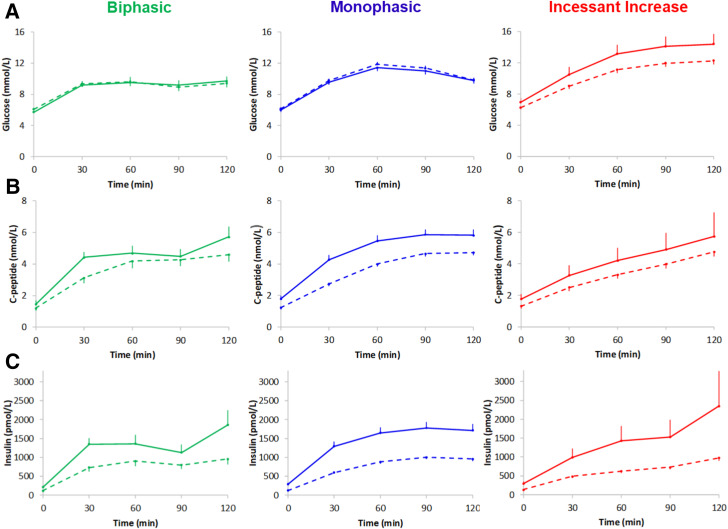
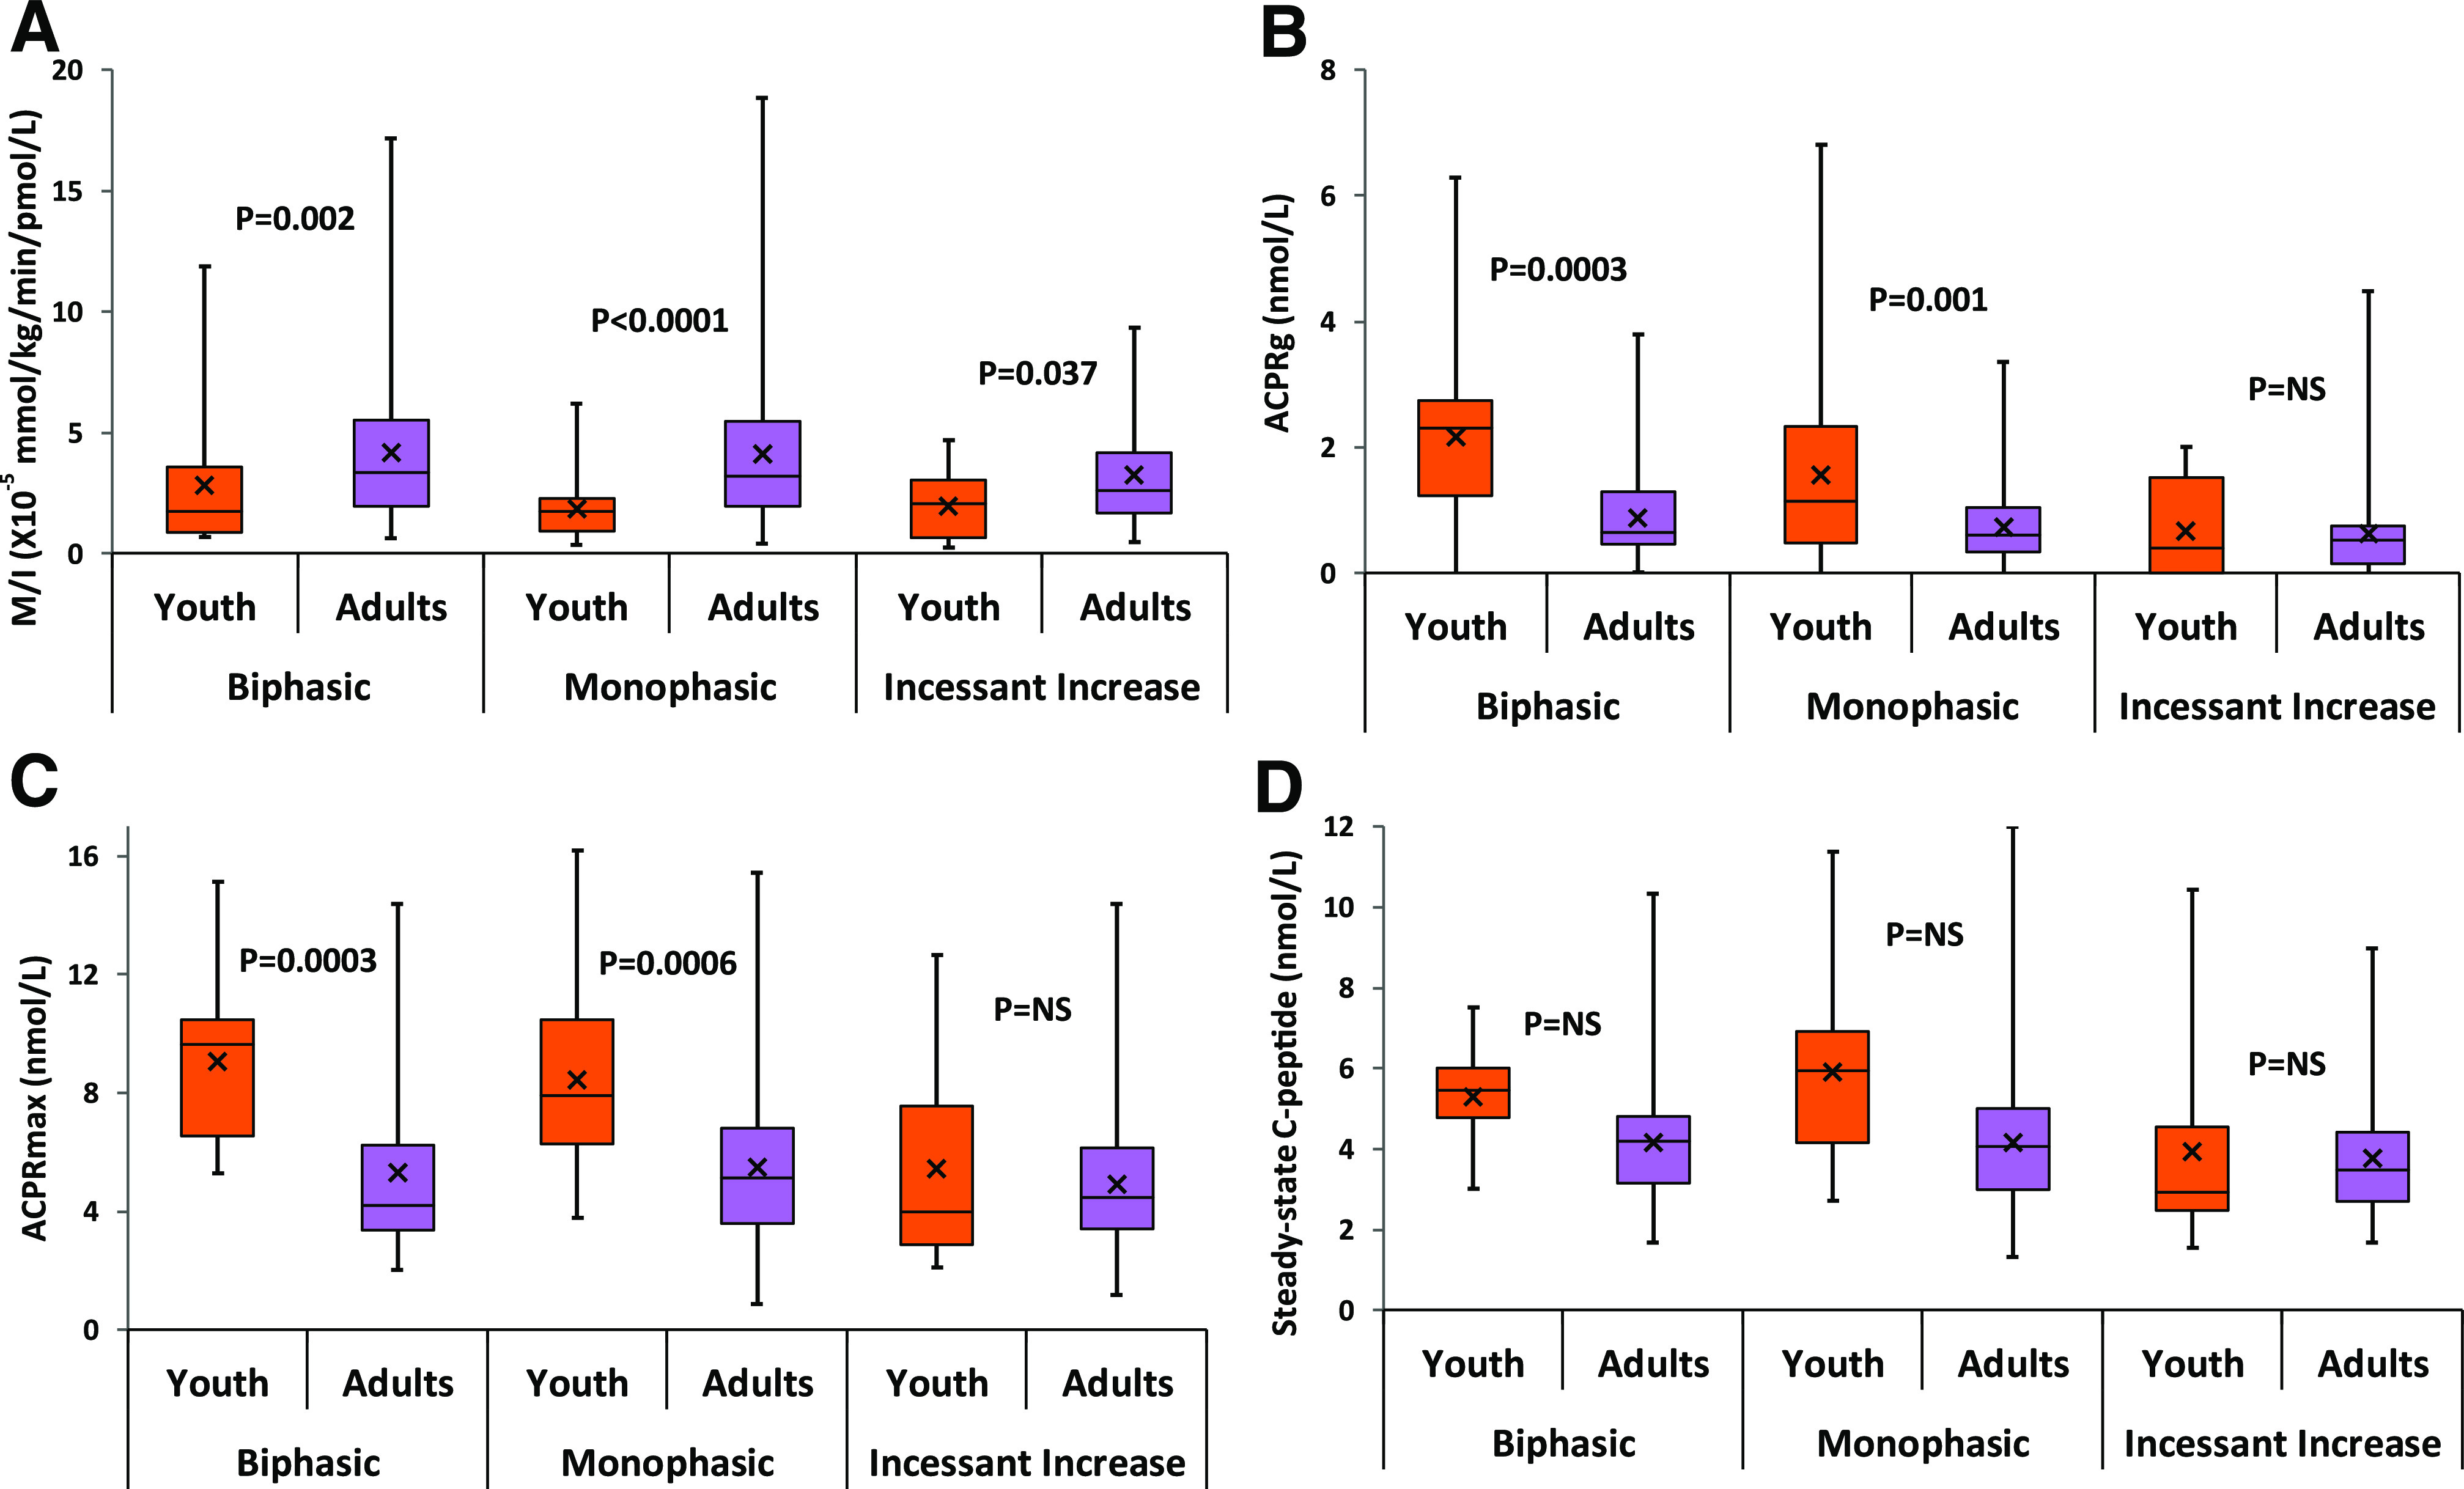
We examined the glucose response curves (biphasic [BPh], monophasic [MPh], incessant increase [IIn]) during an oral glucose tolerance test (OGTT) and their relationship to insulin sensitivity (IS) and β-cell function (βCF) in youth versus adults with impaired glucose tolerance or recently diagnosed type 2 diabetes.RESEARCH DESIGN AND METHODSThis was both a cross-sectional and a longitudinal evaluation of participants in the RISE study randomized to metformin alone for 12 months or glargine for 3 months followed by metformin for 9 months. At baseline/randomization, OGTTs (85 youth, 353 adults) were categorized as BPh, MPh, or IIn. The relationship of the glucose response curves to hyperglycemic clamp-measured IS and βCF at baseline and the change in glucose response curves 12 months after randomization were assessed.RESULTSAt randomization, the prevalence of the BPh curve was significantly higher in youth than adults (18.8% vs. 8.2%), with no differences in MPh or IIn. IS did not differ across glucose response curves in youth or adults. However, irrespective of curve type, youth had lower IS than adults (P < 0.05). βCF was lowest in IIn versus MPh and BPh in youth and adults (P < 0.05), yet compared with adults, youth had higher βCF in BPh and MPh (P < 0.005) but not IIn. At month 12, the change in glucose response curves did not differ between youth and adults, and there was no treatment effect.CONCLUSIONSDespite a twofold higher prevalence of the more favorable BPh curve in youth at randomization, RISE interventions did not result in beneficial changes in glucose response curves in youth compared with adults. Moreover, the typical β-cell hypersecretion in youth was not present in the IIn curve, emphasizing the severity of β-cell dysfunction in youth with this least favorable glucose response curve.
Trial registration: ClinicalTrials.gov NCT01779362 NCT01779375 NCT01763346.
© 2021 by the American Diabetes Association.
Figures
References
-
- Fuchigami M, Nakano H, Oba K, Metori S. Oral glucose tolerance test using a continuous blood sampling technique for analysis of the blood glucose curve. Nihon Ronen Igakkai Zasshi 1994;31:518–524 [in Japanese] - PubMed
-
- Tschritter O, Fritsche A, Shirkavand F, Machicao F, Häring H, Stumvoll M. Assessing the shape of the glucose curve during an oral glucose tolerance test. Diabetes Care 2003;26:1026–1033 - PubMed
Publication types
MeSH terms
Substances
Associated data
Grants and funding
- UL1 TR000430/TR/NCATS NIH HHS/United States
- U01 DK094406/DK/NIDDK NIH HHS/United States
- UL1 TR001857/TR/NCATS NIH HHS/United States
- UL1 TR001863/TR/NCATS NIH HHS/United States
- U01 DK094431/DK/NIDDK NIH HHS/United States
- U01 DK094430/DK/NIDDK NIH HHS/United States
- P30 DK045735/DK/NIDDK NIH HHS/United States
- UL1 TR001082/TR/NCATS NIH HHS/United States
- P30 DK020595/DK/NIDDK NIH HHS/United States
- P30 DK017047/DK/NIDDK NIH HHS/United States
- TL1 TR001858/TR/NCATS NIH HHS/United States
- UL1 TR001108/TR/NCATS NIH HHS/United States
- U01 DK094438/DK/NIDDK NIH HHS/United States
- P30 DK116073/DK/NIDDK NIH HHS/United States
- U01 DK094467/DK/NIDDK NIH HHS/United States
- P30 DK097512/DK/NIDDK NIH HHS/United States
- K24 HL145076/HL/NHLBI NIH HHS/United States
- UL1 TR001855/TR/NCATS NIH HHS/United States
LinkOut - more resources
Full Text Sources
Other Literature Sources
Medical
