

The Irish National Adverse Event Study-2 (INAES-2): longitudinal trends in adverse event rates in the Irish healthcare system
- PMID: 33436402
- PMCID: PMC8237194
- DOI: 10.1136/bmjqs-2020-011122
The Irish National Adverse Event Study-2 (INAES-2): longitudinal trends in adverse event rates in the Irish healthcare system
Erratum in
-
Correction: The Irish National Adverse Event Study-2 (INAES-2): longitudinal trends in adverse event rates in the Irish healthcare system.BMJ Qual Saf. 2021 Nov;30(11):e3. doi: 10.1136/bmjqs-2020-011122corr1. BMJ Qual Saf. 2021. PMID: 34670869 Free PMC article. No abstract available.
Abstract
Objectives: To quantify the prevalence and nature of adverse events in acute Irish hospitals in 2015 and to assess the impact of the National Clinical Programmes and the National Clinical Guidelines on the prevalence of adverse events by comparing these results with the previously published data from 2009.
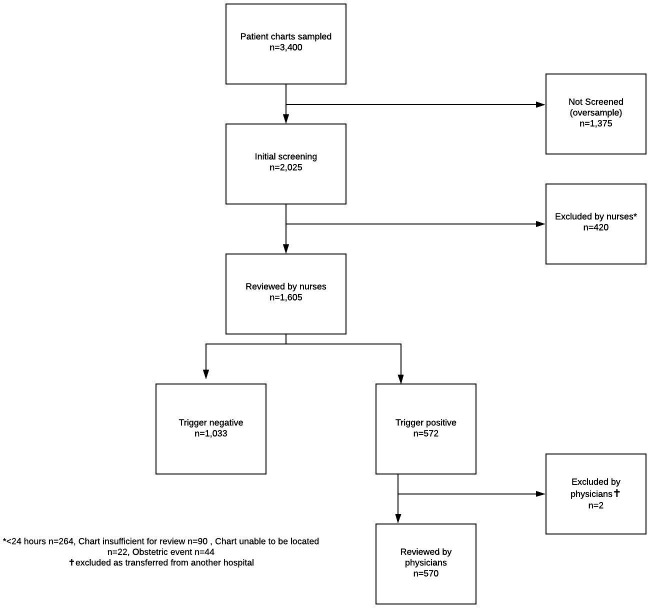
Design and methods: A retrospective chart review of 1605 admissions to eight Irish hospitals in 2015, using identical methods to those used in 2009.
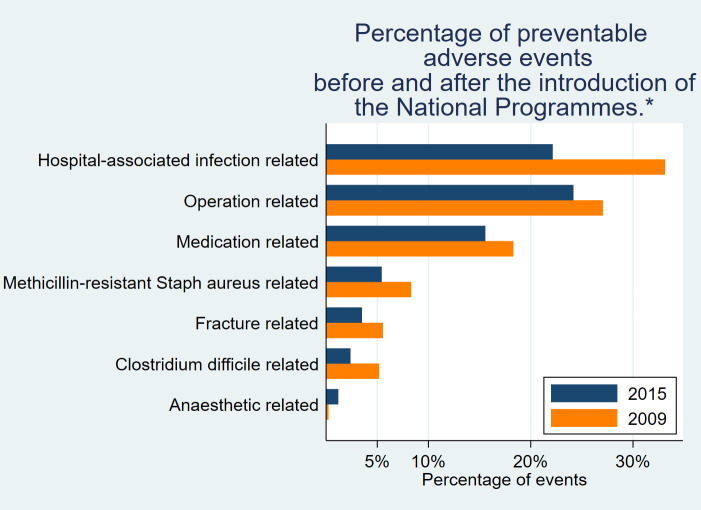
Results: The percentage of admissions associated with one or more adverse events was unchanged (p=0.48) at 14% (95% CI=10.4% to 18.4%) in 2015 compared with 12.2% (95% CI=9.5% to 15.5%) in 2009. Similarly, the prevalence of preventable adverse events was unchanged (p=0.3) at 7.4% (95% CI=5.3% to 10.5%) in 2015 compared with 9.1% (95% CI=6.9% to 11.9%) in 2009. The incidence densities of preventable adverse events were 5.6 adverse events per 100 admissions (95% CI=3.4 to 8.0) in 2015 and 7.7 adverse events per 100 admissions (95% CI=5.8 to 9.6) in 2009 (p=0.23). However, the percentage of preventable adverse events due to hospital-associated infections decreased to 22.2% (95% CI=15.2% to 31.1%) in 2015 from 33.1% (95% CI=25.6% to 41.6%) in 2009 (p=0.01).
Conclusion: Adverse event rates remained stable between 2009 and 2015. The percentage of preventable adverse events related to hospital-associated infection decreased, which may represent a positive impact of the related national programmes and guidelines.
Keywords: adverse events; epidemiology and detection; healthcare quality improvement; patient safety; quality improvement.
© Author(s) (or their employer(s)) 2021. Re-use permitted under CC BY-NC. No commercial re-use. See rights and permissions. Published by BMJ.
Conflict of interest statement
Competing interests: None declared.
Figures
References
-
- IOM . To err is human: building a safer health system. DC: National Academy Press Washington, 1999.
Publication types
MeSH terms
LinkOut - more resources
Full Text Sources
Other Literature Sources
Medical