. 2021 Jan 12;12(1):289.
doi: 10.1038/s41467-020-20449-w.

Nanoparticle delivery of microRNA-146a regulates mechanotransduction in lung macrophages and mitigates injury during mechanical ventilation

Affiliations

Nanoparticle delivery of microRNA-146a regulates mechanotransduction in lung macrophages and mitigates injury during mechanical ventilation

Christopher M Bobba et al. Nat Commun. .

Abstract

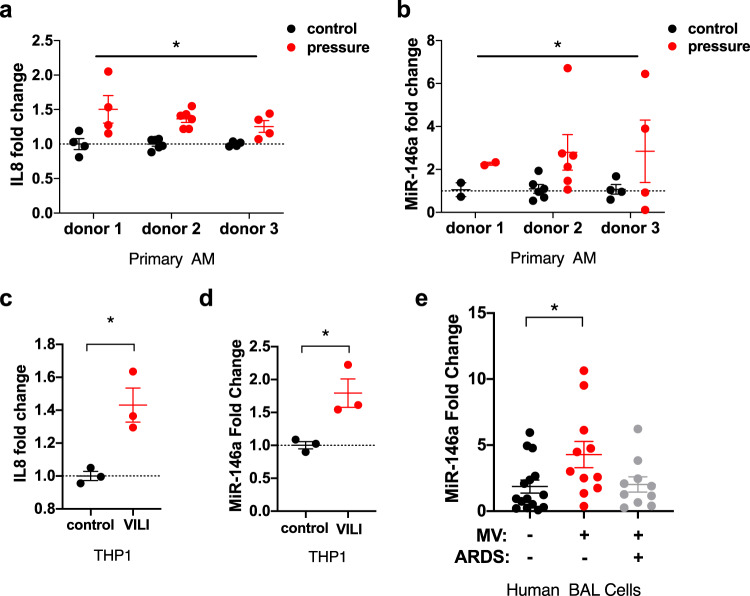
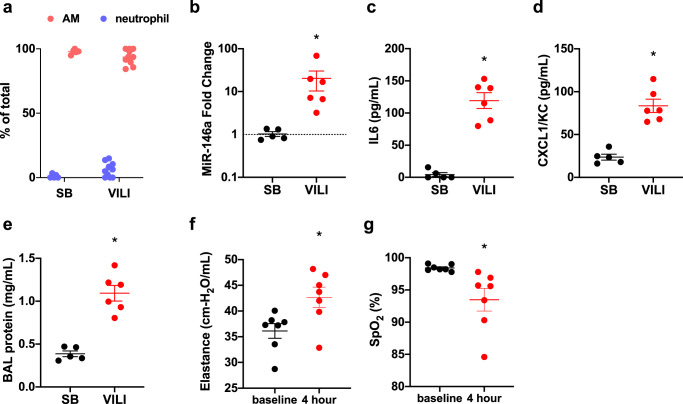
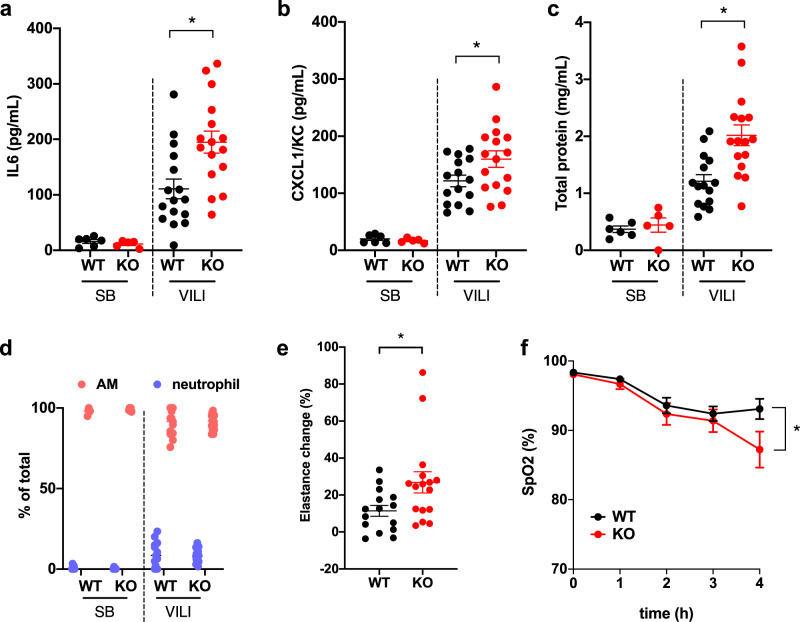
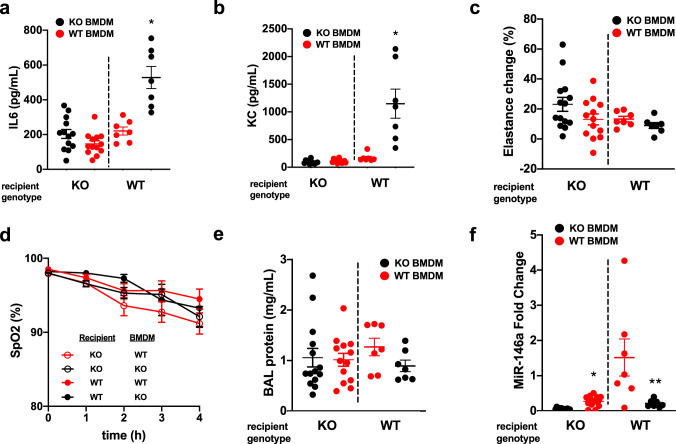
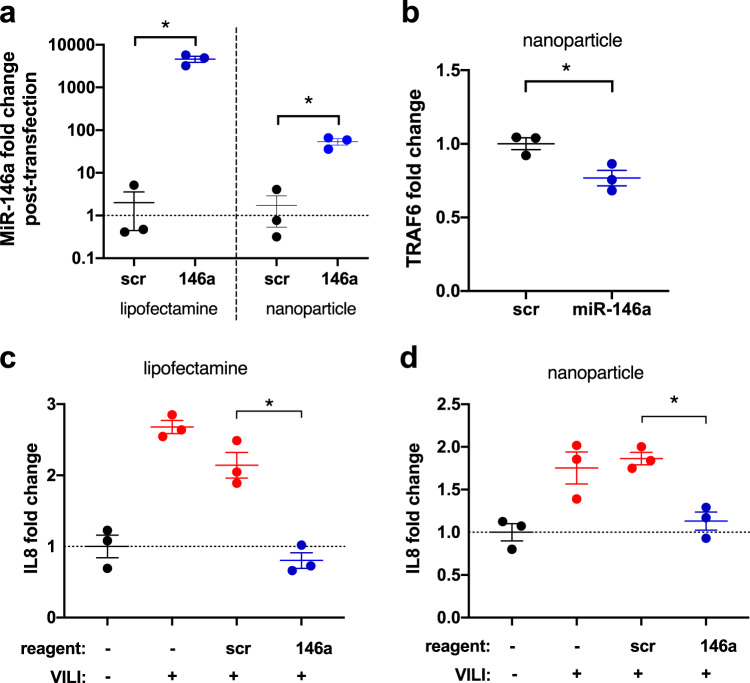
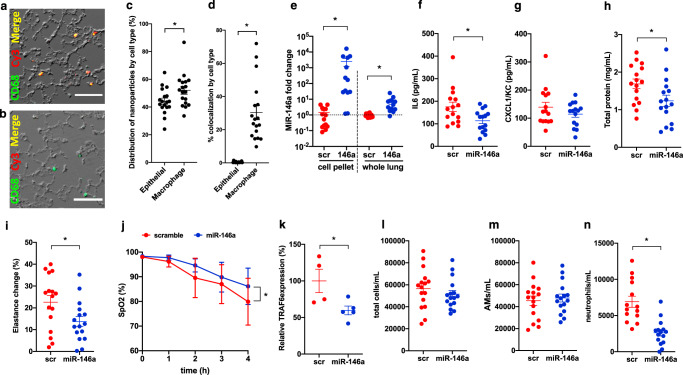
Mechanical ventilation generates injurious forces that exacerbate lung injury. These forces disrupt lung barrier integrity, trigger proinflammatory mediator release, and differentially regulate genes and non-coding oligonucleotides including microRNAs. In this study, we identify miR-146a as a mechanosensitive microRNA in alveolar macrophages that has therapeutic potential to mitigate lung injury during mechanical ventilation. We use humanized in-vitro systems, mouse models, and biospecimens from patients to elucidate the expression dynamics of miR-146a needed to decrease lung injury during mechanical ventilation. We find that the endogenous increase in miR-146a following injurious ventilation is not sufficient to prevent lung injury. However, when miR-146a is highly overexpressed using a nanoparticle delivery platform it is sufficient to prevent injury. These data indicate that the endogenous increase in microRNA-146a during mechanical ventilation is a compensatory response that partially limits injury and that nanoparticle delivery of miR-146a is an effective strategy for mitigating lung injury during mechanical ventilation.


Conflict of interest statement

The authors declare no competing interests.

Figures

Fig. 1
Fig. 1. miR-146a is upregulated in macrophages during ventilator-induced lung injury.
a Fold change in IL8 secretion in alveolar macrophages (AMs) from three donor lungs subjected to 16 h of oscillatory pressure at an air–liquid interface, compared to unpressurized controls. *indicates that pressure injury is a statistically significant factor, p < 0.0001, via two-way ANOVA on normally distributed data, n = 4 for donors 1 and 3, n = 6 for donor 2. b Relative miR-146a expression in AMs subjected to pressure, calculated by ΔΔCt method, normalized to unpressurized controls. *Indicates that pressure injury is a statistically significant factor, p = 0.0475, via two-way ANOVA on normally distributed data, n = 2 for donor 1, n = 6 for donor 2, n = 4 for donor 3. c Fold change in IL8 secretion from THP1 cells subjected to 16 h of oscillatory pressure at an air–liquid interface (VILI), compared to unpressurized controls. Data normally distributed, p = 0.0160 via two-tailed Student’s t-test, n = 3 wells per group. d Relative miR-146a expression in THP1s subjected to oscillatory pressure, calculated by ΔΔCt method, normalized to unpressurized controls. Data normally distributed, p = 0.0239 via two-tailed Student’s t-test, n = 3 wells per group. e miR-146a expression in RNA extracted from BAL cells in a cohort of patients undergoing a clinically indicated bronchoscopy. Relative expression determined by ΔΔCt method, normalized to no mechanical ventilation (MV). Data log-normally distributed, p = 0.0411 via ANOVA with post-hoc Tukey on log2 (fold change) comparing MV no ARDS and no MV no ARDS groups; n = 15 for no MV group, n = 11 for MV no ARDS, n = 10 for MV with ARDS. Data are presented as mean ± SEM.
Fig. 2
Fig. 2. Injurious mechanical ventilation in mice increases miR-146a levels in alveolar macrophages.
a Bronchoalveolar lavage (BAL) differential cell counts in spontaneously breathing (SB) and ventilator-induced lung injury (VILI) groups, n = 5 for SB, n = 10 for VILI groups. b miR-146a expression from RNA extracted from BAL cells following 4 h injurious ventilation (VILI) or from SB controls. Relative expression determined with ΔΔCt method, normalized to SB. Data log-normally distributed, p = 0.0007 via two-tailed Student’s t-test on log2 (fold change), n = 5 for SB, n = 6 for VILI groups. c IL6 concentrations from SB and VILI groups; p = 0.0043 via Mann–Whitney test, n = 5 for SB, n = 6 for VILI groups. d KC/CXCL1 concentration from SB and VILI groups. Data normally distributed, p < 0.0001 via two-tailed Student’s t-test, n = 5 for SB, n = 6 for VILI groups. e BAL protein concentration from SB and VILI groups. Data normally distributed, p < 0.0001 via two-tailed Student’s t-test, n = 5 for SB, n = 6 for VILI groups. f Lung tissue elastance measurements at initiation of ventilation (baseline) and at the conclusion of 4 h ventilation. Data normally distributed, p = 0.0194 via two-tailed Students t-test, n = 7 per group. g Blood oxygen saturation (SpO2) was measured by pulse oximetry at initiation and conclusion of ventilation. Data normally distributed, p = 0.0158 via two-tailed Student’s t-test, n = 7 per group. Data are presented as mean ± SEM.
Fig. 3
Fig. 3. miR-146a knockout mice have increased injury during mechanical ventilation.
a BAL IL6 from spontaneously breathing (SB) and mechanically ventilated (VILI) wild-type (WT) or miR-146a knockout (KO) mice. Data normally distributed, p = 0.0050 comparing VILI WT to VILI KO via two-way ANOVA with post-hoc Tukey test. b BAL KC/CXCL1 from SB and VILI mice of either WT or KO. Data normally distributed, p < 0.0001 comparing VILI WT to VILI KO via two-way ANOVA with post-hoc Tukey test. c Bronchoalveolar lavage (BAL) protein concentrations from WT and KO mice subjected to VILI (or SB controls). Data normally distributed, p < 0.0010 comparing VILI WT to VILI KO via two-way ANOVA with post-hoc Tukey test. d BAL differential cell counts; n = 16 for KO VILI group, n = 13 for WT VILI group, n = 5 for WT SB, and n = 5 for KO SB groups. e Lung tissue elastance measurements during ventilation, normalized to initial values for each individual animal. Data non-normally distributed, p = 0.0330 via two-tailed Mann–Whitney test. f Oxygen saturation throughout duration of VILI measured via pulse oximetry. All data normally distributed, presented as mean + SEM, p = 0.0091 via repeated measures two-way ANOVA with Sidak’s multiple comparisons test at 4 h time point; n = 16 for WT and KO VILI groups, n = 6 for WT SB, and n = 5 for KO SB groups for all panels except as noted above for d. Data are presented as mean ± SEM.
Fig. 4
Fig. 4. Adoptive transfer of macrophages alters miR-146a levels but is not sufficient to prevent lung injury.
a Bronchoalveolar lavage (BAL) IL6 levels from miR-146a knockout (KO, left panel) and wild-type (WT, right panel) mice subjected to ventilator-induced lung injury (VILI) following adoptive transfer of WT or miR-146a KO bone-marrow-derived macrophages (BMDMs). Data normally distributed, p = 0.0847 via two-tailed Student’s t-test comparing KO recipients, p = 0.0007 via two-tailed Student’s t-test comparing WT recipients. b BAL KC/CXCL1 levels from KO (left panel) and WT (right panel) mice subjected to VILI following adoptive transfer of WT or KO BMDMs. Data not normally distributed, p = 0.0006 via Mann–Whitney test. c Change in lung tissue elastance following 4 h VILI, normalized to baseline elastance prior to VILI. All data normally distributed, analyzed by two-tailed Student’s t-test. d Oxygen saturation throughout duration of VILI measured via pulse oximetry. e BAL protein levels from KO (left panel) and WT (right panel) mice subjected to VILI following adoptive transfer of WT or KO BMDMs. f miR-146a expression in BAL cell pellet RNA from KO (left panel) and WT (right panel) mice subjected to VILI following adoptive transfer of WT or KO BMDMs. Relative expression determined by ΔΔCt method, normalized to WT mice that received WT BMDMs. Data normally distributed, analyzed by two-tailed Student’s t-test; *p < 0.0001 compared to KO recipients that received KO BMDMs, **p = 0.0290 compared to WT recipients that received WT BMDMs. For all panels KO recipients: n = 14 KO BMDMs, n = 13 WT BMDMs. For WT recipients: n = 7 per group. Data are presented as mean ± SEM.
Fig. 5
Fig. 5. miR-146a overexpression dampens force-induced inflammation in vitro.
a miR-146a expression in alveolar macrophages (AMs) subjected to barotrauma following lipofectamine (left panel) or nanoparticle (right panel) transfection with pre-miR-146a, calculated by ΔΔCt method, normalized to scramble controls. Lipofectamine data log-normally distributed, p = 0.0006 via two-tailed Student’s t-test comparing log2 (fold change), n = 3 per group. Nanoparticle data normally distributed, p = 0.0048 via two-tailed Student’s t-test, n = 3 per group. b RelativeTRAF6 mRNA expression in AMs following nanoparticle mediated miR-146a transfection, calculated by ΔΔCt method, normalized to scramble transfected control. Data normally distributed, p = 0.0240 via two-tailed Student’s t-test. n = 3 per group. c Fold change in IL8 secretion from AMs subjected to pressure (VILI) following scramble transfection or pre-miR-146a transfection using lipofectamine. Secretion was normalized to unpressurized control. Data normally distributed, p = 0.0006 comparing scr and 146a lipofectamine transfected groups, analyzed via one-way ANOVA with post-hoc Tukey test. n = 3 per group. d Fold change in IL8 secretion from AMs subjected to pressure (VILI) following scramble transfection or pre-miR-146a transfection using custom loaded lipid nanoparticles. Secretion normalized to unpressurized control. Data normally distributed, p = 0.0135 comparing scr and 146a nanoparticle transfected groups, analyzed via one-way ANOVA with post-hoc Tukey test; n = 3 per group. Data are presented as mean ± SEM.
Fig. 6
Fig. 6. miR-146a-loaded nanoparticles mitigate lung injury during mechanical ventilation.
Representative fluorescence and DIC images from lung tissue of spontaneously breathing mice treated with Cy3-labeled nanoparticles (a) or PBS vehicle (b) prior to immunofluorescence staining for CD68 (green). Scale bar: 100 μm, n = 2 mice per group. c Distribution of Cy3-labeled nanoparticles by cell type using immunofluorescence images shown in Supplementary Fig. 7. Data normally distributed, p = 0.0323 via two-tailed Student’s t-test; n = 18 high-power fields from two animals per group. d Percentage of epithelial and macrophage cell area containing Cy3-labeled nanoparticles. Data log normally distributed, p < 0.0001 via two-tailed Student’s t-test on log2 transformed data. e miR-146a expression in RNA from BAL cell pellet (left panel) or lung tissue (right panel) following nanoparticle delivery and VILI. Relative expression determined by ΔΔCt method, normalized to VILI alone. Data log normally distributed, p < 0.0001 via two tailed Student’s t-test on log2 (fold change). f BAL IL6 from miR-146a or scramble (scr) loaded nanoparticle treated mice following 4 h VILI. Data log normally distributed, p = 0.0132 via two-tailed Student’s t-test on log2 transformed data. g BAL KC from miR-146a and scr mice following VILI. h BAL protein concentration BAL from miR-146a and scr mice following VILI. Data normally distributed, p = 0.0300 via two-tailed Student’s t-test. i Change in lung elastance during 4 h period of ventilation. Data normally distributed, p = 0.0311 via two-tailed Student’s t-test. j Oxygenation throughout duration of ventilation measured via pulse oximetry. Data normally distributed, p = 0.0110 via Sidak’s multiple comparison test at 4 h time point following repeated measures two-way ANOVA. k TRAF6 message levels from BAL cells by ΔΔCt method normalized to scramble. Data log-normally distributed, p = 0.0356 via two-tailed Student’s t-test on log2 (fold change); n = 4 for scramble group and n = 5 for miR group. l Total cell count obtained from BAL cell differential counts after ventilation. Data normally distributed, analyzed by two-tailed Student’s t-test. m Alveolar macrophage (AM) cell count following ventilation. Data normally distributed, analyzed by two-tailed Student’s t-test. n Neutrophil cell count following ventilation. Data normally distributed, p < 0.0001 via two-tailed Student’s t-test. For all panels, n = 16 per group unless otherwise noted. Data are presented as mean ± SEM.

Similar articles

Cited by

References

    1. Thompson BT, Chambers RC, Liu KD. Acute respiratory distress syndrome. N. Engl. J. Med. 2017;377:562–572. doi: 10.1056/NEJMra1608077. - DOI - PubMed
    1. Englert, J. A., Bobba, C. & Baron, R. M. Integrating molecular pathogenesis and clinical translation in sepsis-induced acute respiratory distress syndrome. JCI Insight4, e124061 (2019). - PMC - PubMed
    1. Slutsky AS, Ranieri VM. Ventilator-induced lung injury. N. Engl. J. Med. 2013;369:2126–2136. doi: 10.1056/NEJMra1208707. - DOI - PubMed
    1. Tremblay L, Valenza F, Ribeiro SP, Li J, Slutsky AS. Injurious ventilatory strategies increase cytokines and c-fos m-RNA expression in an isolated rat lung model. J. Clin. Invest. 1997;99:944–952. doi: 10.1172/JCI119259. - DOI - PMC - PubMed
    1. Guay J, Ochroch EA, Kopp S. Intraoperative use of low volume ventilation to decrease postoperative mortality, mechanical ventilation, lengths of stay and lung injury in adults without acute lung injury. Cochrane Database Syst. Rev. 2018;7:CD011151. - PMC - PubMed

Publication types

MeSH terms

LinkOut - more resources