. 2021 Jan 12;12(1):325.
doi: 10.1038/s41467-020-20094-3.

Multiplexed characterization of rationally designed promoter architectures deconstructs combinatorial logic for IPTG-inducible systems

Affiliations

Multiplexed characterization of rationally designed promoter architectures deconstructs combinatorial logic for IPTG-inducible systems

Timothy C Yu et al. Nat Commun. .

Abstract

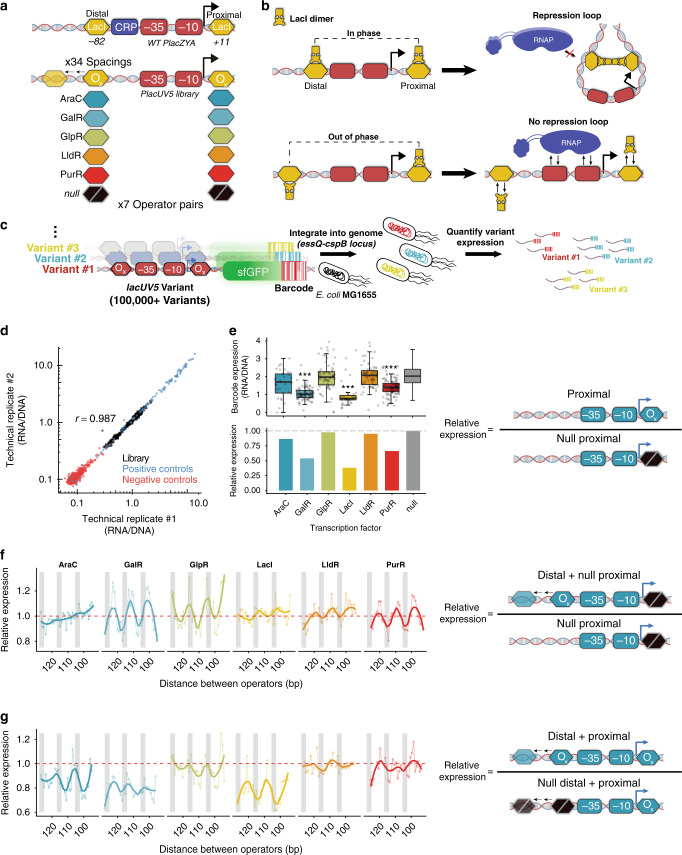
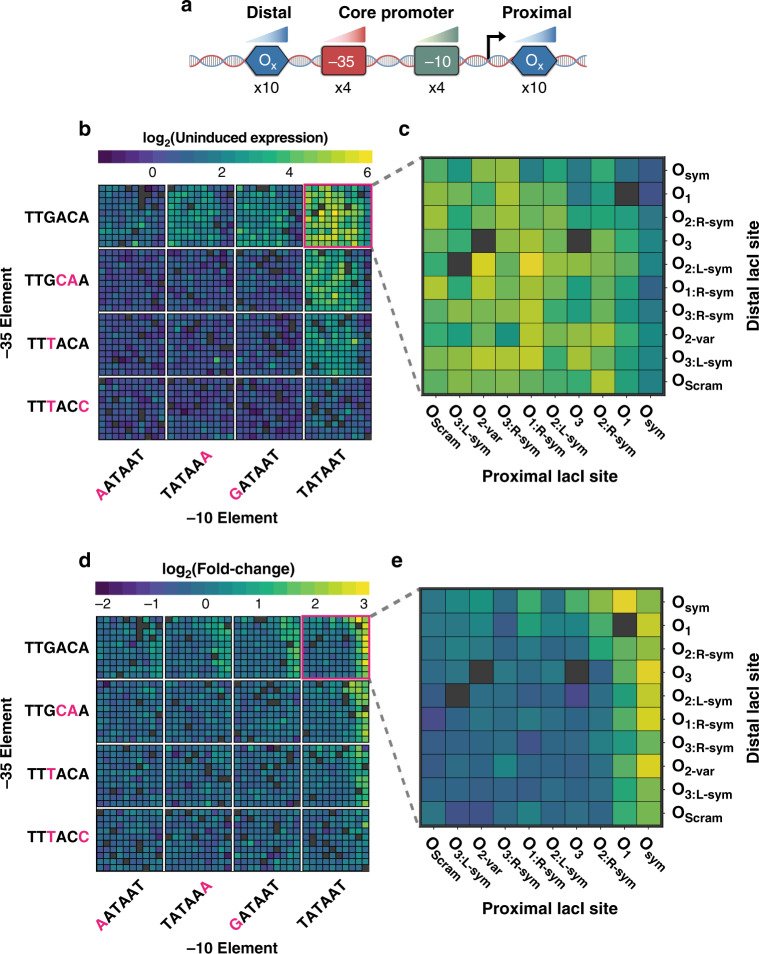
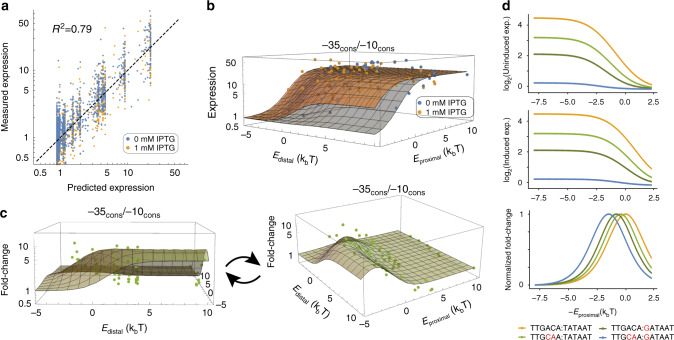
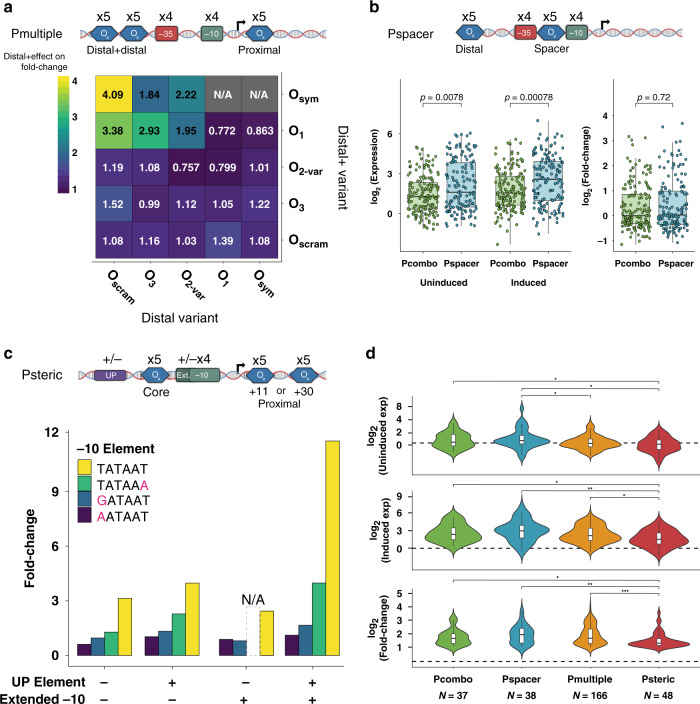
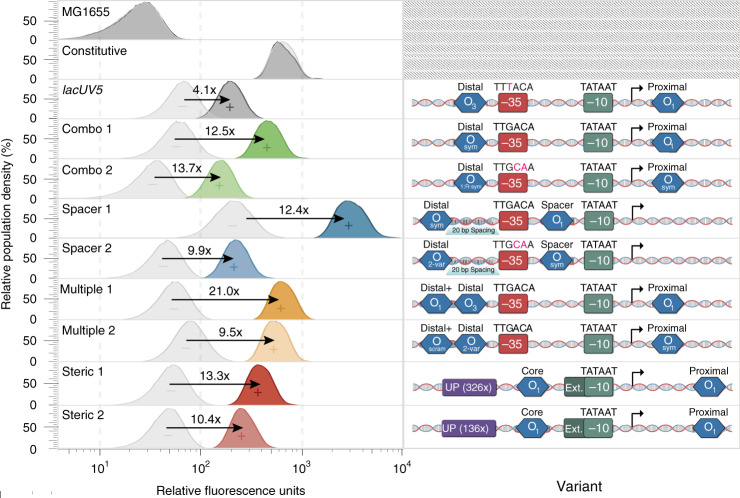
A crucial step towards engineering biological systems is the ability to precisely tune the genetic response to environmental stimuli. In the case of Escherichia coli inducible promoters, our incomplete understanding of the relationship between sequence composition and gene expression hinders our ability to predictably control transcriptional responses. Here, we profile the expression dynamics of 8269 rationally designed, IPTG-inducible promoters that collectively explore the individual and combinatorial effects of RNA polymerase and LacI repressor binding site strengths. We then fit a statistical mechanics model to measured expression that accurately models gene expression and reveals properties of theoretically optimal inducible promoters. Furthermore, we characterize three alternative promoter architectures and show that repositioning binding sites within promoters influences the types of combinatorial effects observed between promoter elements. In total, this approach enables us to deconstruct relationships between inducible promoter elements and discover practical insights for engineering inducible promoters with desirable characteristics.


Conflict of interest statement

The authors declare no competing interests.

Figures

Fig. 1
Fig. 1. Identifying optimal spacing for repressors at lacUV5 promoter.
a We designed a library of lacUV5 variants modeled after the WT lacZYA promoter. In this library, we evaluate repressor effects when the distal site is moved 32 nucleotides upstream at 1 bp increments. b If repressors bind along the same face of the DNA helix, repression loop formation may occur, thereby preventing RNAP association with the promoter. c In this MPRA format, pooled promoter variants are engineered to express uniquely barcoded sfGFP transcripts, singly integrated into the essQ-cspB locus of the E. coli genome. After integration, individual promoter expression was determined en masse using the ratio of the barcode reads from RNA-seq to that of DNA-seq. d Comparison of MPRA expression measurements between biological replicates grown in MOPS rich-defined medium supplemented with 0.2% glucose (r = 0.987, P < 2.2 × 10−16, two-sided Student’s t test). e MPRA expression when a proximal site is added relative to expression of lacUV5 without repressor sites. Top shows the distribution of expression for all barcodes associated with each variant, whereas the bottom shows the averaged variant expression relative to lacUV5 without repressor site (null). Significance levels determined by Welch’s two-sided t test, ***P ≤ 0.001. AraC: n = 35, P = 0.07; GalR: n = 82, P = 6.68 × 10−15; LacI: n = 35, P = 2.22 × 10−7; LldR: n = 68, P = 0.47; PurR: P = 8.973 × 10−7. In each boxplot, the lower, middle, and upper hinges correspond to the first quartile, median, and third quartile, respectively. Whiskers represent 1.5× IQR from the lower and upper hinges. f Relative MPRA expression as each distal site is moved upstream in the absence of a proximal site relative to lacUV5 without repressors. Thick lines denote the fit using locally weighted polynomial regression. Thin lines connect data points at sequential intervals. Gray bars indicate 3 bp windows where the distal site is positioned in-phase with the +11 proximal site. g MPRA expression as the distal site is moved upstream when the proximal site is present relative to expression of the proximal-only variant. Source data are available in the Source Data file.
Fig. 2
Fig. 2. Tuning binding site strengths alters inducible promoter behavior.
a Pcombo library schematic consists of all combinations of one of ten proximal LacI-binding sites, four −10 elements, four −35 elements, and ten distal LacI sites. b Uninduced MPRA expression for all assayed Pcombo variants. Grid positions for the −10 and −35 motifs are arranged according to median induced expression, from the weakest to consensus sites (−10:TATAAT and −35:TTGACA). Gray boxes indicate sequences that were not measured by the assay. c Uninduced expression for assayed Pcombo variants containing consensus σ70-binding sites. d Fold change for all assayed Pcombo variants. Fold change is determined by the ratio of MPRA expression at 1 mM IPTG relative to 0 mM IPTG. e Fold change for all assayed Pcombo variants containing consensus σ70-binding sites. Source data are available in the Source Data file.
Fig. 3
Fig. 3. Thermodynamic modeling of lacUV5 promoter architecture.
a Correlation between actual lacUV5 variant expression and expression fit by our thermodynamic model (r2 = 0.79, P < 2.2 × 10−16, two-sided Student’s t test). b Induced and uninduced gene expression across the distal and proximal site binding energy parameter space. c Fold change (FC) in gene expression as a function of distal and proximal binding site energies. In panels b and c, each dot represents experimental data whereas the grid lines denote the inferred expression of a promoter with the proximal (Eproximal) and distal (Edistal) LacI binding energies shown. d As promoter strength decreases, optimal induction responses are achieved at lower proximal LacI binding site energies. Promoter binding sites are shown as −35 sequence: −10 sequence. These trends are shown in the context of an O1 distal site (Edistal = −0.23). Source data are available in the Source Data file.
Fig. 4
Fig. 4. Optimizing alternative IPTG-inducible promoter architectures.
a Top: Design for Pmultiple library. Bottom: The average effect of the distal+ site (rows) on fold change given the distal site identity (column). Here, we examine consensus −10/−35 promoters containing O1 or Osym in the proximal site. b Top: Design for Pspacer library. Bottom: Comparison of uninduced expression, induced expression, and fold change between variants composed of the same sequence elements in the Pspacer and Pcombo architectures (two-sided Mann–Whitney U tests, n = 305). We examined only active promoters containing a consensus −10 and/or −35 sequence. In each boxplot, the lower, middle, and upper hinges correspond to the first quartile, median, and third quartile, respectively. Whiskers represent 1.5 × IQR from the lower and upper hinges. c Top: Design for Psteric library. Bottom: The fold change of promoters containing O1 in both the core and proximal sites and a 56 bp interoperator distance. Here, we examine the effect of the −10 element in conjunction with the strongest UP and extended −10 element combinations. N/A indicates data missing from our analysis. d Distributions of uninduced expression, induced expression, and fold change for variants with fold change ≥2 in each library. The dashed line separates active from inactive sequences and is set as the median of the negative controls + 2*median absolute deviation (two-sided Mann–Whitney U tests with Benjamini–Hochberg correction, *P ≤ 0.05, **P ≤ 0.01, ***P ≤ 0.001). The exact P values are: uninduced (Pspacer–Psteric: P = 0.029, Pspacer–Pmultiple: P = 0.040, Pcombo–Psteric: P = 0.045), induced (Pspacer–Psteric: P = 0.002, Pcombo–Psteric: P = 0.013, Pmultiple–Psteric: P = 0.013), fold change (Pmultiple–Psteric: P = 0.0009, Pspacer–Psteric: P = 0.0045, Pcombo–Psteric: P = 0.040). Source data are available in the Source Data file.
Fig. 5
Fig. 5. Characterization of functional inducible variants using a fluorescent reporter.
Fluorescence measurements of selected variants for induced and uninduced states determined using flow cytometry. Fold change of each variant was estimated after background subtracting induced and uninduced expression. “−” represents the promoter in an uninduced state while “+” represents induction after 1 mM IPTG. Source data are available in the Source Data file.

Similar articles

Cited by

References

    1. Khalil AS, Collins JJ. Synthetic biology: applications come of age. Nat. Rev. Genet. 2010;11:367–379. doi: 10.1038/nrg2775. - DOI - PMC - PubMed
    1. Rogers JK, et al. Synthetic biosensors for precise gene control and real-time monitoring of metabolites. Nucleic Acids Res. 2015;43:7648–7660. doi: 10.1093/nar/gkv616. - DOI - PMC - PubMed
    1. Alper H, Fischer C, Nevoigt E, Stephanopoulos G. Tuning genetic control through promoter engineering. Proc. Natl Acad. Sci. USA. 2005;102:12678–12683. doi: 10.1073/pnas.0504604102. - DOI - PMC - PubMed
    1. Riglar DT, et al. Engineered bacteria can function in the mammalian gut long-term as live diagnostics of inflammation. Nat. Biotechnol. 2017;35:653–658. doi: 10.1038/nbt.3879. - DOI - PMC - PubMed
    1. Binder D, et al. Light-controlled cell factories: employing photocaged isopropyl-β-d-thiogalactopyranoside for light-mediated optimization of lac promoter-based gene expression and (+)-valencene biosynthesis in Corynebacterium glutamicum. Appl. Environ. Microbiol. 2016;82:6141–6149. doi: 10.1128/AEM.01457-16. - DOI - PMC - PubMed

Publication types

Substances