. 2021 Jan 7;12(1):20211.
doi: 10.1038/s41467-020-20237-6.

Genome-wide analyses of behavioural traits are subject to bias by misreports and longitudinal changes

Affiliations

Genome-wide analyses of behavioural traits are subject to bias by misreports and longitudinal changes

Angli Xue et al. Nat Commun. .

Erratum in

Abstract

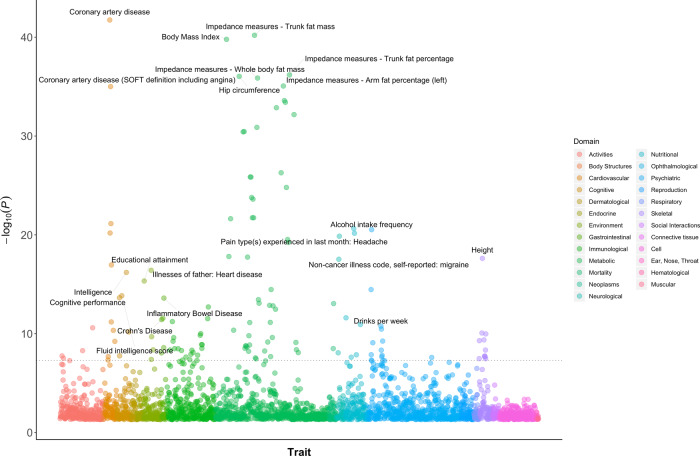
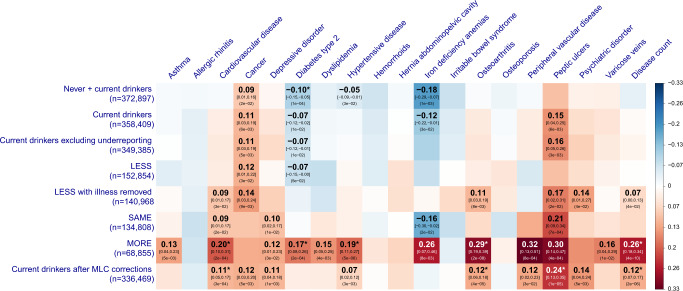
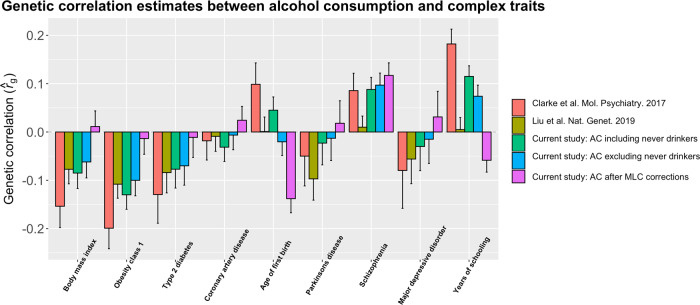
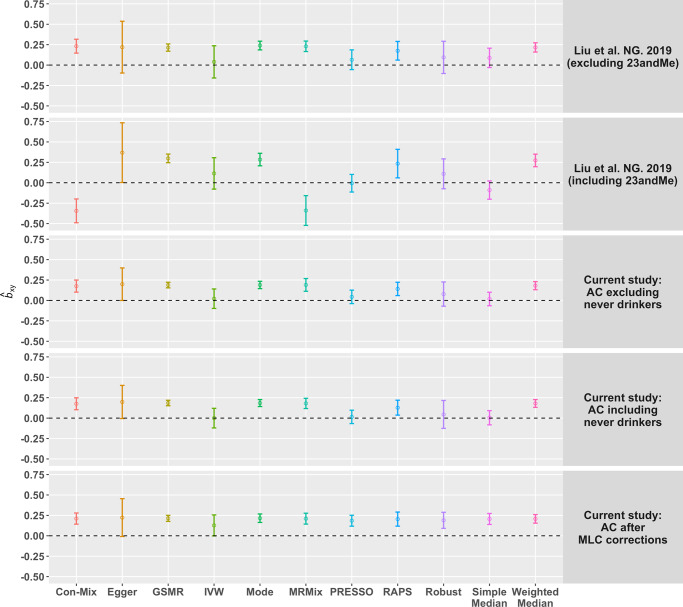
Genome-wide association studies (GWAS) have discovered numerous genetic variants associated with human behavioural traits. However, behavioural traits are subject to misreports and longitudinal changes (MLC) which can cause biases in GWAS and follow-up analyses. Here, we demonstrate that individuals with higher disease burden in the UK Biobank (n = 455,607) are more likely to misreport or reduce their alcohol consumption levels, and propose a correction procedure to mitigate the MLC-induced biases. The alcohol consumption GWAS signals removed by the MLC corrections are enriched in metabolic/cardiovascular traits. Almost all the previously reported negative estimates of genetic correlations between alcohol consumption and common diseases become positive/non-significant after the MLC corrections. We also observe MLC biases for smoking and physical activities in the UK Biobank. Our findings provide a plausible explanation of the controversy about the effects of alcohol consumption on health outcomes and a caution for future analyses of self-reported behavioural traits in biobank data.


Conflict of interest statement

The authors declare no competing interests.

Figures

Fig. 1
Fig. 1. PheWAS results for the 16 AC GWAS signals that became non-significant after the MLC corrections.
This figure shows associations of the AC-associated variants, which became non-significant because of the MLC corrections, with all the common traits and diseases for which summary data from large-scale GWASs are available in the public domain (https://atlas.ctglab.nl/PheWAS). The colour denotes the domain of each associated trait. There were 136 traits associated with the 16 SNPs with P<5×10⁸, and 61 (44.9%) of them were metabolic/cardiovascular traits.
Fig. 2
Fig. 2. Estimates of genetic correlation between AC and common diseases in the UKB.
The rows denote 8 GWAS summary data sets for AC with the sample size labelled in the bracket. The columns are 18 common diseases and disease count. The nominal significant effects (P<0.05) are labelled with r^g [95% confidence interval] (P-value), and the significant effects after multiple testing correction (P<0.05/152) are labelled with an additional asterisk. The colour of the block represents the size each genetic correlation estimate. The P-value shown in the block is the original P-value for r^g (two-sided χ2 test). “Current drinkers excluding underreporting” represents current drinkers excluding 9,064 individuals who likely underreported their AC levels. LESS, SAME, and MORE represent current drinkers whose AC levels were reduced, maintained the same, and increased, respectively, compared to 10 years ago. “LESS with illness removed” represents the LESS group excluding the participants who reduced their AC intake level due to illness or doctor’s advice.
Fig. 3
Fig. 3. Estimates of genetic correlation between AC and complex traits using data from the UKB and other published studies.
Genetic correlation was estimated by the bivariate-LDSC in LD Hub. The y-axis shows the estimate of rg, and the x-axis shows different complex traits. The error bars denote the standard errors of the estimates. The results using the summary statistics from our analysis were compared to those from Clarke et al., who used self-reported AC from the interim release of the UKB data, and Liu et al., a meta-analysis that included the full release of the UKB data. The sample sizes of the five AC data sets are 112,117 (Clarke et al.), 941,280 (Liu et al.), 372,897 (including never drinkers), 358,409 (excluding never drinkers), and 336,469 (after the MLC corrections), respectively.
Fig. 4
Fig. 4. Estimates of causal effect of AC on BMI using different MR methods.
The colour of the circle denotes different MR methods. The methods on the x-axis is ranked based on alphabetic order from the left to the right. The y-axis is the bxy estimates from each method. The error bars denote 95% confidence interval of the estimates. The row-wise panels indicate five different GWAS summary data sets for AC. The horizontal black dashed line indicates bxy = 0. The sample sizes (n) of the five AC data sets are 537,349 (Liu et al. excluding 23andMe), 941,280 (Liu et al. including 23andMe), 358,409 (excluding never drinkers), 372,897 (including never drinkers), and 336,469 (after the MLC corrections), respectively.

References

    1. Holmes MV, et al. Association between alcohol and cardiovascular disease: Mendelian randomisation analysis based on individual participant data. Bmj. 2014;349:g4164. - PMC - PubMed
    1. Griswold MG, et al. Alcohol use and burden for 195 countries and territories, 1990–2016: a systematic analysis for the Global Burden of Disease Study 2016. Lancet. 2018;392:1015–1035. - PMC - PubMed
    1. Burton R, Sheron N. No level of alcohol consumption improves health. Lancet. 2018;392:987–988. - PubMed
    1. Clarke TK, et al. Genome-wide association study of alcohol consumption and genetic overlap with other health-related traits in UK Biobank (N = 112 117) Mol. Psychiatry. 2017;22:1376–1384. - PMC - PubMed
    1. Liu M, et al. Association studies of up to 1.2 million individuals yield new insights into the genetic etiology of tobacco and alcohol use. Nat. Genet. 2019;51:237–244. - PMC - PubMed

Publication types

LinkOut - more resources