. 2021 Jan 12;12(1):288.
doi: 10.1038/s41467-020-20602-5.

A therapeutic neutralizing antibody targeting receptor binding domain of SARS-CoV-2 spike protein

Affiliations

A therapeutic neutralizing antibody targeting receptor binding domain of SARS-CoV-2 spike protein

Cheolmin Kim et al. Nat Commun. .

Abstract

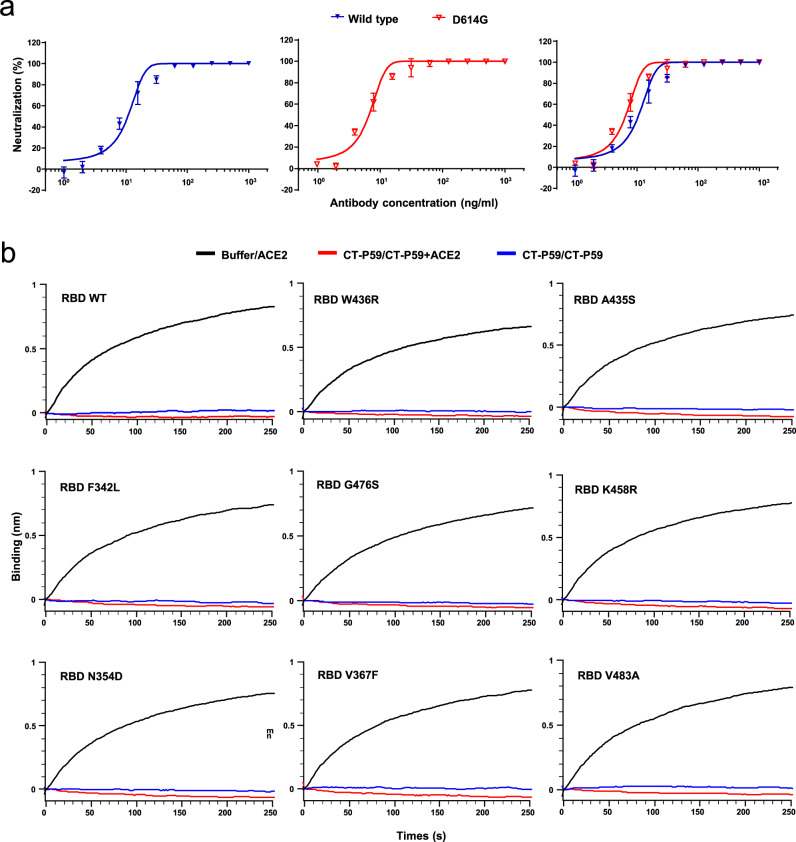
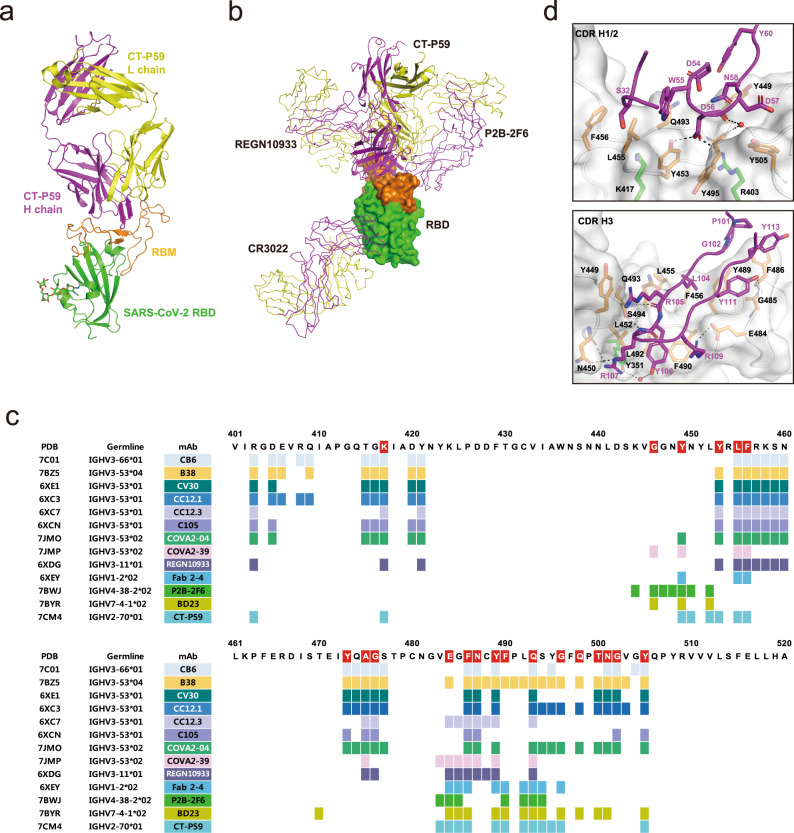
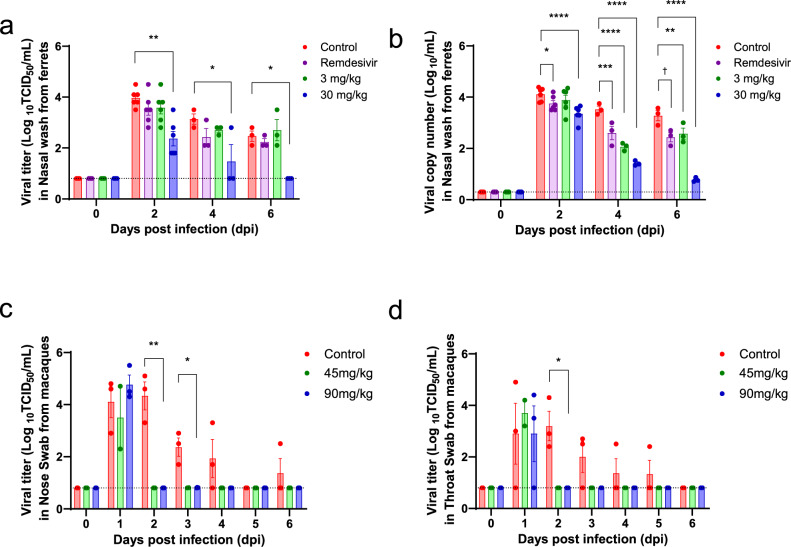
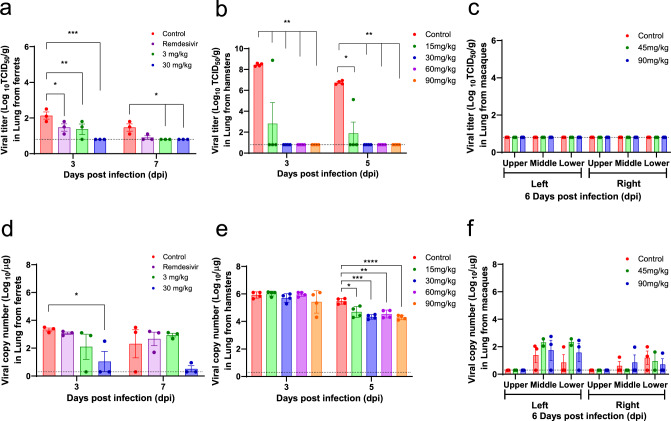
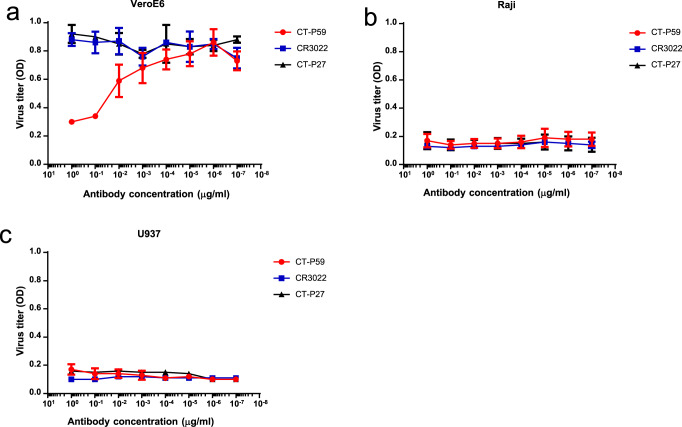
Vaccines and therapeutics are urgently needed for the pandemic caused by severe acute respiratory syndrome coronavirus 2 (SARS-CoV-2). Here, we screen human monoclonal antibodies (mAb) targeting the receptor binding domain (RBD) of the viral spike protein via antibody library constructed from peripheral blood mononuclear cells of a convalescent patient. The CT-P59 mAb potently neutralizes SARS-CoV-2 isolates including the D614G variant without antibody-dependent enhancement effect. Complex crystal structure of CT-P59 Fab/RBD shows that CT-P59 blocks interaction regions of RBD for angiotensin converting enzyme 2 (ACE2) receptor with an orientation that is notably different from previously reported RBD-targeting mAbs. Furthermore, therapeutic effects of CT-P59 are evaluated in three animal models (ferret, hamster, and rhesus monkey), demonstrating a substantial reduction in viral titer along with alleviation of clinical symptoms. Therefore, CT-P59 may be a promising therapeutic candidate for COVID-19.


Conflict of interest statement

Patents have been filed for CT-P59. C.K., D.K.R., J.L., J.M.S., M.K., J.I.K., P.K., J.S.B., E.Y.S., M.S.L., M.S.K., H.N., G.S.P., J.S.P., D.S., Y.A., J.N.L., K.S.K., and S.Y.L. are employees of Celltrion, Inc. This work was funded by Celltrion, Inc. and several grants listed in Acknowledgements. The remaining authors declare no competing interests.

Figures

Fig. 1
Fig. 1. CT-P59 can effectively neutralize SARS-CoV-2 in vitro by blocking RBD-ACE2 binding.
a Serial twofold-diluted CT-P59 were incubated with SARS-CoV-2 live viruses; wild type (blue) and D614G (red). The mixture was added to VeroE6 cells. After 2–3 days of incubation, the neutralization activity was evaluated by counting plaques. Two independent experiments were performed in duplicate. b SARS-CoV-2 RBD immobilized on biosensor was saturated with CT-P59. Then, CT-P59 flowed over the biosensor surface in the presence (red) or absence (blue) of the ACE2 receptor. As a positive control, the buffer was loaded onto SARS-CoV-2 RBD immobilized biosensor, and ACE2 flowed over the biosensor surface (black).
Fig. 2
Fig. 2. The structure of CT-P59 Fab in complex with SARS-CoV-2 RBD.
a The overall structure of the CT-P59 Fab/SARS-CoV-2 RBD complex. The RBD domain is green for the core subdomain, and orange for RBM. The heavy and light chains of CT-P59 are magenta and yellow, respectively. b Superposition of the neutralizing antibodies in complex with RBD. RBD is shown as a surface model. CT-P59 is shown as a cartoon, and the other antibodies (CR3022: PDB 6XC3, PB2-2F6: PDB 7BWJ, REGN10933: PDB 6XDG) are shown as a ribbon model. The heavy and light chains of Fab are magenta and yellow, respectively. c Assignment of the epitope residues for RBD-targeting neutralizing antibodies with a distance cutoff of 4.5 Å. RBD residues interacting with ACE2 are highlighted in red. d The detailed interactions between the RBD and CDR loops of CT-P59. The interfaces between RBD and CDR H1/2 or H3 are shown in the top and bottom panels, respectively. The RBD domain is shown as a surface model with a semi-transparent representation. The CDR loops and interacting residues on the interfaces are shown in ribbons and sticks, respectively. The residues are colored as in a. Dashed lines indicate hydrogen bonds. Water molecules are shown as red spheres.
Fig. 3
Fig. 3. In vivo efficacy of CT-P59 in the upper respiratory tract in an animal model.
Female ferrets (n = 6/group), and rhesus monkeys (three control; two 45 mg/kg; three 90 mg/kg) were challenged with 105.8 TCID50/ml and 106.4 TCID50 of SARS-CoV-2, respectively. Control (ferrets: 30 mg/kg of human IgG isotype and rhesus monkeys: vehicle) and CT-P59 (ferrets: 3, and 30 mg/kg, rhesus monkeys: 45, and 90 mg/kg) were administered intravenously after 24 h of virus inoculation, respectively. To compare the efficacy of CT-P59, remdesivir (18 mg/kg per ferret) was administered daily via oral gavage after 24 h of virus inoculation in ferrets for 5 days. To detect viral load in the upper respiratory tract, nasal wash specimens were collected from ferrets at 2, 4, and 6 dpi, and nose and throat swab specimens from monkeys were collected daily up to 6 dpi. Virus titers (TCID50) were measured in nasal wash/swab and throat swabs specimens from each group of (a) ferrets and, c, d rhesus monkeys. The viral RNA copy numbers were measured in nasal washes from (b) ferrets. Viral titers and RNA copy numbers are shown as mean values + /− SEM and titers below the limit of detection are shown as 0.8 log10TCID50/ml or 0.3 log10 viral RNA copies/ml (dashed lines). The asterisks and daggers indicate significance between the control and each group as determined by two-way ANOVA and subsequent Dunnett’s test. *P = 0.0001 and **P < 0.0001 (a); *P = 0.0456, **P = 0.0035, ***P = 0.0001, ****P < 0.0001, and P = 0.0005 (b); *P = 0.0079 and **P < 0.0001 (c); and *P = 0.0021 (d).
Fig. 4
Fig. 4. Virus titration and quantitation in the lower respiratory tract of animal models.
Three ferrets per group were euthanized at 3 and 7 dpi, and lungs were collected to measure viral titers (a) and the number of viral RNA copies (d). Golden Syrian hamsters (n = 12/group) were challenged intranasally with 6.4 × 104 PFU/80 μL of SARS-CoV-2. Vehicle and 15, 30, 60, and 90 mg/kg of CT-P59 were intraperitoneally administered 24 h after virus inoculation. Four animals were euthanized for virus titration (b) and quantitation of viral RNA copies (e) from each group at 3 and 5 dpi. Rhesus monkeys (control n = 3, 45 mg/kg n = 2, 90 mg/kg n = 3) were infected with 106.4 TCID50/ml of SARS-CoV-2 via in a combination of intranasal (0.5 ml), intratracheal (4 ml), ocular (0.25 ml/eye), and oral (1 ml) routes. Vehicle, 45 mg/kg and 90 mg/kg of CT-P59 were administered intravenously after 24 h of virus infection. All rhesus monkeys were euthanized at 6 dpi, and lungs were collected to measure viral titers (c) and the number of viral RNA copies (f). Viral titers in the lung were determined by TCID50 assessment in Vero cells and viral RNA copy number measurement using qRT-PCR. Viral titers and RNA copy numbers are shown as mean value + /− SEM and titers below the limit of detection are shown as 0.8 log10TCID50/ml or 0.3 log10 viral RNA copies/ml (dashed lines). Asterisks indicate statistical significance between the control and each group as determined by two-way ANOVA and subsequent Dunnett’s test. *P = 0.0309, **P = 0.0131, and ***P < 0.0001 (a); *P = 0.0002 and **P < 0.0001 (b); *P = 0.0329 (d); and *P = 0.0123, **P = 0.0025, ***P = 0.0003, and ****P = 0.0002 (e).
Fig. 5
Fig. 5. No evidence of ADE caused by CT-P59 bound to SARS-CoV-2 in permissive cells and Fc receptor (FcR)-bearing cells.
a FcR-independent ADE. SARS-CoV-2 was mixed with a wide range of antibodies; CT-P59 (red circle), CR3022 (blue square), and CT-P27 (black triangle). VeroE6 was infected with a virus–antibody complex. The virus titers were determined by optical density (OD) using an anti-nucleocapsid antibody. b FcγR II-dependent ADE. In vitro ADE assay was performed as described in (a) except Raji cells. c FcγR I&II-dependent ADE. In vitro ADE assay was carried out as described in (a), except U937 cells. The experiments were performed in triplicates (CR3022 and CT-P27) or in quadruplicates (CT-P59). Average and standard deviation of virus titers are depicted as dot and error bar, respectively.

References

    1. Shen C, et al. Treatment of 5 critically ill patients with COVID-19 with convalescent plasma. J. Am. Med. Assoc. 2020;323:1582–1589. doi: 10.1001/jama.2020.4783. - DOI - PMC - PubMed
    1. Li L, et al. Effect of convalescent plasma therapy on time to clinical improvement in patients with severe and life-threatening COVID-19: a randomized clinical trial. J. Am. Med. Assoc. 2020;324:460–470. doi: 10.1001/jama.2020.10044. - DOI - PMC - PubMed
    1. Salazar E, et al. Treatment of coronavirus disease 2019 (COVID-19) patients with convalescent plasma. Am. J. Pathol. 2020;190:1680–1690. doi: 10.1016/j.ajpath.2020.05.014. - DOI - PMC - PubMed
    1. Li F, Li W, Farzan M, Harrison SC. Structure of SARS coronavirus spike receptor-binding domain complexed with receptor. Science. 2005;309:1864–1868. doi: 10.1126/science.1116480. - DOI - PubMed
    1. Li F. Structure, Function, and evolution of coronavirus spike. Proteins Annu. Rev. Virol. 2016;3:237–261. doi: 10.1146/annurev-virology-110615-042301. - DOI - PMC - PubMed

Publication types

MeSH terms