. 2021 Jan 12;12(1):293.
doi: 10.1038/s41467-020-20524-2.

The molecular make up of smoldering myeloma highlights the evolutionary pathways leading to multiple myeloma

Affiliations

The molecular make up of smoldering myeloma highlights the evolutionary pathways leading to multiple myeloma

Eileen M Boyle et al. Nat Commun. .

Abstract

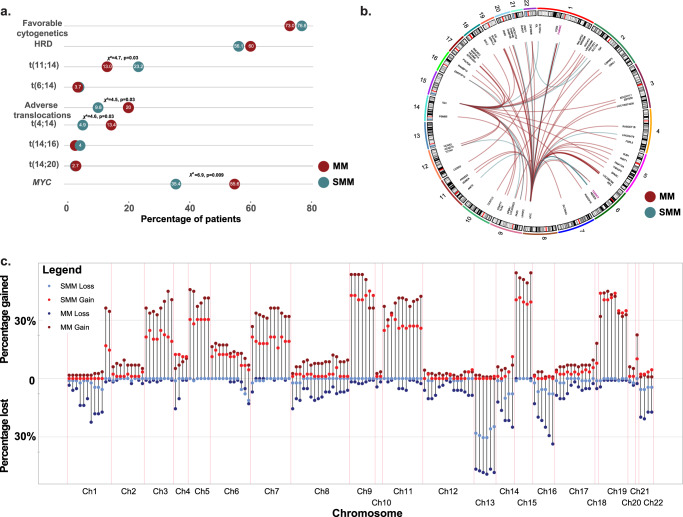
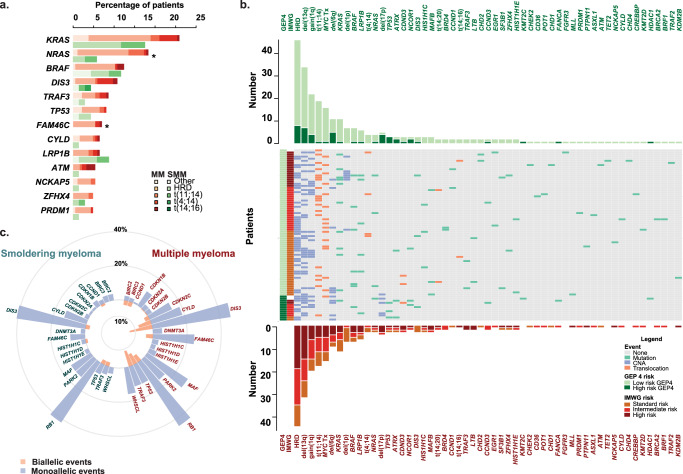
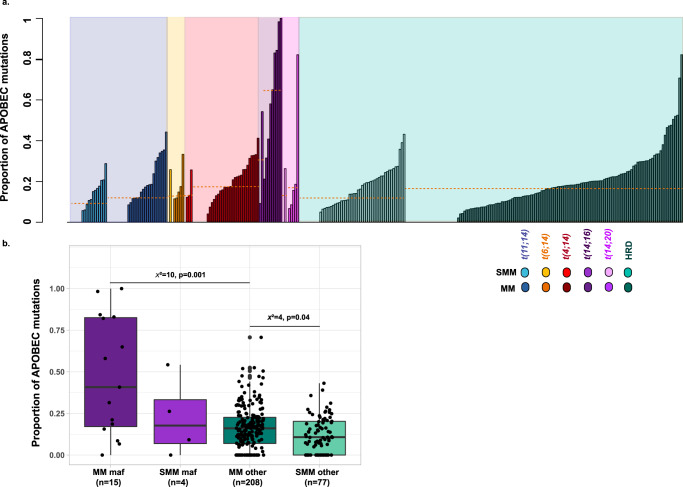
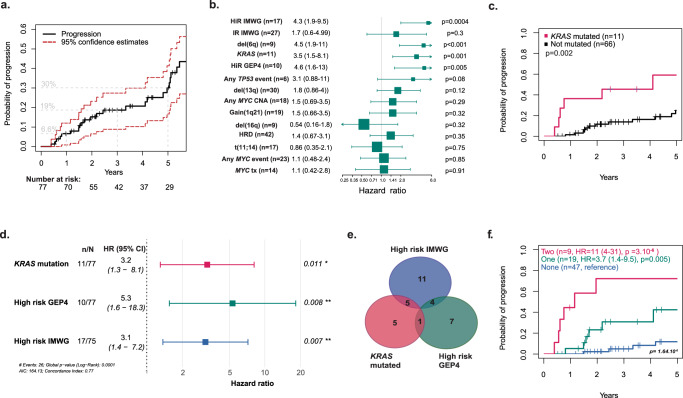
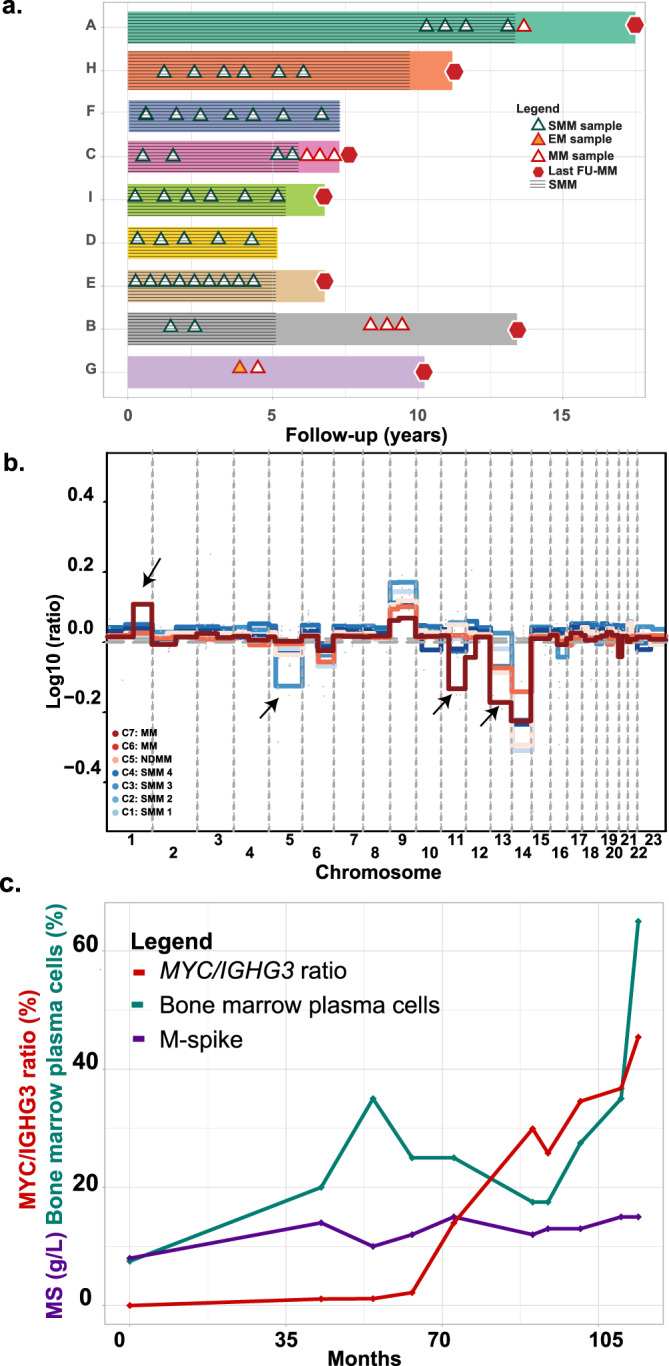
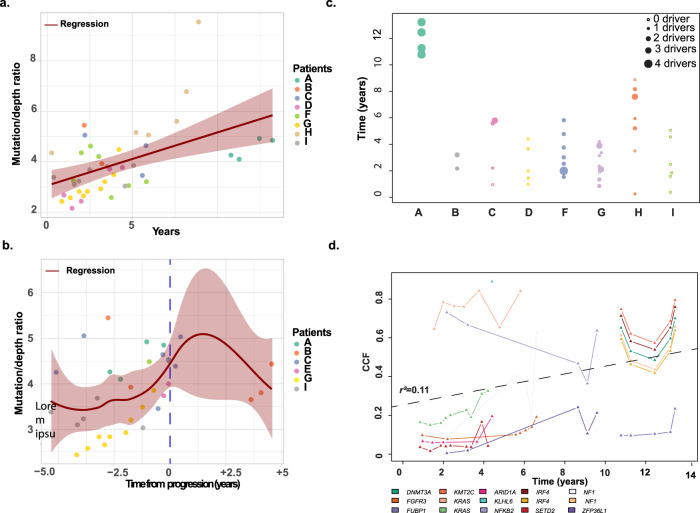
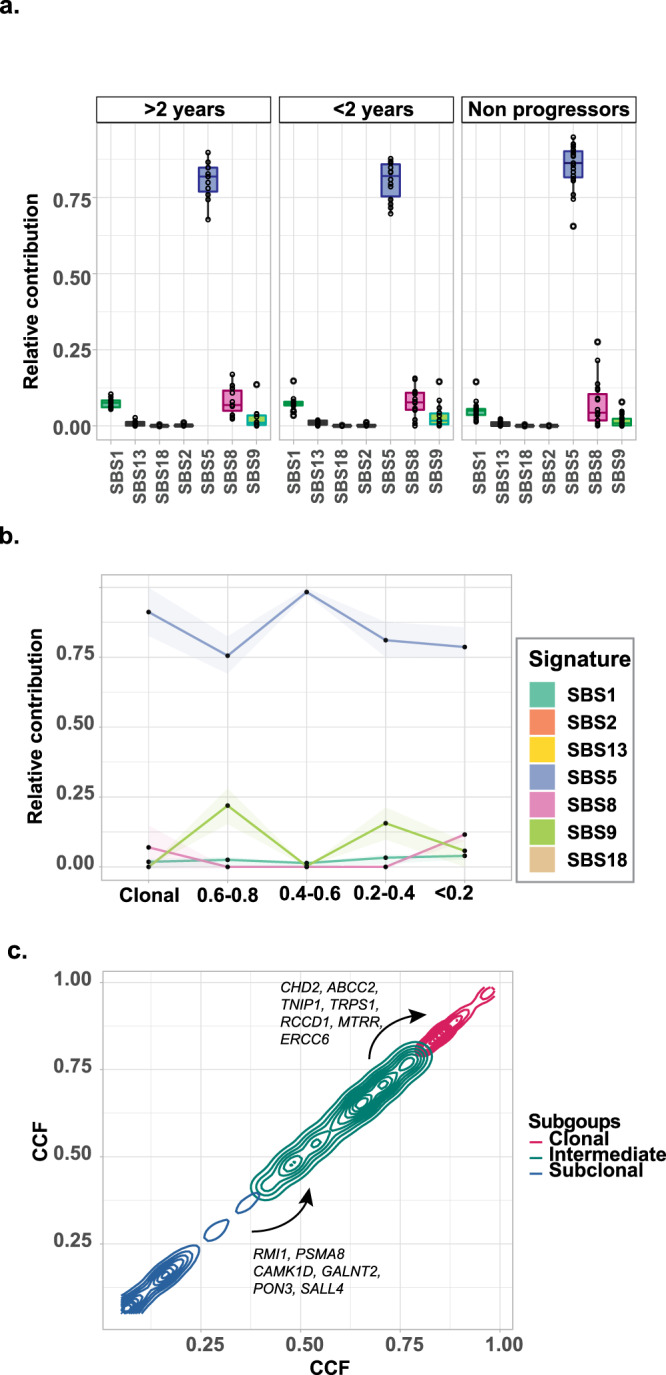
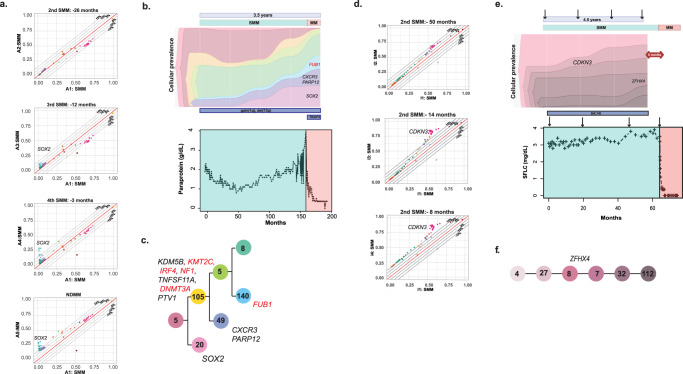
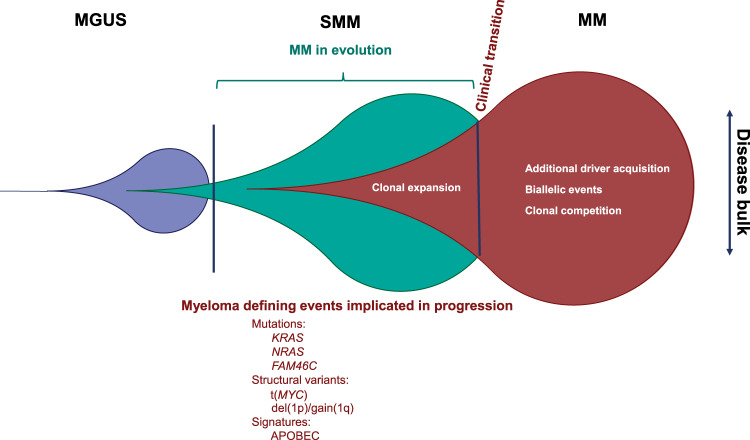
Smoldering myeloma (SMM) is associated with a high-risk of progression to myeloma (MM). We report the results of a study of 82 patients with both targeted sequencing that included a capture of the immunoglobulin and MYC regions. By comparing these results to newly diagnosed myeloma (MM) we show fewer NRAS and FAM46C mutations together with fewer adverse translocations, del(1p), del(14q), del(16q), and del(17p) in SMM consistent with their role as drivers of the transition to MM. KRAS mutations are associated with a shorter time to progression (HR 3.5 (1.5-8.1), p = 0.001). In an analysis of change in clonal structure over time we studied 53 samples from nine patients at multiple time points. Branching evolutionary patterns, novel mutations, biallelic hits in crucial tumour suppressor genes, and segmental copy number changes are key mechanisms underlying the transition to MM, which can precede progression and be used to guide early intervention strategies.


Conflict of interest statement

E.M.B. discloses lecture fees from Janssen, Abbvie, and Celgene; discloses travel fees from Amgen, and Celgene; none in relation to this paper. The remaining authors declare no competing interests.

Figures

Fig. 1
Fig. 1. Structural events in smoldering multiple myeloma (SMM) compared to newly diagnosed myeloma (MM).
a Frequency of cytogenetic subgroups and main translocations in SMM and MM suggesting that fewer SMM have high-risk features. b Circos plot of the landscape of non-Ig-MYC and non-canonical Ig translocations highlighting FAM46C and TXNDC5 as current recurrent partners. c Copy-number changes in 160 recurrently altered regions covering the known drivers (Supplemental Table 4) in SMM and MM suggesting the landscape is similar but there are fewer copy-number abnormalities. Adverse translocations = t(4;14), t(14;16), t(14;20). Favorable cytogenetics = t(11;14), HRD.
Fig. 2
Fig. 2. Mutational events in smoldering myeloma in comparison to myeloma.
a The most frequently mutated genes and their distribution across the most common molecular subgroups. b The distribution of somatic abnormalities per sample and risk group. c Frequency of biallelic and monoallelic events per driver locus in SMM and MM showing fewer biallelic drivers in SMM. *Significantly different at p < 0.05 level, two-sided Fisher’s test.
Fig. 3
Fig. 3. Contribution of APOBEC signatures to the mutational landscape of SMM and MM.
a Contribution of the APOBEC signature in SMM and MM by cytogenetic subgroup (yellow lines = median). b Contribution of the APOBEC signature in SMM and MM in maf and non-maf samples. Boxplots representing second quartile, median, third quartile, whiskers representing first, and fourth quartile. All data points including outliers are represented. X2= chi-squared, two-sided p-value derived from Kruskal–Wallis test, n = number of patients.
Fig. 4
Fig. 4. Prognostic impact of molecular and clinical features in SMM.
a Progression-free survival with a 30% progression rate at 5 years with no plateau, suggesting an ongoing risk. b Univariate analysis of molecular features in SMM. c Impact of KRAS mutations on the outcome. d Multivariate analysis suggests GEP4, high-risk IMWG, and KRAS mutations are independent prognostic factors. e Venn diagram showing the overlap between high-risk GEP4, high-risk IMWG, and KRAS mutations. f Progression-free survival for patients with either none, one, or two adverse factors defined as high-risk GEP4, high-risk IMWG, and KRAS mutations suggesting these factors are additive. IMWG International Myeloma Working Group, HiR high-risk, IR intermediate risk, HRD hyperdiploid, CNA copy-number abnormality, tx translocation, GEP4 4 gene expression profile, n number of patients with event, N total number of patients evaluable, error bars = 95% CI.
Fig. 5
Fig. 5. Acquisition of drivers in SMM patients over time.
a Swimmer plot of the group of patients (A–G) followed over time. The color bars represent progression-free survival. b Plot showing changes in copy number over time with a focus on the loss of del(5) and the acquisition of gain(1q), del(11q), and del(13). Arrows highlight changes in CNA. c The acquisition of a t(8;14) within a myeloma propagating cell leads to outgrowth of the clone until it dominates the tumor population. EM early myeloma, FU follow-up, NDMM newly diagnosed myeloma, NGS next-generation sequencing, MS M-spike.
Fig. 6
Fig. 6. Mutational changes over time.
a The mutation rate of patients increased over time. b Progression rate among progressors suggesting that the mutation rate is high at the SMM stage around progression. c Evolution of the number of mutational drivers per sample over time suggesting fluctuation but no steady increase. d Evolution of the CCF of each driver mutations over time. Error bands = 95% CI.
Fig. 7
Fig. 7. Mutational signatures.
Mutational signatures. a The mutational signature composition does not differ between patients that progress more or less than 2 years after the sample was taken and those who do not progress. Boxplots representing second quartile, median, third quartile, whiskers representing first, and fourth quartile. All data points including outliers are represented. b The contribution of mutational signatures did not vary substantially according to clonality. c The CCF of genes increased overtime suggesting they may be drivers. HRD hyperdiploid, nHRD non-hyperdiploid, SBS single base substitution, CCF cancer clonal fraction. Error bands = 95% CI.
Fig. 8
Fig. 8. Genomic evolution of samples from Patient A and I.
a CCF plot of patient A showing the emergence of a SOX2 cluster before progression. Patient and sample number indicated on axis. The dotted lines represent the % of the difference in CCF from the angle bisector line, which represents perfect identity between the samples Each color represents one cluster of mutations. b Fish-plot summarizing the clonal evolution in parallel to the paraprotein evolution in patient A. c Phylogeny tree showing branching evolution of patient A. Colors correspond to Fish-plot. Numbers represent the number of additional mutations in each clone CCF = cancer clonal fraction. d CCF plot showing the emergence of a CDKN3 cluster before progression in patient I. Patient and sample number indicated on axis. e Fish-plot summarizing the clonal evolution in parallel to the paraprotein evolution in patient I. f Phylogeny tree showing linear evolution in patient I. Colors correspond to Fish-plot. Numbers represent the number of additional mutations in each clone CCF = cancer clonal fraction.
Fig. 9
Fig. 9. The distinct molecular effectors at play in the progression from SMM to MM.
SMM progresses to MM after acquiring a series of secondary events such as key mutations, structural events, biallelic events, or APOBEC signatures that drive progression.

References

    1. Rajkumar SV, Larson D, Kyle RA. Diagnosis of Smoldering Multiple Myeloma. N. Engl. J. Med. 2011;365:474–475. doi: 10.1056/NEJMc1106428. - DOI - PMC - PubMed
    1. Larsen JT, et al. Serum free light chain ratio as a biomarker for high-risk smoldering multiple myeloma. Leukemia. 2013;27:941–946. doi: 10.1038/leu.2012.296. - DOI - PMC - PubMed
    1. Hillengass J, et al. Prognostic significance of focal lesions in whole-body magnetic resonance imaging in patients with asymptomatic multiple myeloma. J. Clin. Oncol. 2010;28:1606–1610. doi: 10.1200/JCO.2009.25.5356. - DOI - PubMed
    1. Landgren O. Shall we treat smoldering multiple myeloma in the near future? Hematol. Am. Soc. Hematol. Educ. Program. 2017;2017:194–204. doi: 10.1182/asheducation-2017.1.194. - DOI - PMC - PubMed
    1. International Myeloma Working Group. Criteria for the classification of monoclonal gammopathies, multiple myeloma and related disorders: a report of the International Myeloma Working Group. Br. J. Haematol. 2003;121:749–757. doi: 10.1046/j.1365-2141.2003.04355.x. - DOI - PubMed

Publication types

MeSH terms