

Inferring high-resolution human mixing patterns for disease modeling
- PMID: 33436609
- PMCID: PMC7803761
- DOI: 10.1038/s41467-020-20544-y
Inferring high-resolution human mixing patterns for disease modeling
Abstract
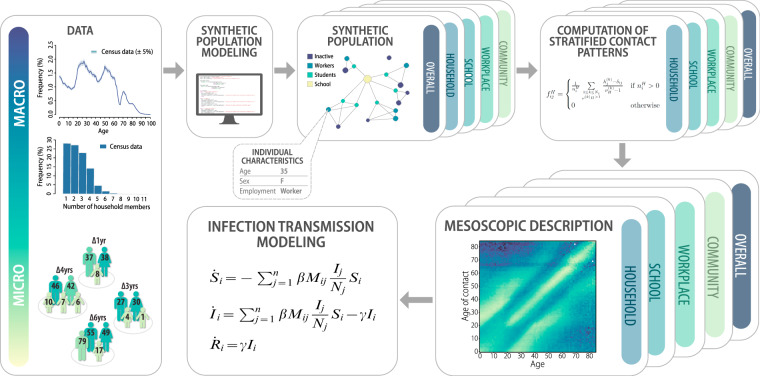
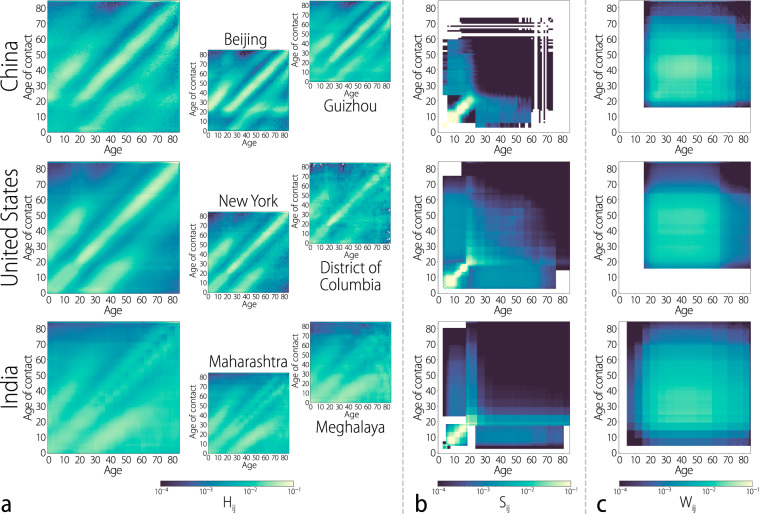
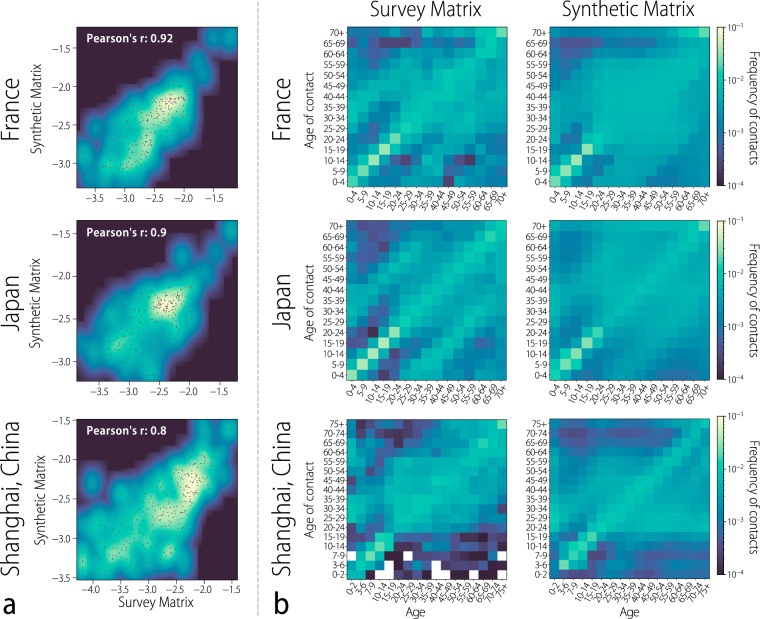
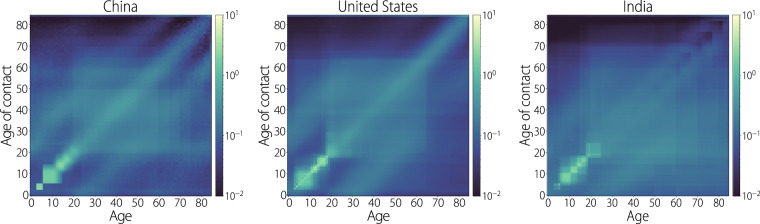
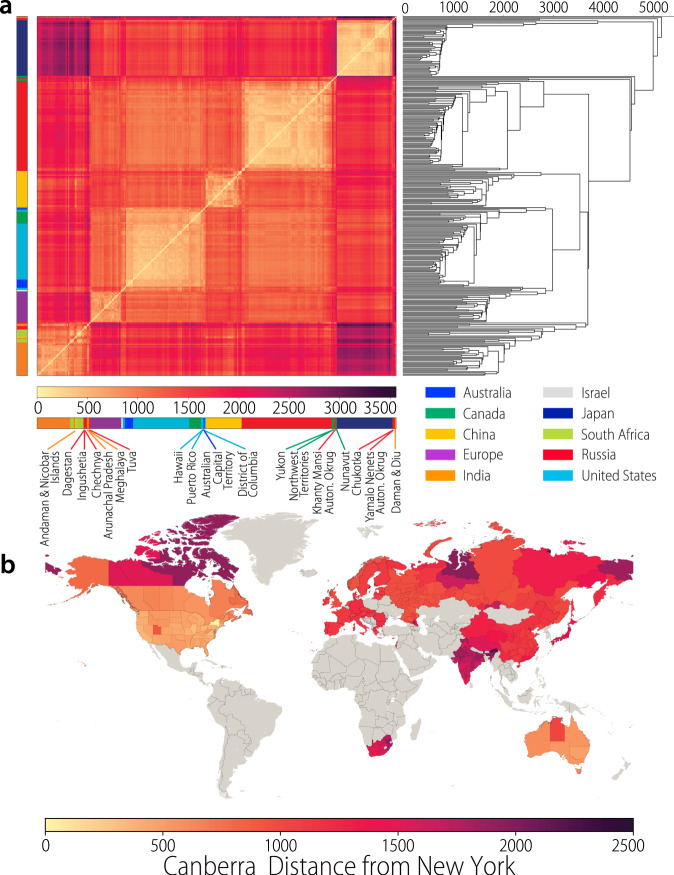
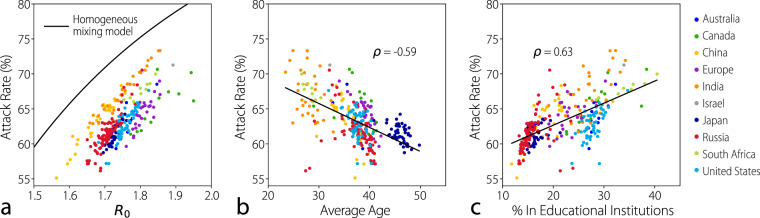
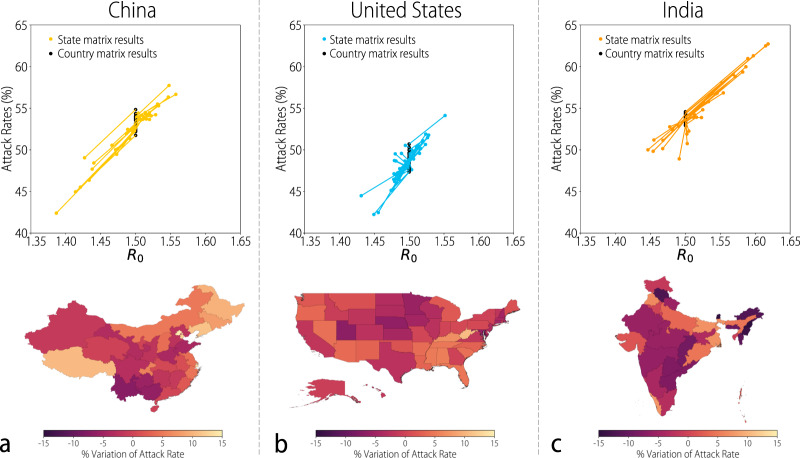
Mathematical and computational modeling approaches are increasingly used as quantitative tools in the analysis and forecasting of infectious disease epidemics. The growing need for realism in addressing complex public health questions is, however, calling for accurate models of the human contact patterns that govern the disease transmission processes. Here we present a data-driven approach to generate effective population-level contact matrices by using highly detailed macro (census) and micro (survey) data on key socio-demographic features. We produce age-stratified contact matrices for 35 countries, including 277 sub-national administratvie regions of 8 of those countries, covering approximately 3.5 billion people and reflecting the high degree of cultural and societal diversity of the focus countries. We use the derived contact matrices to model the spread of airborne infectious diseases and show that sub-national heterogeneities in human mixing patterns have a marked impact on epidemic indicators such as the reproduction number and overall attack rate of epidemics of the same etiology. The contact patterns derived here are made publicly available as a modeling tool to study the impact of socio-economic differences and demographic heterogeneities across populations on the epidemiology of infectious diseases.
Conflict of interest statement
A.P.y.P., M.C., and A.V. report grants from Metabiota Inc and M.A. reports research funding from Seqirus, outside the submitted work. The remaining authors declare no competing interests.
Figures
Similar articles
-
Estimating contact patterns relevant to the spread of infectious diseases in Russia.J Theor Biol. 2017 Apr 21;419:1-7. doi: 10.1016/j.jtbi.2017.01.041. Epub 2017 Feb 1. J Theor Biol. 2017. PMID: 28161415
-
Projecting social contact matrices in 152 countries using contact surveys and demographic data.PLoS Comput Biol. 2017 Sep 12;13(9):e1005697. doi: 10.1371/journal.pcbi.1005697. eCollection 2017 Sep. PLoS Comput Biol. 2017. PMID: 28898249 Free PMC article.
-
Inferring the structure of social contacts from demographic data in the analysis of infectious diseases spread.PLoS Comput Biol. 2012;8(9):e1002673. doi: 10.1371/journal.pcbi.1002673. Epub 2012 Sep 13. PLoS Comput Biol. 2012. PMID: 23028275 Free PMC article.
-
The GLEaMviz computational tool, a publicly available software to explore realistic epidemic spreading scenarios at the global scale.BMC Infect Dis. 2011 Feb 2;11:37. doi: 10.1186/1471-2334-11-37. BMC Infect Dis. 2011. PMID: 21288355 Free PMC article. Review.
-
Fogarty International Center collaborative networks in infectious disease modeling: Lessons learnt in research and capacity building.Epidemics. 2019 Mar;26:116-127. doi: 10.1016/j.epidem.2018.10.004. Epub 2018 Oct 23. Epidemics. 2019. PMID: 30446431 Free PMC article. Review.
Cited by
-
The mathematics of multiple lockdowns.Sci Rep. 2021 Apr 13;11(1):8078. doi: 10.1038/s41598-021-87556-6. Sci Rep. 2021. PMID: 33850217 Free PMC article.
-
Real-time estimation of the effective reproduction number of COVID-19 from behavioral data.Sci Rep. 2023 Dec 5;13(1):21452. doi: 10.1038/s41598-023-46418-z. Sci Rep. 2023. PMID: 38052841 Free PMC article.
-
Modeling comparative cost-effectiveness of SARS-CoV-2 vaccine dose fractionation in India.Nat Med. 2022 May;28(5):934-938. doi: 10.1038/s41591-022-01736-z. Epub 2022 Feb 24. Nat Med. 2022. PMID: 35210596 Free PMC article.
-
Estimating the Impact of Statewide Policies to Reduce Spread of Severe Acute Respiratory Syndrome Coronavirus 2 in Real Time, Colorado, USA.Emerg Infect Dis. 2021 Sep;27(9):2312-2322. doi: 10.3201/eid2709.204167. Epub 2021 Jun 30. Emerg Infect Dis. 2021. PMID: 34193334 Free PMC article.
-
Assessing the impact of revising MenACWY vaccination schedule for adolescents in the United States: a modelling study.Lancet Reg Health Am. 2025 Feb 19;44:101033. doi: 10.1016/j.lana.2025.101033. eCollection 2025 Apr. Lancet Reg Health Am. 2025. PMID: 40046840 Free PMC article.
References
-
- Anderson RM, May RM. Infectious Diseases of Humans: Dynamics and Control. Oxford, UK: Oxford University Press; 1991.
Publication types
MeSH terms
Grants and funding
LinkOut - more resources
Full Text Sources
Other Literature Sources
Medical
