Clinical Trial
. 2021 Jan 12;12(1):304.
doi: 10.1038/s41467-020-20556-8.

Deep muscle-proteomic analysis of freeze-dried human muscle biopsies reveals fiber type-specific adaptations to exercise training

Affiliations
Clinical Trial

Deep muscle-proteomic analysis of freeze-dried human muscle biopsies reveals fiber type-specific adaptations to exercise training

A S Deshmukh et al. Nat Commun. .

Erratum in

Abstract

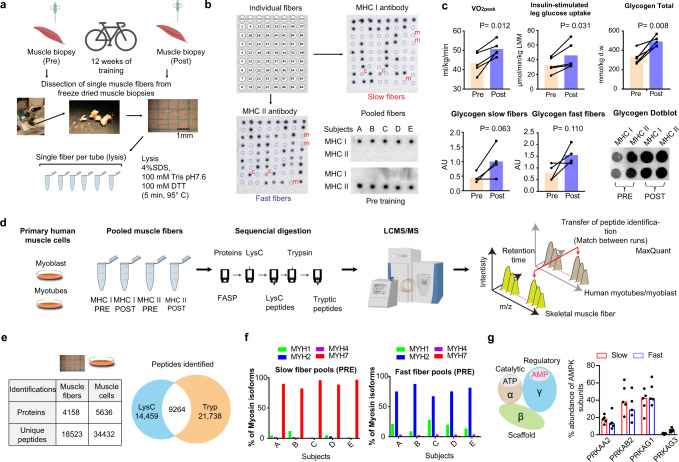
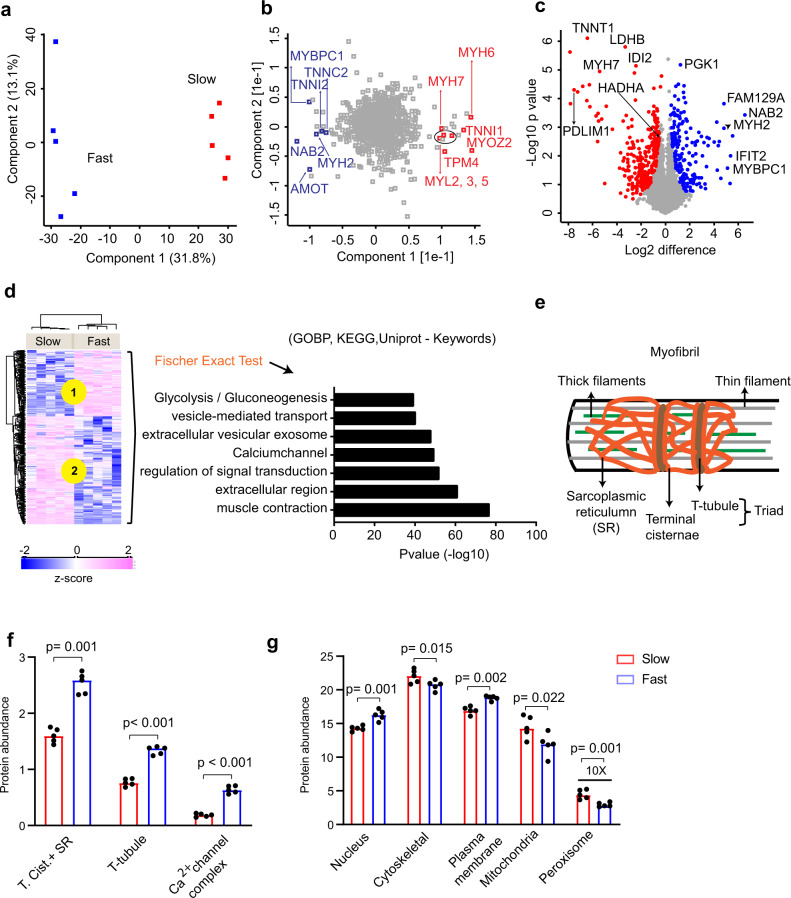
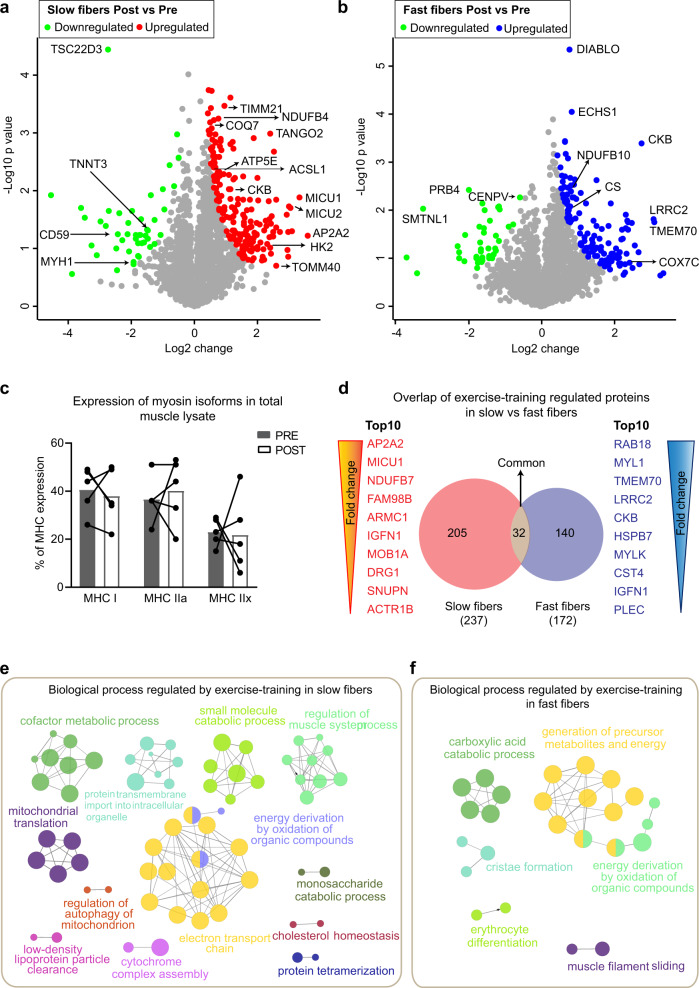
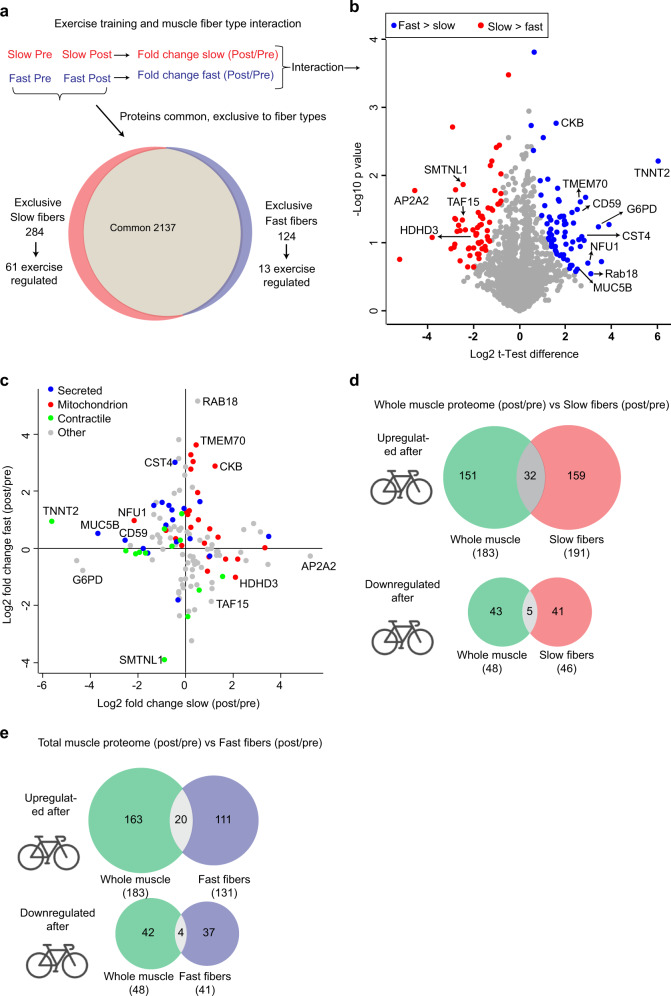
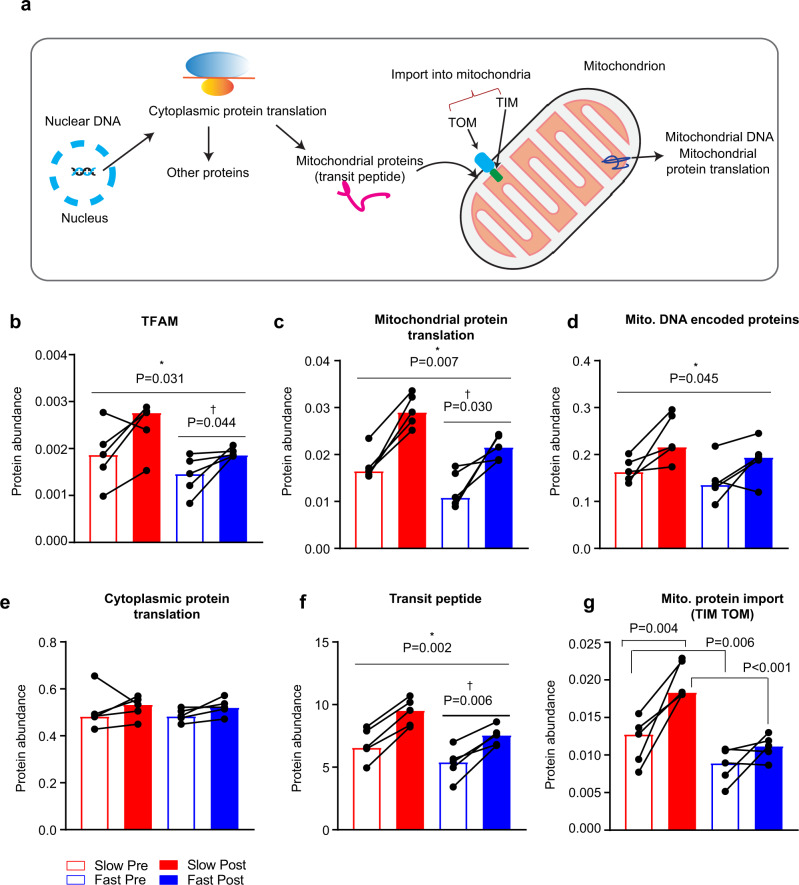
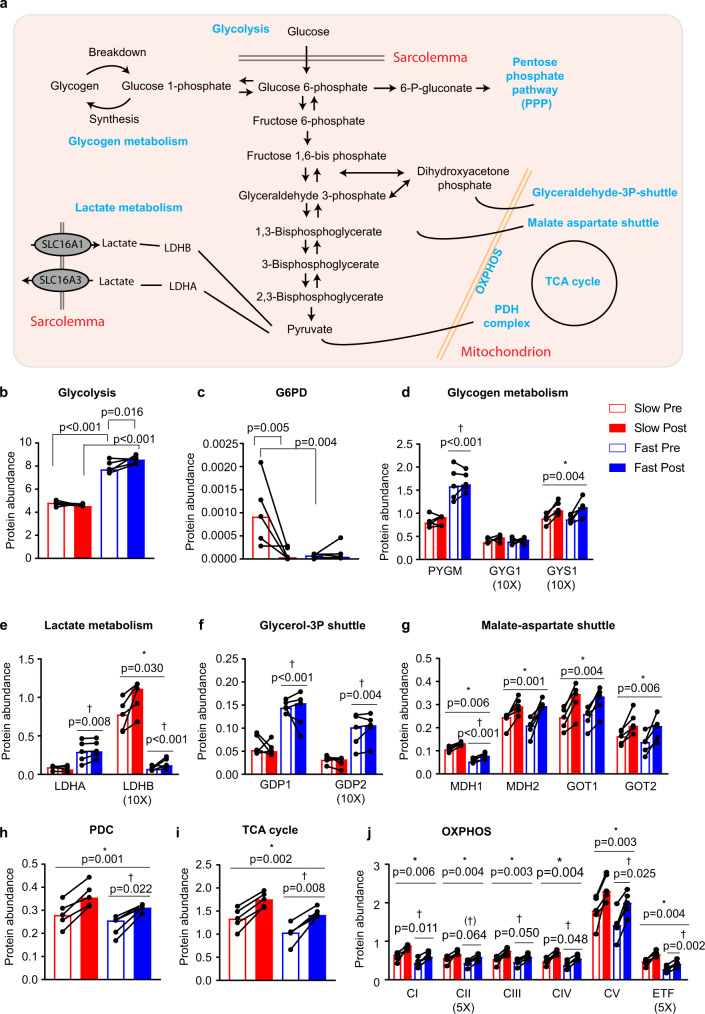
Skeletal muscle conveys several of the health-promoting effects of exercise; yet the underlying mechanisms are not fully elucidated. Studying skeletal muscle is challenging due to its different fiber types and the presence of non-muscle cells. This can be circumvented by isolation of single muscle fibers. Here, we develop a workflow enabling proteomics analysis of pools of isolated muscle fibers from freeze-dried human muscle biopsies. We identify more than 4000 proteins in slow- and fast-twitch muscle fibers. Exercise training alters expression of 237 and 172 proteins in slow- and fast-twitch muscle fibers, respectively. Interestingly, expression levels of secreted proteins and proteins involved in transcription, mitochondrial metabolism, Ca2+ signaling, and fat and glucose metabolism adapts to training in a fiber type-specific manner. Our data provide a resource to elucidate molecular mechanisms underlying muscle function and health, and our workflow allows fiber type-specific proteomic analyses of snap-frozen non-embedded human muscle biopsies.


Conflict of interest statement

The authors declare no competing interests.

Figures

Fig. 1
Fig. 1. Workflow for isolation of muscle fibers and proteomic analysis.
a Single fibers were dissected from freeze-dried muscle biopsies before and after exercise training and fibers were dissolved in lysis buffer. b Fiber-type determination by dot-blotting. Top left: loading scheme of two identical membranes incubated in either MHC I (top right) or MHC II antibody (bottom left). m =  missing fibers, not recognized by MHC I or II antibody; c = contaminated fibers (or hybrid fibers) were discarded. Fibers were pooled according to fiber type and the pools were validated by dot-blotting (bottom right). c Peak rate of oxygen consumption (VO2peak) and insulin-stimulated leg glucose uptake (mean last 40 min of a 120 min insulin clamp) before (PRE) and after (POST) training. LLM lean leg mass. Glycogen content in whole-muscle homogenate (total) (n = 5) and in slow- and fast-twitch fiber pools (n = 4). AU arbitrary units, d.w. dry weight. d Proteomic analysis of purified muscle fibers and primary human muscle cells. Protein digestion by LysC and trypsin followed by optimized LC-MS/MS and computational analysis using MaxQuant with the “match between runs” feature. e Number of proteins and unique peptides identified in muscle fibers and cells and Venn diagram displaying number of common and unique peptides to LysC and trypsin fraction. f Unique peptide-based abundance of MHC isoforms in fiber pools PRE training (n = 5). g Unique peptide-based abundance of AMPK subunits (n = 5). Data in Fig. 1c are shown as means. P values by two-tailed paired t-test are indicated in Fig. 1c.
Fig. 2
Fig. 2. Quantitative proteome differences between slow- and fast-twitch muscle fibers.
a Principal component analysis (PCA) separating slow- and fast-twitch fibers in two groups. b PCA loading displaying selected examples of the most abundant proteins. c Volcano plot comparing protein abundance in slow- and fast-twitch muscle fibers. Differently regulated proteins (significance score ≤0.05; paired linear model with Xiao correction) are marked in blue (high in fast-twitch fiber) and red (high in slow-twitch fiber). d Hierarchical clustering of significantly different proteins (left) and Fischer exact test for enrichment analysis of significantly different proteins (right). e Graphical representation of a myofibril. f Comparative protein abundance of Terminal cisternae, sarcoplasmic reticulum (SR), T-tubule, and Ca2+ channel complex in slow- and fast-twitch fibers. g Major organelle protein composition in slow- and fast-twitch muscle fibers. Data in f, g are shown as median. P values by two-tailed paired t-test are indicated in f, g.
Fig. 3
Fig. 3. Proteomic responses of slow- and fast-twitch muscle fibers to exercise training.
a Volcano plot comparing protein abundance in slow- muscle fibers after exercise training. Differently regulated proteins (significance score ≤0.05; paired linear model with Xiao correction) are marked in red (high after exercise training) and green (low after exercise training). b Volcano plot comparing protein abundance in fast-twitch muscle fibers after exercise training. Differently regulated proteins (significance score ≤0.05; paired linear model with Xiao correction) are marked in blue (high after exercise training) and green (low after exercise training). c MHC composition in whole-muscle lysate PRE and POST training (n = 5). d Overlap of significantly different proteins between slow- and fast-twitch fibers. ClueGO-enriched network of exercise training-regulated proteins in slow- (e) and fast-twitch (f) fibers. The network represents clusters of related Gene Ontology terms enriched as nodes and connected if they annotate common proteins. For visualization purposes, clusters are labeled with the most informative term; node size represents the term enrichment significance and nodes.
Fig. 4
Fig. 4. Slow- and fast-twitch muscle fibers adapt differentially to exercise training.
a Diagram displaying proteins that are commonly and exclusively expressed in slow- and fast-twitch muscle fibers + the number of exercise training-regulated proteins in the exclusive population. b Volcano plot comparing fold change (POST vs. PRE) between slow- and fast-twitch muscle fibers. Differently regulated proteins (significance score ≤0.05; paired linear model with Xiao correction) are marked in blue (change in fast > slow-twitch fibers) and red (change in slow > fast-twitch fibers). c Scatter plot comparing differences in the log2-changes (POST vs. PRE) between slow- and fast-twitch fibers. The graph includes 131 fiber-type-specific (interaction) significant proteins with examples of few protein categories. d Overlap of exercise training-regulated proteins between whole-muscle lysate and slow-twitch muscle fibers. e Overlap of exercise training-regulated proteins between whole-muscle lysate and fast-twitch muscle fibers.
Fig. 5
Fig. 5. Fiber-type-specific effects of exercise training on capacity to increase mitochondrial content.
a Schematic representation of the steps involved in increasing mitochondrial content. b Percentage protein abundance of TFAM, c proteins involved in mitochondrial protein translation, d mitochondrial DNA-encoded proteins, e proteins involved in cytoplasmic protein translation, f transit peptide-associated proteins, g TIM TOM subunits. Data are shown as median (n = 5). P values by two-way RM ANOVA followed by Tukey’s post hoc test are indicated in Fig. 5b–g. “*” denotes a training effect and “†” denotes a difference between fiber types. Lines indicate main effects.
Fig. 6
Fig. 6. Fiber-type-specific regulation of glucose metabolism in response to exercise training.
a Schematic representation of glucose metabolism in skeletal muscle. b Percentage protein abundance of glycolytic enzymes, c glucose-6-phosphate dehydrogenase, d enzymes involved in glycogen metabolism, e lactic acid metabolism, f glycerol-3P shuttle, g malate-aspartate shuttle, h pyruvate dehydrogenase complex, i TCA cycle, and j OXPHOS (n = 5). P values by two-way RM ANOVA followed by Tukey’s post hoc test are indicated in Fig. 6b–j. “*” denotes a training effect and “†” denotes a difference between fiber types. Lines indicate main effects. 5× and 10× = multiplied by 5 and 10, respectively.

Similar articles

Cited by

References

    1. Saltin B, et al. Physical training and glucose tolerance in middle-aged men with chemical diabetes. Diabetes. 1979;28:30–32. - PubMed
    1. Dela F, et al. Insulin-stimulated muscle glucose clearance in patients with NIDDM: effects of one-legged physical training. Diabetes. 1995;44:1010–1020. - PubMed
    1. Deshmukh AS, et al. Deep proteomics of mouse skeletal muscle enables quantitation of protein isoforms, metabolic pathways, and transcription factors. Mol. Cell. Proteomics. 2015;14:841–853. - PMC - PubMed
    1. Schiaffino S, Reggiani C. Fiber types in mammalian skeletal muscles. Physiol. Rev. 2011;91:1447–1531. - PubMed
    1. Zierath JR, Hawley JA. Skeletal muscle fiber type: influence on contractile and metabolic properties. PLoS Biol. 2004;2:1523–1527. - PMC - PubMed

Publication types