. 2021 Jan 12;12(1):314.
doi: 10.1038/s41467-020-20590-6.

Recurrent network dynamics shape direction selectivity in primary auditory cortex

Affiliations

Recurrent network dynamics shape direction selectivity in primary auditory cortex

Destinee A Aponte et al. Nat Commun. .

Abstract

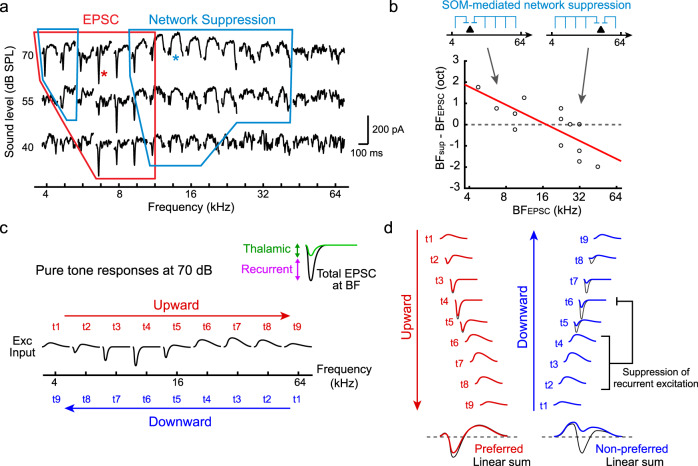
Detecting the direction of frequency modulation (FM) is essential for vocal communication in both animals and humans. Direction-selective firing of neurons in the primary auditory cortex (A1) has been classically attributed to temporal offsets between feedforward excitatory and inhibitory inputs. However, it remains unclear how cortical recurrent circuitry contributes to this computation. Here, we used two-photon calcium imaging and whole-cell recordings in awake mice to demonstrate that direction selectivity is not caused by temporal offsets between synaptic currents, but by an asymmetry in total synaptic charge between preferred and non-preferred directions. Inactivation of cortical somatostatin-expressing interneurons (SOM cells) reduced direction selectivity, revealing its cortical contribution. Our theoretical models showed that charge asymmetry arises due to broad spatial topography of SOM cell-mediated inhibition which regulates signal amplification in strongly recurrent circuitry. Together, our findings reveal a major contribution of recurrent network dynamics in shaping cortical tuning to behaviorally relevant complex sounds.


Conflict of interest statement

The authors declare no competing interests.

Figures

Fig. 1
Fig. 1. A1 neurons are direction-selective to sweeps at ethologically relevant FM rates.
a Left, vocalization recording schematic. Top right, spectrograms of representative vocalizations. Bottom right, histograms showing the usage probability of FM rates for three vocalization categories in C57BL/6J mice, overlaid with individual data points (n = 7, 5, 5 mice, 20,295, 14,719, 17,826 vocal contour fragments for pup, male, and pain vocalizations; see Supplementary Data 1). Results are mean ± SEM. b Top, usage probability of FM rates for three vocalization categories in three strains. Bottom, usage probability of upward and downward sweeps (BALB: n = 8, 3, 3 mice, 4164, 13,671, 12,235 vocal contour fragments; CBA: n = 4, 3, 3 mice, 21,658, 11,314, 25,640 vocal contour fragments for pup, male, and pain vocalizations). c Left, intrinsic signal imaging of responses to pure tones superimposed on cortical surface imaged through the skull. Right, in vivo two-photon image of L2/3 neurons in A1. A1 tonotopy was reproducibly observed in all eight mice. d FM sweep tuning of three representative L2/3 pyramidal cells. Traces are average responses (five trials). Insets at the bottom show the schematics of frequency versus time representations. DSI was calculated as (U - D)/(U + D), where U and D represent the responses triggered by upward and downward sweeps, respectively. e Fraction of responsive cells at six absolute FM rates. (n = 8 mice, 1292 cells). f Average (solid line) and SEM (shading) of absolute DSI at each FM rate (n = 8 mice, 205 sweep-responsive cells). g Cellular-level spatial organization of BF and DSI in two representative A1 areas. Left, intrinsic signal image superimposed on cortical vasculature imaged through a glass window. Yellow squares represent the two-photon imaging fields of view. Right, maps showing the location of imaged pyramidal cells, BF for pure tones, and DSI for FM sweeps. h DSI of pyramidal cells averaged across all FM rates have a strong dependence on their BF (n = 8 mice, 96 cells responsive to both sweeps and pure tones. R = − 0.403, p = 4.6 × 10−5, two-sided t-test). Red line, regression curve.
Fig. 2
Fig. 2. Direction selectivity is caused by the asymmetry of sound-evoked postsynaptic charge between FM directions.
a In vivo whole-cell recording schematic. b EPSCs (left) and IPSCs (right) evoked by FM sweeps with different rates. Traces are an average of six trials. Red lines, sound onsets and offsets. Black arrowheads, fast EPSCs. Open arrowheads, fast IPSCs. Asterisks, network suppression. c Magnified EPSCs and IPSCs from (b) at +20 oct/s (left) and −20 oct/s (right) FM sweeps. Orange (EPSC) and purple (IPSC) shaded areas highlight sound-evoked fast postsynaptic currents which are prominent only in preferred direction. d Quantitative analysis for the cell shown in (b) at each absolute FM rate. Left, the total charge of fast postsynaptic currents. Right, DSIEPSC and DSIIPSC calculated from the charge. No data point is shown for rates that did not trigger postsynaptic currents. e DSIEPSC and DSIIPSC averaged across cells (EPSC, n = 5 mice, 9 cells; IPSC, n = 4 mice, 7 cells). Results are mean ± SEM. f DSIEPSC and DSIIPSC are correlated (R = 0.522; p = 0.0031, two-sided t-test; n = 30 cell-rate pairs with DSI values for both EPSCs and IPSCs). Red line, regression curve. g Predicted timings of EPSCs, IPSCs, and spikes triggered by preferred and non-preferred FM sweeps in the temporal offset model. Dotted lines, peak timings of EPSCs. h EPSCs and IPSCs evoked by preferred (10 oct/s; top) and non-preferred (−10 oct/s; bottom) FM sweeps in another representative cell. i Magnified view of traces within gray boxes in (h). j Time by which EPSC peak precedes IPSC peak is not significantly different from zero in either direction (preferred: n = 30 cell-rate pairs, p = 0.976; non-preferred: n = 14, p = 0.800; preferred vs non-preferred: p = 0.817, two-sided t-test). Red lines indicate mean. k The time by which EPSC onset precedes IPSC onset is not significantly different from zero in either direction (preferred: p = 0.100; non-preferred: p = 0.549; preferred vs non-preferred: p = 0.153, two-sided t-test).
Fig. 3
Fig. 3. SOM cells shape direction selectivity in A1.
a Schematics of optogenetic inactivation of SOM cells during single-unit recording. b FM sweep responses with (amber shades and traces) and without (black traces) SOM cell photoinactivation. Top, raster plots of FM sweep responses in a representative regular-spiking single-unit. Bottom, peristimulus time histogram (PSTH). Control and photostimulation trials were interleaved but are separated here for clarity. Gray dotted lines indicate sound onsets and offsets. c PSTHs in (b) shown separately for control (top) and photostimulation (bottom) trials after subtracting the baseline firing rate just before sounds. d Schematics of optogenetic inactivation of PV cells during single-unit recording. ef FM sweep responses with and without PV cell photoinactivation. g Left, scatter plot showing absolute DSI during control and SOM cell photoinactivation trials. Gray dots show all sweep-responsive single-units (n = 4 mice, 48 out of 111 regular-spiking single-units). The oblique histogram illustrates the changes in absolute DSI with LED (**p = 0.0006, two-sided t-test). Right, the same plots for PV cell photoinactivation. n = 4 mice, 45 out of 99 regular-spiking single-units. p = 0.667. Dotted lines, unity lines. h Photoinactivation of PV cells and SOM cells increased the spontaneous firing rate to a similar degree (n = 88 and 96 regular-spiking units with baseline firing rate > 0.25 Hz; p = 0.669, two-sided t-test). Box plots show median and 25th and 75th percentiles as box edges, and 1.5 × interquartile range as whiskers.
Fig. 4
Fig. 4. ISN model explains the nonlinear integration of FM sweeps in the A1 circuit.
a Schematics of local connectivity between three cell populations. b Schematics showing spatial scales of connectivity between populations. Horizontal lines show a one-dimensional spatial continuum of tonotopy. c Neuronal transfer function from input current to output firing rate. d Time courses of feedforward EPSC (i), change in total EPSC (ii), change in IPSC from PV cells (iii), change in IPSC from SOM cells (iv), and firing rate (v) of a pyramidal cell with 5 kHz BF. Dark line represents FM sweep stimulus at ±20 oct/s. e Summary plot showing a differential amplification of excitatory postsynaptic charges between upward and downward directions. Amplitudes are normalized to that of feedforward EPSC. f DSI plotted against BF at ±20 oct/s FM rates. Data point with BF = 5 kHz is shown as a red dot. g Absolute DSI plotted against absolute FM rates.
Fig. 5
Fig. 5. Network model demonstrates the requirement for SOM cell activity and strong recurrent excitation.
a Left, DSI plotted against BF at ±20 oct/s FM rates in the control (black) and SOM cell partial inactivation (yellow) conditions. Middle, firing rate of a pyramidal cell (5 kHz BF) during SOM cell partial inactivation. Right, amplification of excitatory postsynaptic charges in response to upward and downward FM directions. b Results for PV cell partial inactivation. c Results for reduced spatial scales of SOM cell connectivity. d Results for non-ISN models with reduced recurrent excitation strengths.
Fig. 6
Fig. 6. A1 Neurons are Direction-Selective to FM Sweeps with restricted frequency ranges.
a Schematic showing spectrally restricted FM sweeps with 1-octave frequency range. Fcent, logarithmic center. b Left, schematic showing seven frequency ranges used. Green line indicates the BF of a representative cell whose FM sweep responses are shown on the right. Inset shows the conversion of Fcent to a relative position centered at the BF. Right, responses of a representative L2/3 pyramidal cell (BF = 9514 Hz) to FM sweeps with seven frequency ranges. This cell reversed its direction selectivity from upward preference (red arrowheads) to downward preference (blue arrowhead) around Fcent at its BF. c The fraction of FM sweep responsive cells for each bin of relative Fcent positions (n = 6 mice, 140 tone-responsive cells out of 485 imaged pyramidal cells). d Average (solid line) and SEM (shading) of absolute DSI at each FM rate (226 sweep-responsive cells). Only FM sweeps with Fcent within ±1 octave from BF were included. e Averaged DSI plotted for each bin of relative Fcent position, showing the reversal of DSI sign (n = 25, 39, 58, 69, 60, 31 responsive pyramidal cells at each Fcent). Results are mean ± SEM. ***p = 0.0006, **p = 0.0012, two-sided t-test.
Fig. 7
Fig. 7. Simple schematic for the generation of direction selectivity by network suppression.
a TRF of EPSCs in a representative cell. Traces are an average of three trials. Red line outlines a region with fast EPSC, blue lines indicate regions with slow network suppression. b Neurons with low BF receive network suppression from high-frequency side, and those with high BF receive it from low-frequency side (n = 14 cells, p = 0.0018, two-sided t-test). c Schematic drawing of the TRF of EPSCs at one sound level. FM sweeps can be approximated as sequential presentations of pure tones. Inset shows the amplification of thalamic inputs by cortical recurrent circuits. d Schematic illustrating the generation of upward preference in a low-BF neuron. Top, pure tone responses from (c) temporally staggered to account for the frequency movement during FM sweeps. Bottom, compound EPSCs generated from upward and downward sequences of tones. In preferred direction, fast EPSC precedes network suppression, resulting in largely linear summation (red traces). In non-preferred direction, network suppression overlaps with fast EPSC and attenuates it, resulting in a sublinear summation (blue traces). Dark traces at the bottom show linear summation, which have equal total charges between directions.

Similar articles

Cited by

References

    1. Doupe AJ, Kuhl PK. BIRDSONG AND HUMAN SPEECH: common themes and mechanisms. Annu. Rev. Neurosci. 1999;22:567–631. doi: 10.1146/annurev.neuro.22.1.567. - DOI - PubMed
    1. Griffin, D. R. Listening in the Dark, The Acoustic Orientation of Bats and Men. (Yale University Press, 1958).
    1. Holy TE, Guo Z. Ultrasonic Songs of Male Mice. PLoS Biol. 2005;3:e386. doi: 10.1371/journal.pbio.0030386. - DOI - PMC - PubMed
    1. Reichardt, W. Sensory Communication. (MIT Press, 1961).
    1. Barlow HB, Levick WR. The mechanism of directionally selective units in rabbit’s retina. J. Physiol. 1965;178:477–504. doi: 10.1113/jphysiol.1965.sp007638. - DOI - PMC - PubMed

Publication types

LinkOut - more resources