. 2021 Jan 12;12(1):346.
doi: 10.1038/s41467-020-20600-7.

Tumor-infiltrating mast cells are associated with resistance to anti-PD-1 therapy

Affiliations

Tumor-infiltrating mast cells are associated with resistance to anti-PD-1 therapy

Rajasekharan Somasundaram et al. Nat Commun. .

Abstract

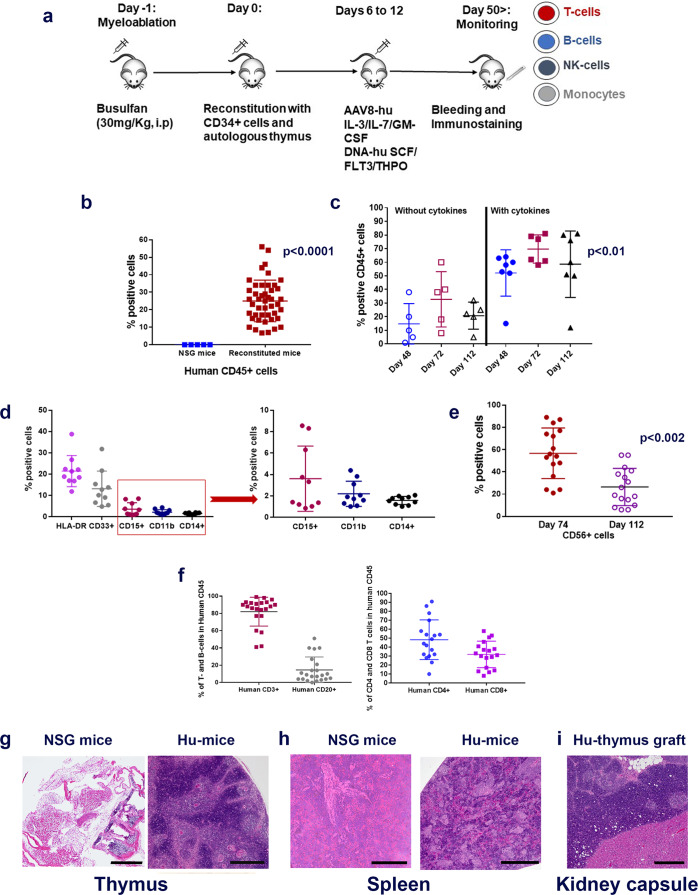
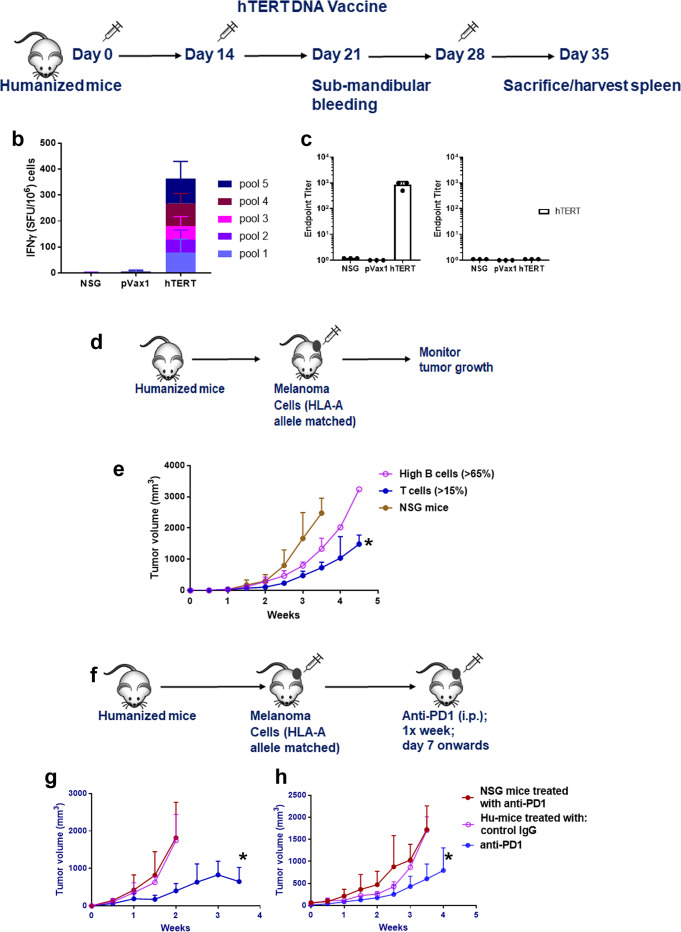
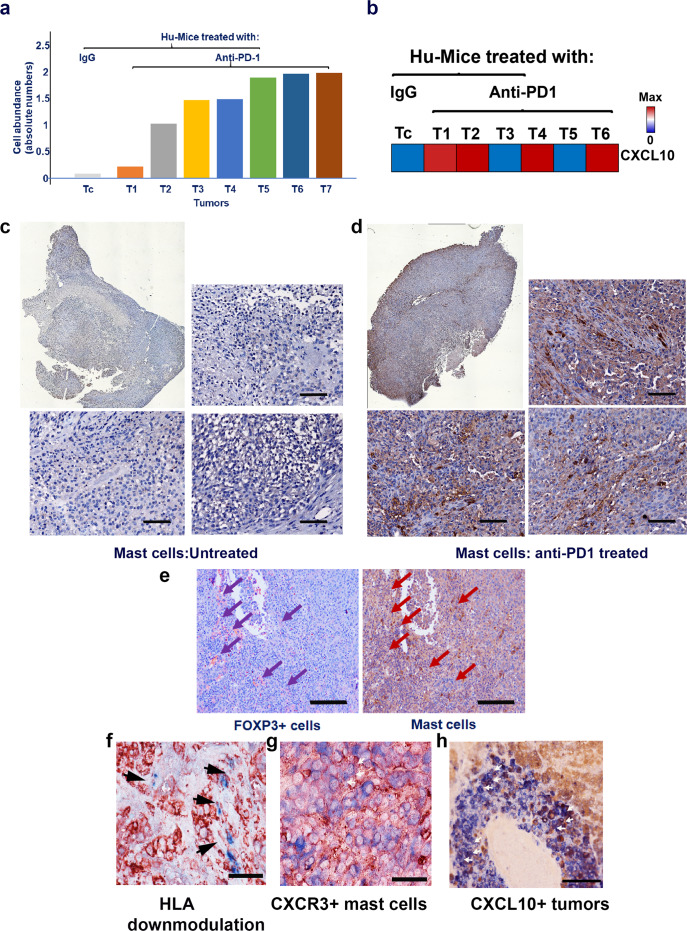
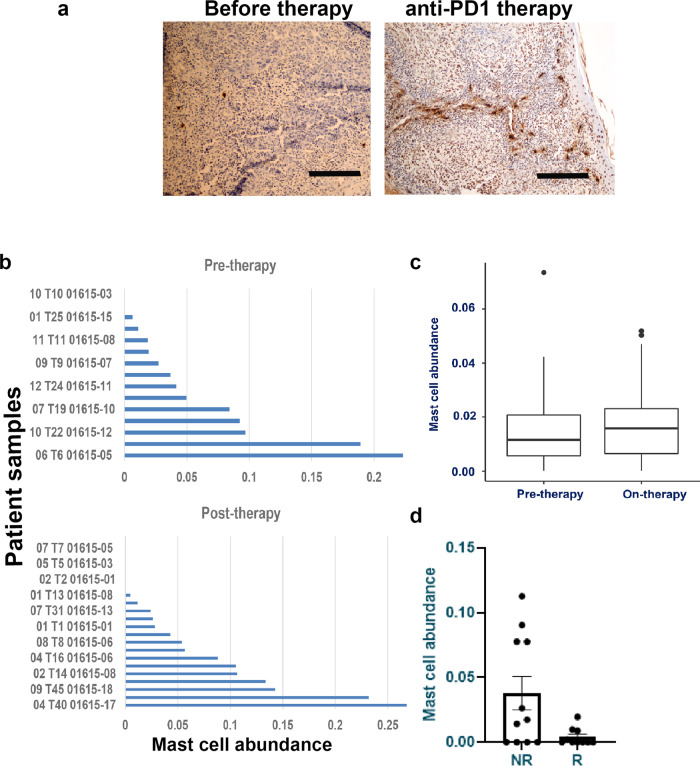
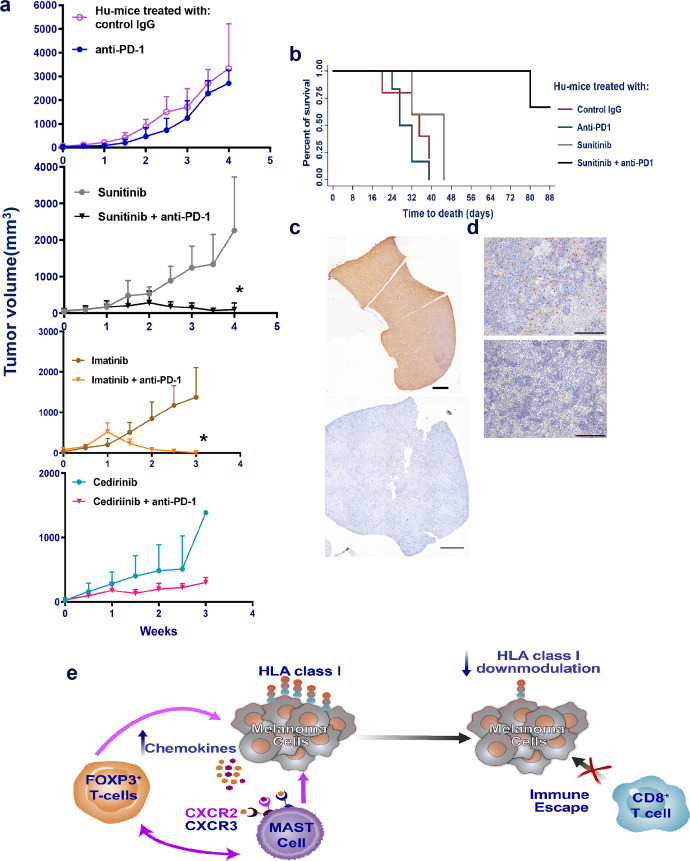
Anti-PD-1 therapy is used as a front-line treatment for many cancers, but mechanistic insight into this therapy resistance is still lacking. Here we generate a humanized (Hu)-mouse melanoma model by injecting fetal liver-derived CD34+ cells and implanting autologous thymus in immune-deficient NOD-scid IL2Rγnull (NSG) mice. Reconstituted Hu-mice are challenged with HLA-matched melanomas and treated with anti-PD-1, which results in restricted tumor growth but not complete regression. Tumor RNA-seq, multiplexed imaging and immunohistology staining show high expression of chemokines, as well as recruitment of FOXP3+ Treg and mast cells, in selective tumor regions. Reduced HLA-class I expression and CD8+/Granz B+ T cells homeostasis are observed in tumor regions where FOXP3+ Treg and mast cells co-localize, with such features associated with resistance to anti-PD-1 treatment. Combining anti-PD-1 with sunitinib or imatinib results in the depletion of mast cells and complete regression of tumors. Our results thus implicate mast cell depletion for improving the efficacy of anti-PD-1 therapy.


Conflict of interest statement

M.A.D. has been a consultant to Roche/Genentech, Array, Novartis, BMS, GSK, Sanofi-Aventis, Vaccinex, and Apexigen, and he has been the PI of research grants to MD Anderson by Roche/Genentech, GSK, Sanofi-Aventis, Merck, Myriad, and Oncothyreon. M.T.T. has advisory board relationships with Nanostring, Merck, Bristol Meyers, and Myriad Genetics. J.A.W. serves as a consultant/advisory board member for Roche/Genentech, Novartis, AstraZeneca, GlaxoSmithKline, Bristol-Myers Squibb, Merck, Biothera Pharmaceuticals and Microbiome DX., and has research support from GlaxoSmithKline, Roche/Genentech, Bristol-Myers Squibb, and Novartis. The remaining authors declare no competing interests.

Figures

Fig. 1
Fig. 1. Generation of Hu-mice.
a Schematic of Hu-mice reconstitution. Six-week-old female NSG mice are all treated with the myelo-depleting drug (busulfan [30 mg/kg]; i.p.) 24 h before they receive purified fetal liver-derived CD34+ cells (1 × 10⁵; i.v.) and autologous thymus grafts (~2 mm) under the renal capsule. After day 50, mice are periodically bled (100 μl) and characterized for human immune cells by standard flow cytometry assay using fluorochrome-conjugated anti-mouse or anti-human antibodies. b Repopulation of human CD45+ cells in circulating blood of reconstituted mice. A representative example of mice (n = 45) after 8–12 weeks of human CD34+ cell injection showed increased levels of human CD45+ cells (brown squares; p = 0.00025) in circulating blood when compared to control non-reconstituted female NSG mice (blue squares; n = 5). c Enhanced repopulation of human lymphocytes after AAV8-hu-cytokine transgenes delivery. Significant increase in circulating human CD45+ cells (p = 0.022 for days 48 and 72 [closed blue circles and brown squares] and p = 0.0094 for day 112 [closed black triangles]) in mice (n = 7) that received AAV8 hu-cytokines (IL3, IL-7, and GM-CSF; 2 × 10⁹ GC/ml; i.v.; 5 days after CD34 injection; right panel) when compared to mice (n = 5) that did not receive hu-cytokines (left panel). d Myeloid lineage cells after administration of hu-cytokines. CD33+, CD15+, CD11b+, and CD14+ cells are also seen in circulating blood after week 12 of CD34+ cells administration and when mice (n = 10) receive AAV8 hu-cytokines (see above) plus DNA-hu-cytokines (SCF, FLT-3, THPO; 50 μg; i.m.; multiple sites). An independent batch of mice was used for this experiment. e Reconstituted mice show the presence of CD56+ NK (innate immune) cells. Mice (n = 16) bled at 10 weeks showed increased CD56+ cells that decrease significantly to physiological levels by week 16 (p = 0.002). An independent batch of mice was used for this experiment. From d, all mice received AAV8 or DNA plasmid-encoded human cytokines as described in the method section. f–i Repopulation of human T- and B-cells. Generally, by 12–14 weeks, physiological levels of human T-and B-cells (f, left panel) and human CD4+ and CD8+ T cells are observed in circulating blood (f, right panel). Each point in the scatter plot represents blood drawn from an individual mouse (n = 16). gi Repopulation of lymphoid organs with human immune cells. In H&E staining, there is dense repopulation of human lymphocytes in reconstituted mouse thymus (g; right panel; scale bar: 200 μm) and spleen (h; right panel; scale bar: 250 μm) when compared to non-reconstituted mouse thymus (g; left panel; scale bar: 500 μm) and spleen (h; left panel; scale bar: 200 μm). Dense repopulation of human lymphocytes in mouse kidney (renal capsule) grafted with human thymus (I; scale bar: 200 μm). A representative example of staining is shown in this figure. All observations (gi) were consistent, and the experiment was repeated more than 2×. All mice were euthanized by CO2 inhalation/cervical dislocation and organs harvested 24 weeks after CD34+ cell injections. Data are presented as mean values ± SD for bf. A one-sided paired t-test was used for statistical analysis when p-values are specified. Source data are provided as a Source Data file.
Fig. 2
Fig. 2. Functional characterization of human immune cells in humanized mice.
ac T- and B-cell response to hTERT vaccine. a Schema for hTERT DNA vaccination. Hu-mice, as described in Fig. 1, received a total of three injections of hTERT vaccine (hTERT DNA [50 μg; i.m] followed by electroporation) every 2 weeks and the mice were euthanized by CO2 inhalation/cervical dislocation and organs harvested 1 week after the last injection to determine T- and B-cell responses. b Anti-TERT T-cell responses. Spleen cells from Hu-mice (n = 3) were stimulated overnight (18 h) with pools of overlapping hTERT peptides (15 mer; 2 μg/ml/peptide) spanning the entire hTERT protein. Human IFNγ was detected in ELISPOT assay using a kit. Data are represented as SFU (spot forming units; mean ± SE) per 106 splenocytes. hTERT-specific T-cell (IFNγ) response from vaccinated mice was compared to age-matched Hu-mice that received pMV101, a modified pVAX1 vector, as control or untreated age, sex-matched NSG mice controls. c Anti-TERT antibody (IgG) responses. Endpoint binding titer was determined in sera of hTERT vaccinated mice (n = 3) after 3 immunizations and compared to sera from NSG mice as controls. Data are presented as mean values ± SD. dh Functional ability of immune T cells to restrict tumor growth. d Schema for Hu-mice tumor challenge experiment. e Hu-mice with T-cell reconstitution can restrict tumor growth of HLA-A2 matched A375 melanoma cells. Hu-mice, as described in Fig. 1 that have 90 to 120 cells/μl circulating CD45+/CD8+ cells (closed circle, blue line) when challenged with melanoma cells (105; s.c.), can restrict tumor growth significantly (*p = 0.0281) when compared to non-reconstituted NSG mice (n = 3; closed circles, brown line) and Hu-mice with high circulating B-cells (n = 4; >65% [550 to 600 cells/μl] CD20+; open circles, magenta line) have unrestricted tumor growth. Tumor growth measurements are recorded using a digital caliper by an independent researcher. fh Treatment with anti-PD-1 antibody can restrict tumor growth of melanoma cells. f Schema for anti-PD-1 therapy. Hu-mice with CD45+/CD8+ (90 to 120 cells/μl) and cells were randomized, and they receive melanoma cells (105; s.c.). When tumors are palpable, mice receive anti-PD-1 (10 mg/kg; i.p. injections) every week for four injections and tumor growth measurements are recorded. g, h Anti-PD-1 therapy restrict melanoma growth. Hu-mice (n = 10) treated with anti-PD-1 antibody can restrict tumor growth of two different melanoma cells [(WM3629 [HLA-A3]; g] and [A375 [HLA-A2]; h]) significantly (blue line, closed circles; *p = 0.0437 for WM3629 and p = 0.0547 for A375) when compared to Hu-mice treated with control IgG (n = 5; magenta; open circles) or non-reconstituted age and sex-matched NSG mice (n = 10; brown; closed circles) treated with the ant-PD-1 antibody. Two different batches of Hu-mice were used for this experiment and they had comparable CD45+/CD8+ T-cell counts. Unrestricted tumor growth in presence of anti-PD-1 antibody was observed when Hu-mice were challenged with an aggressive phenotype of the tumor (Supplementary Fig. 8). Data are presented as mean values ± SEM for eh. A one-sided paired t-test was used for analysis when p-values are provided. Source data are provided as a Source Data file.
Fig. 3
Fig. 3. Immune and tumor heterogeneity as a possible cause of therapy resistance to anti-PD-1.
ad Heterogeneous distribution of leukocytes and immune cells in tumors after PD-1 treatment. a. Tumor (A375) bearing Hu-mice that received anti-PD-1 as in Fig. 2h, showed dense leukocyte infiltration of leukocytes (bottom panel; scale bar: 500 μm) when compared to mice that received control mouse IgG (top panel; scale bar: 100 μm) as determined by H&E staining. b Tumor (A375) bearing Hu-mice that received anti-PD-1 showed a heterogeneous distribution of CD4+ and CD8+ T cells (stitched image right panel; scale bar: 500 μm) when compared control Ig treated Hu-mice that had a sparse distribution of T cells (right panel). Please see Supplementary Fig. 9 for digital quantification of CD4+ and CD8+ T cells. c Tumor (A375) bearing Hu-mice that received anti-PD-1 showed either low to moderate (left panel; scale bar: 50 μm) or robust (right panel; scale bar: 50 μm) tumor-infiltration of CD4+ (brown) and CD8+ (blue) T cells within the same tumor. d MassCyTOF staining shows heterogeneous and higher distribution of CD8+ T cells (magenta) within the nestin+ tumor (A375) cells (dark blue) in anti-PD-1 treated tumor-bearing mice (lower panels) as compared to low infiltration of CD8+ T cells (upper panels) in untreated Hu-mice (see f for quantification). Distribution of GrB+ T cells (yellow arrows; 2nd to right bottom panel) was heterogeneous as they were higher on the bottom half (digital quantification:131 counts) of the tumor section when compared to the remainder of other nestin+ tumor cell areas (digital quantification: 37 counts). e CD8+ T cells are of memory phenotype as they stain for CD45RO (light blue; top panel) and areas not infiltrated by CD8+ T cells reveal the presence of CD4+/FOXP3+ cells (magenta arrows; bottom panel). f Quantification of MassCyTOF images by ImageJ software indicates a significant increase (p = 0.0049) in CD8+ T cells and Granzyme B+ T cells; CD45RO+ memory T cells compared to untreated mice and increase in FOXP3+ Treg cells in the indicated top or bottom half panels. All histology and MassCyTOF staining were consistent and confirmed in replicates of 2. g, h Downmodulation of HLA class I (white arrows) was observed in tumor areas that were associated with higher FOXP3+ cells (p = 0.0351; see e bottom panel; a representative image). Confirmation by quantitative analysis of mean intensity (MI) of HLA-class I expression (h). A one-sided paired t-test was used for analysis when p-values are provided. Representative scale bars in d, e, g represent 50 μm. All observations (ae, g) were consistent, were observed in technical replicates (CyTOF), confirmed in histology staining, and in replicate experiments.
Fig. 4
Fig. 4. Increase in mast cells after anti-PD-1 therapy.
a CIBERSORT analysis of the RNA-seq data set (GSE161353) showed a higher abundance of mast related genes in tumors (WM3629 and A375) obtained from Hu-mice after anti-PD-1 treatment and increased expression of CXCL10, a chemoattractant for mast cells (b). The presence of mast cells was further confirmed by mast cell tryptase IHC staining. c, d Stitched image (top left panels) and three different fields from an untreated tumor (WM3629) had negligible staining for mast cells (top right panel and bottom two panels; scale bar: 100 μm), whereas stitched image (top right middle panel) and three different fields from anti-PD-1 treated tumor had robust staining for mast cells, which was highly significant compared to control-treated mice (p = 0.005407; top right panel and bottom 2 panels; scale bar: 100 μm). e Co-localization of FOXP3+ Treg and mast cells after anti-PD-1 therapy. Co-localization of these cells as determined by IHC staining was significant (p = 0.000047; scale bar: 200 μm) suggesting crosstalk. f Downmodulation of HLA class I. HLA class I molecules as determined by staining with anti-HLA class I antibody (red) were downmodulated in tumor (WM3629) areas (black arrows) that were infiltrated by mast cells (blue). Scale bar represents 50 μm. g Mast cells co-express CXCR3. Mast cells were co-stained with anti-MCT (blue) and anti-human CXCR3 (red; white arrows) antibodies (see Supplementary Fig. 11 for digital quantification). Scale bar represents 50 μm. h Melanoma (WM3629) cells co-express CXCL10. Tumor cells were co-stained with anti-melanoma (HMB45 [blue]) and anti-human CXCL10 (red; white arrows) antibodies. Scale bar represents 100 μm. Histology staining (ch) was confirmed in repeat experiments (2×). Source data are provided as a Source Data file (data are included as part of Supplementary Fig. 10).
Fig. 5
Fig. 5. Anti-PD-1 therapy response is modulated by the presence of tumor-infiltrating mast cells.
a Increase in mast cells in melanoma patients’ tumors after anti-PD-1 therapy. Immunostaining of human melanoma patients’ tumor showed an increased presence of mast cells after anti-PD-1 therapy (right panel) when compared to untreated individuals (left panel). Scale bars in both panels represent 200 μm. A representative staining is shown. b, c CIBERSORT analysis of three independent data sets (GSE123728 [16 pre and 23 on-therapy patients] and GSE91061 [43 pre-/on-therapy patients]) obtained from melanoma patients undergoing immune-checkpoint therapy showed a higher abundance of mast cell-related genes when compared to pre-therapy tumors and this was significant in b (n = 38; p = 0.0007) and c (n = 73; p = 0.049) due to higher number of matched pair biopsies (before and on-therapy samples). Box plots for pre-therapy tumors are represented as median (0.01153732; quartile 0.01153734), minimum (0; quartile 0.00561458), and maximum (0.07344924; quartile 0.02074330), and for on-therapy tumors are represented as median (0.01577157; quartile 0.01577157), minimum (0; quartile 0.00651041) and maximum (0.05185949; quartile 0.02311874). d Increased levels of mast cells in immune-checkpoint therapy non-responders. CIBERSORT analysis of RNASeq data set from MD Anderson trial (pre- and on-therapy patients (n = 23; Helmink et al.)) revealed higher mast cell levels in anti-PD-1 therapy non-responder population. However, this increase was not significant due to smaller patient numbers. Data are presented as mean values ± SEM. A one-sided paired t-test was used for analysis when p-values are provided. Source data are provided as a Source Data file (data are included as part of Supplementary Fig. 10).
Fig. 6
Fig. 6. Complete regression of tumors after a combination of sunitinib and anti-PD therapy.
a Using an independent batch of Hu-mice, established tumors (A375) (details as in Fig. 2g, h; n = 5/group) were treated with sunitinib (20 mg/kg) daily by oral gavage and after 72 h, anti-PD-1 therapy (10 mg/kg) was given weekly for a total of 6 injections. Complete tumor regression was observed in presence of combination therapy (black inverted triangle; p = 0.0001; 2nd panel), while sunitinib alone (gray circles), anti-PD-1 alone (blue line, closed circles) or control IgG (magenta; open circles) did not have any effect of tumor growth. We observed similar results when drug imatinib (50 mg/kg; daily by oral gavage) was used in combination with anti-PD-1 (brown line, closed circles; p = 0.0282; n = 7; 3rd panel from the bottom). Imatinib alone had no effect on tumor growth. Cediranib (6 mg/kg; daily by oral gavage) either alone or in combination with anti-PD-1 antibody was unable to shrink the tumors (n = 3 per group; bottom panel). Data are presented as mean values ± SD. A one-sided paired t-test was used for analysis when p-values are provided. b Survival curve from the above-treated mice indicates significant (p = 0.0013 as determined by the log-ranked test) survival advantage of tumor-bearing Hu-mice that received combination therapy of sunitinib and anti-PD-1 group when compared to sunitinib alone (gray), or anti-PD-1 alone (dark blue) or control IgG (magenta) groups. c, d Depletion of mast cells in spleen in sunitinib treated mice (bottom [1000] μm left and right panels [100] μm) when compared to control mice (top left [1000] μm and right panels [100] μm panel). Histology staining (c, d) was confirmed in repeat experiments (2×). e Schema of mast cell-induced resistance mechanism to anti-PD-1. Source data are provided as a Source Data file.

Comment in

References

    1. Sharma P, Hu-Lieskovan S, Wargo JA, Ribas A. Primary, adaptive, and acquired resistance to cancer immunotherapy. Cell. 2017;168:707–723. doi: 10.1016/j.cell.2017.01.017. - DOI - PMC - PubMed
    1. Somasundaram R, et al. Tumor-associated B-cells induce tumor heterogeneity and therapy resistance. Nat. Commun. 2017;8:607. doi: 10.1038/s41467-017-00452-4. - DOI - PMC - PubMed
    1. Seidel JA, Otsuka A, Kabashima K. Anti-PD-1 and anti-CTLA-4 therapies in cancer: mechanisms of action, efficacy, and limitations. Front. Oncol. 2018;8:86. doi: 10.3389/fonc.2018.00086. - DOI - PMC - PubMed
    1. Jenkins RW, Barbie DA, Flaherty KT. Mechanisms of resistance to immune checkpoint inhibitors. Br. J. Cancer. 2018;118:9–16. doi: 10.1038/bjc.2017.434. - DOI - PMC - PubMed
    1. Horn LA, Fousek K, Palena C. Tumor plasticity and resistance to immunotherapy. Trends Cancer. 2020;6:432–441. doi: 10.1016/j.trecan.2020.02.001. - DOI - PMC - PubMed

Publication types

MeSH terms

Substances