. 2021 Jan 12;11(1):629.
doi: 10.1038/s41598-020-79780-3.

The evaluation of pituitary damage associated with cardiac arrest: An experimental rodent model

Affiliations

The evaluation of pituitary damage associated with cardiac arrest: An experimental rodent model

Yu Okuma et al. Sci Rep. .

Abstract

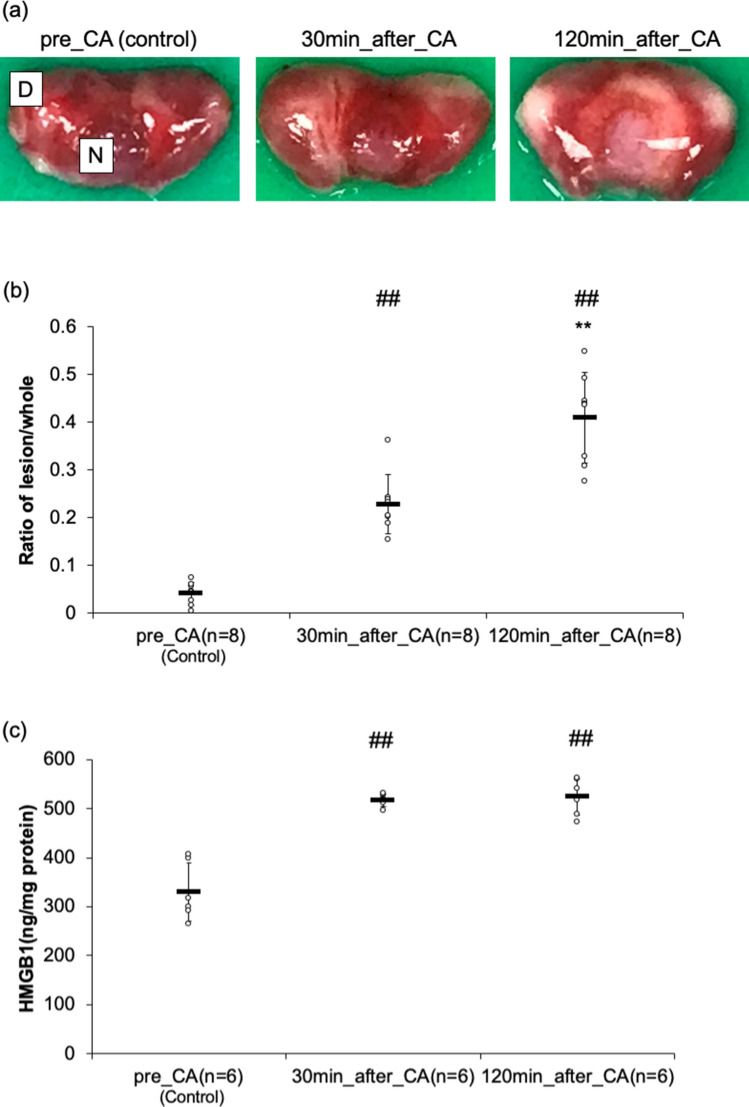
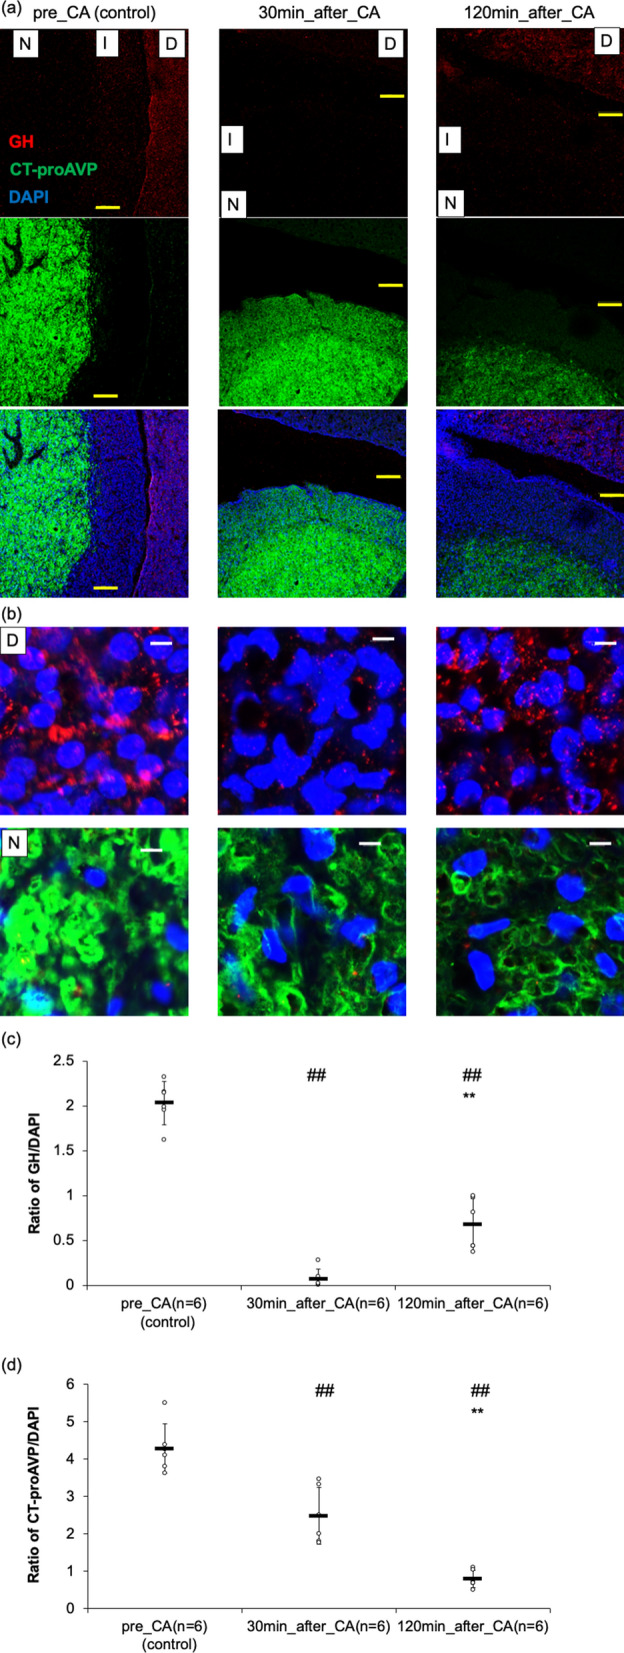
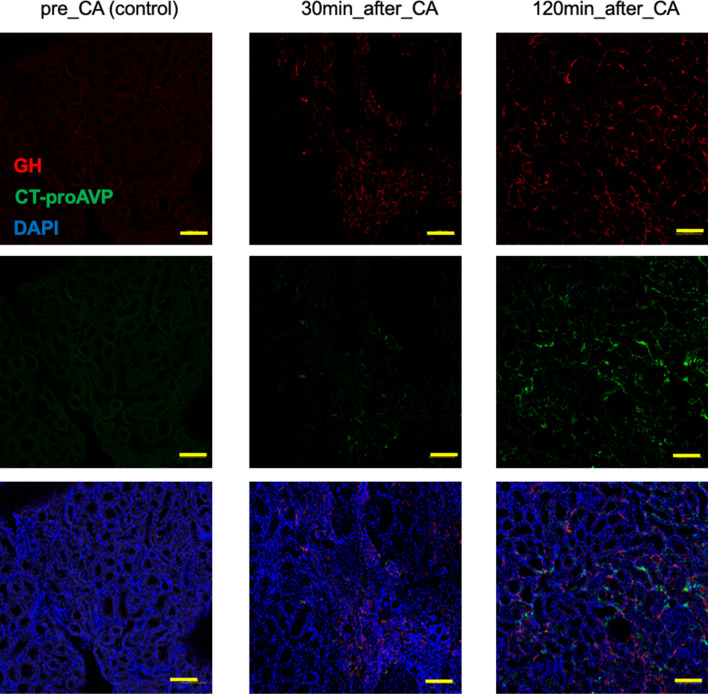
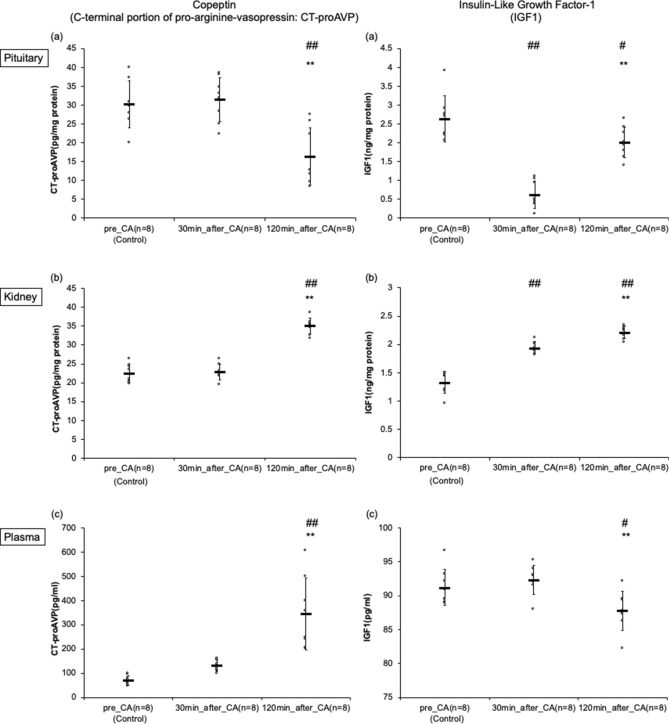
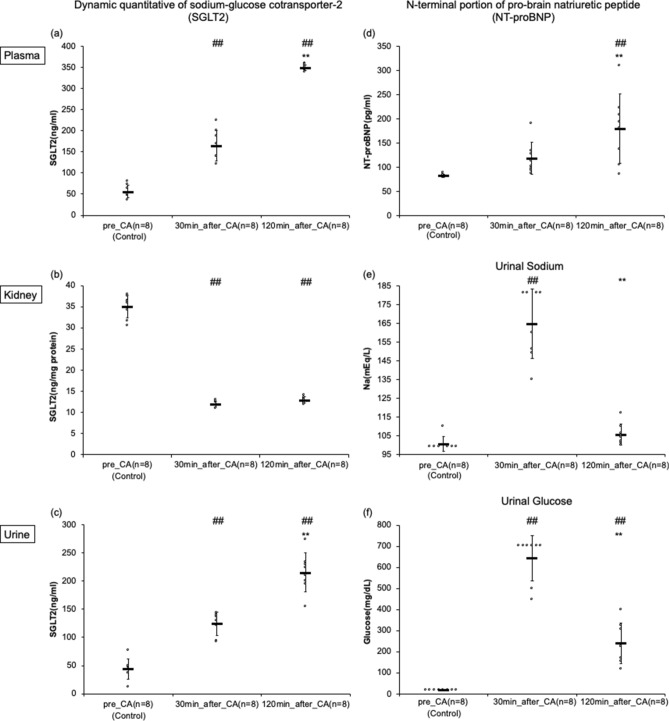
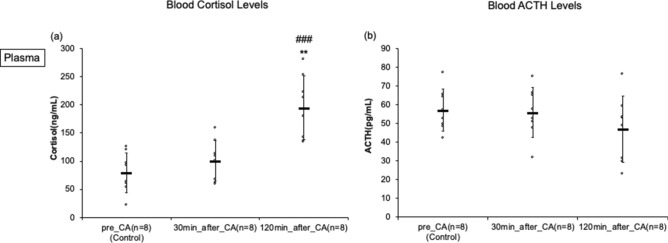
The pituitary gland plays an important endocrinal role, however its damage after cardiac arrest (CA) has not been well elucidated. The aim of this study was to determine a pituitary gland damage induced by CA. Rats were subjected to 10-min asphyxia and cardiopulmonary resuscitation (CPR). Immunohistochemistry and ELISA assays were used to evaluate the pituitary damage and endocrine function. Samples were collected at pre-CA, and 30 and 120 min after cardio pulmonary resuscitation. Triphenyltetrazolium chloride (TTC) staining demonstrated the expansion of the pituitary damage over time. There was phenotypic validity between the pars distalis and nervosa. Both CT-proAVP (pars nervosa hormone) and GH/IGF-1 (pars distalis hormone) decreased over time, and a different expression pattern corresponding to the damaged areas was noted (CT-proAVP, 30.2 ± 6.2, 31.5 ± 5.9, and 16.3 ± 7.6 pg/mg protein, p < 0.01; GH/IGF-1, 2.63 ± 0.61, 0.62 ± 0.36, and 2.01 ± 0.41 ng/mg protein, p < 0.01 respectively). Similarly, the expression pattern between these hormones in the end-organ systems showed phenotypic validity. Plasma CT-proAVP (r = 0.771, p = 0.025) and IGF-1 (r = -0.775, p = 0.024) demonstrated a strong correlation with TTC staining area. Our data suggested that CA induces pathological and functional damage to the pituitary gland.


Conflict of interest statement

The authors declare no competing interests.

Figures

Figure 1
Figure 1
The evaluation of the pituitary damaged after asphyxial cardiac arrest (CA). (a) In order to evaluate the lesion volumes, the pituitaries were stained by 2% 2, 3, 5-triphenyltetrazolium chloride (TTC) at different time points. Every representative case from each group was shown. (b) We evaluated using the ratio of the lesion divided by the whole area. The results are indicated as mean ± SD. ##p < 0.01 compared with the pre-CA group. **p < 0.01 compared with 30 min post-CA group. (c) In order to determine the damaged molecular patterns in the pituitary, we evaluated the pituitary HMGB-1 level by enzyme-linked immunosorbent assay in CA rats. The results are shown as mean ± SD. ##p < 0.01 compared with the pre-CA group.
Figure 2
Figure 2
Time-dependent change of copeptin (C-terminal portion of pro-arginine-vasopressin: CT-proAVP) and growth hormone (GH) in the pars distalis (D), the pars nervosa (N), and the pars intermedia in pituitary of the asphyxial cardiac arrest (CA) rat. The pituitary sections were double-immunostained with anti-CT-proAVP and anti-GH antibodies, followed by AlexaFluor 555-labeled and AlexaFluor 488-labeled secondary antibodies respectively. 4, 6-Diamido-2-Phenylindole (DAPI) staining was performed to demonstrate the cell nuclei. LPF, low power field; HPF, high power field. (a) LPF of the pituitaries at different time points. Scale bars meant 100 um (yellow). (b) HPF of the pars D and the pars N in pituitaries at different time points. Scale bars meant 5um (white). (c) The ratio of GH divided by DAPI in pars N were measured using the BZ-800 Analyze software program. The results are indicated as mean ± SD. ##p < 0.01 compared with pre-CA group. **p < 0.01 compared with 30 min post-CA group. (d) The ratio of CTp-proAVP divided by DAPI in pars D were measured using the BZ-800 Analyze software program. The results are shown as mean ± SD. ##p < 0.01 compared with pre-CA group. **p < 0.01 compared with 30 min post-CA group.
Figure 3
Figure 3
Time-dependent change of copeptin (C-terminal portion of pro-arginine-vasopressin: CT-proAVP) and growth hormone (GH) in the kidney of the rat with asphyxial cardiac arrest. The kidney sections were double-immunostained with anti-CT-proAVP and anti-GH antibodies, followed by AlexaFluor 555-labeled and AlexaFluor 488-labeled secondary antibodies respectively. 4, 6-Diamido-2-Phenylindole (DAPI) staining was performed to show the cell nuclei. LPF, low power field. LPF of the pituitaries at different time points. Scale bars meant 100 um (yellow). There seemed a difference between the absorbed site of CT-proAVP and that of GH.
Figure 4
Figure 4
Dynamic quantitative measures of copeptin (C-terminal portion of pro-arginine-vasopressin: CT-proAVP) of the pituitary, kidney, and plasma, insulin-like growth factor-1 (IGF1) of the pituitary, kidney, and plasma by enzyme-linked immunosorbent assay in asphyxial cardiac arrest (CA) rats. (a) This indicates the results of the pituitary. ##p < 0.01 compared with the pre-CA group. **p < 0.01 compared with 30 min post-CA group. (b) This shows the results of kidney. ##p < 0.01 compared with the pre-CA group. **p < 0.01 compared with 30 min post-CA group. (c) This shows the results of the plasma. ##p < 0.01 compared with the pre-CA group. **p < 0.01 compared with 30 min post-CA group. Numbers are expressed as mean ± SD.
Figure 5
Figure 5
(a)–(d) Dynamic quantitative measures of sodium-glucose cotransporter-2 (SGLT2) of the kidney, plasma, and urine, N-terminal portion of pro-brain natriuretic peptide (NT-proBNP) of plasma by enzyme-linked immunosorbent assay in asphyxial cardiac arrest (CA) rats. (a) This shows the results of the plasma. ##p < 0.01 compared with the pre-CA group. **p < 0.01 compared with 30 min post-CA group. (b) This demonstrates the results of the kidney. ##p < 0.01 compared with the pre-CA group. **p < 0.01 compared with 30 min post-CA group. (c) This indicates the urine results. ##p < 0.01 compared with the pre-CA group. **p < 0.01 compared with 30 min post-CA group. (d) This shows the results of plasma as mean ± SD. ##p < 0.01 compared with the pre-CA group. **p < 0.01 compared with 30 min post-CA group. (e)–(f) Dynamic quantitative measures of sodium and glucose levels in the urine. (e) This shows the result of urine sodium. ##p < 0.01 compared with the pre-CA group. **p < 0.01 compared with 30 min post-CA group. (f) This shows the result of urine glucose. ##p < 0.01 compared with the pre-CA group. **p < 0.01 compared with 30 min post-CA group. Numbers are expressed as mean ± SD.
Figure 6
Figure 6
Cortisol and ACTH plasma levels by enzyme-linked immunosorbent assay in asphyxial cardiac arrest (CA) rats. (a) blood cortisol level. (b) blood ACTH level. ###p < 0.001 compared with the pre-CA group. **p < 0.01 compared with 30 min post-CA group.

Similar articles

Cited by

References

    1. Nolan JP, et al. Post-cardiac arrest syndrome: Epidemiology, pathophysiology, treatment, and prognostication. Resuscitation. 2008;79:350–379. doi: 10.1016/j.resuscitation.2008.09.017. - DOI - PubMed
    1. Callaway CW, et al. Part 8: Post-cardiac arrest care. Circulation. 2015;132:S465–S482. doi: 10.1161/cir.0000000000000262. - DOI - PMC - PubMed
    1. Hiller-Sturmhofel S, Bartke A. The endocrine system: An overview. Alcohol. Health. Res. World. 1998;22:153–164. - PMC - PubMed
    1. Clarke IJ, Cummins JT, de Kretser DM. Pituitary gland function after disconnection from direct hypothalamic influences in the sheep. Neuroendocrinology. 1983;36:376–384. doi: 10.1159/000123484. - DOI - PubMed
    1. Ohbuchi T, Haam J, Tasker JG. Regulation of neuronal activity in hypothalamic vasopressin neurons. Interdiscip. Inf. Sci. 2015;21:225–234. doi: 10.4036/iis.2015.b.07. - DOI - PMC - PubMed

Publication types