

Aortic acceleration as a noninvasive index of left ventricular contractility in the mouse
- PMID: 33436716
- PMCID: PMC7804023
- DOI: 10.1038/s41598-020-79866-y
Aortic acceleration as a noninvasive index of left ventricular contractility in the mouse
Erratum in
-
Author Correction: Aortic acceleration as a noninvasive index of left ventricular contractility in the mouse.Sci Rep. 2021 Apr 6;11(1):7859. doi: 10.1038/s41598-021-87101-5. Sci Rep. 2021. PMID: 33824374 Free PMC article. No abstract available.
-
Author Correction: Aortic acceleration as a noninvasive index of left ventricular contractility in the mouse.Sci Rep. 2021 Dec 3;11(1):23743. doi: 10.1038/s41598-021-03203-0. Sci Rep. 2021. PMID: 34862472 Free PMC article. No abstract available.
Abstract
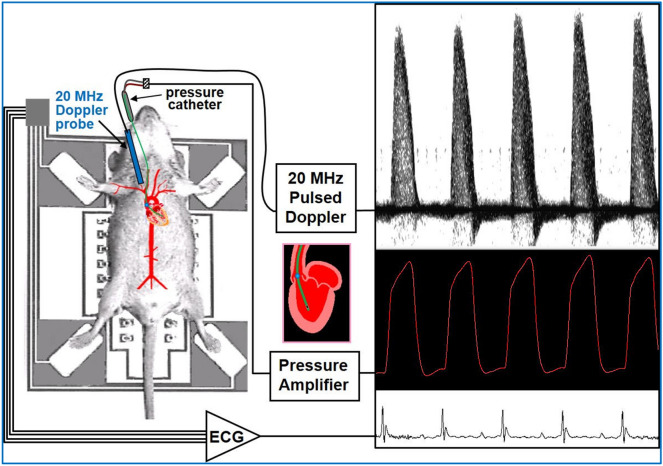
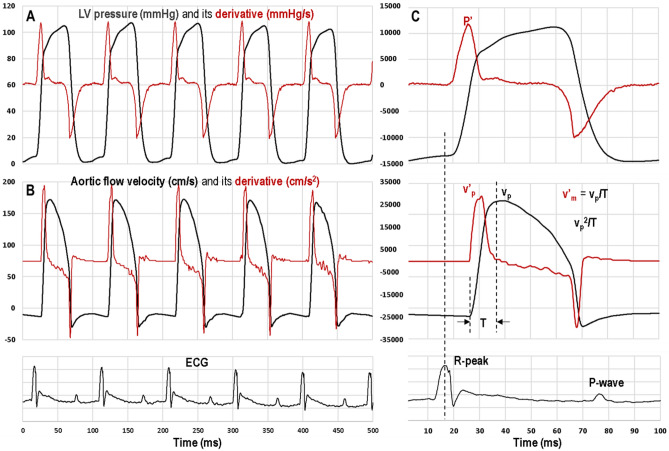
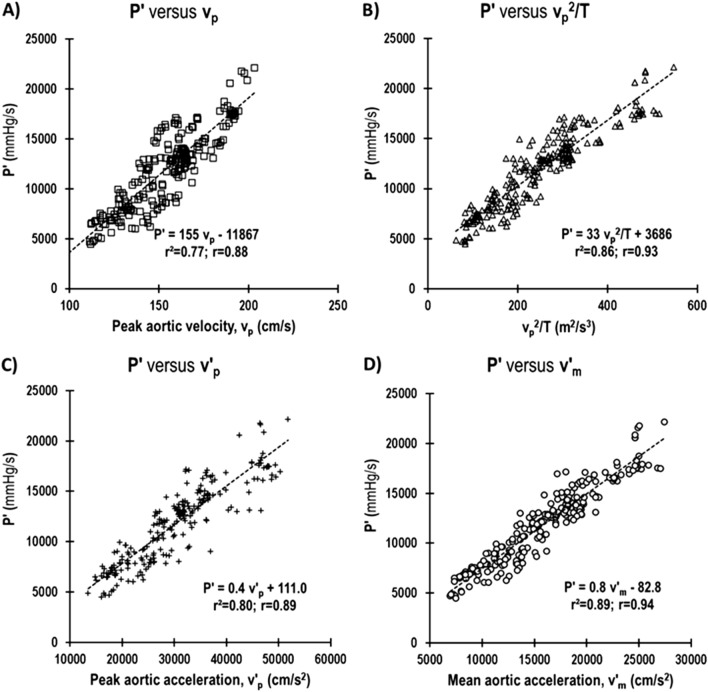
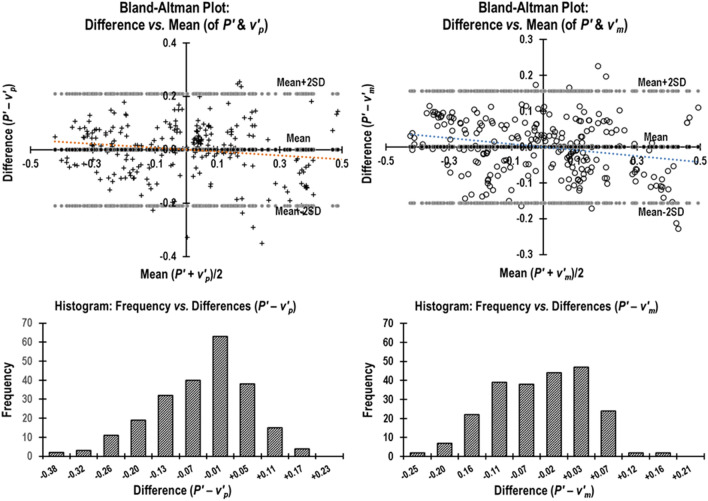
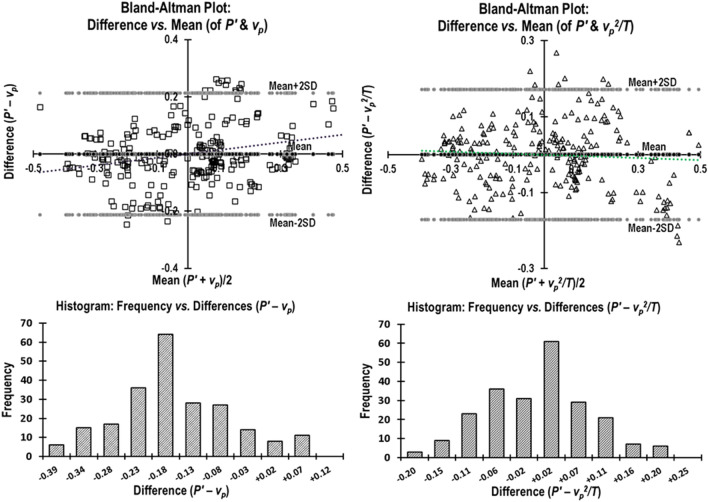
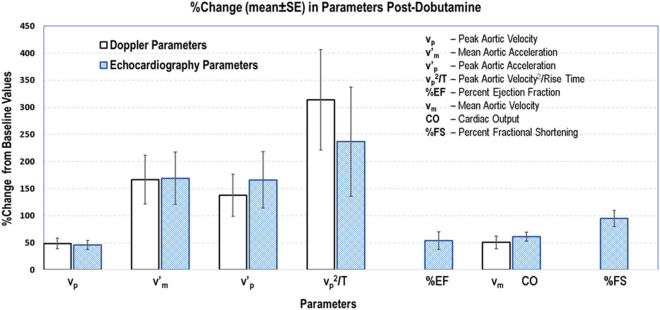
The maximum value of the first derivative of the invasively measured left ventricular (LV) pressure (+ dP/dtmax or P') is often used to quantify LV contractility, which in mice is limited to a single terminal study. Thus, determination of P' in mouse longitudinal/serial studies requires a group of mice at each desired time point resulting in "pseudo" serial measurements. Alternatively, a noninvasive surrogate for P' will allow for repeated measurements on the same group of mice, thereby minimizing physiological variability and requiring fewer animals. In this study we evaluated aortic acceleration and other parameters of aortic flow velocity as noninvasive indices of LV contractility in mice. We simultaneously measured LV pressure invasively with an intravascular pressure catheter and aortic flow velocity noninvasively with a pulsed Doppler probe in mice, at baseline and after the administration of the positive inotrope, dobutamine. Regression analysis of P' versus peak aortic velocity (vp), peak velocity squared/rise time (vp2/T), peak (+ dvp/dt or v'p) and mean (+ dvm/dt or v'm) aortic acceleration showed a high degree of association (P' versus: vp, r2 = 0.77; vp2/T, r2 = 0.86; v'p, r2 = 0.80; and v'm, r2 = 0.89). The results suggest that mean or peak aortic acceleration or the other parameters may be used as a noninvasive index of LV contractility.
Conflict of interest statement
Dr. Reddy is a member of the faculty at Baylor College of Medicine and a collaborator and consultant with Indus Instruments. Dr. Madala is the president of Indus Instruments and an adjunct faculty at Baylor College of Medicine. All other authors have no competing interests.
Figures
Similar articles
-
Doppler echocardiographic evaluation of left ventricular function.Echocardiography. 1990 Jan;7(1):21-25. doi: 10.1111/j.1540-8175.1990.tb00344.x. Echocardiography. 1990. PMID: 10149188 Review.
-
Peak systolic velocity of mitral annular longitudinal movement measured by pulsed tissue Doppler imaging as an index of global left ventricular contractility.Am J Physiol Heart Circ Physiol. 2010 May;298(5):H1608-15. doi: 10.1152/ajpheart.01231.2009. Epub 2010 Mar 5. Am J Physiol Heart Circ Physiol. 2010. PMID: 20207811
-
Noninvasive assessment of left ventricular isovolumic contraction and relaxation with continuous wave Doppler aortic regurgitant velocity signals: an in vivo validation study.J Am Soc Echocardiogr. 2001 Jul;14(7):715-22. doi: 10.1067/mje.2001.111477. J Am Soc Echocardiogr. 2001. PMID: 11447418
-
Estimation of left ventricular performance through temporal pressure variations measured by MR velocity and acceleration mappings.J Magn Reson Imaging. 2002 Sep;16(3):246-52. doi: 10.1002/jmri.10162. J Magn Reson Imaging. 2002. PMID: 12205579
-
Quantitative evaluation of left ventricular systolic function by Doppler echocardiographic techniques.Echocardiography. 1994 May;11(3):305-14. doi: 10.1111/j.1540-8175.1994.tb01080.x. Echocardiography. 1994. PMID: 10150566 Review.
Cited by
-
Haemodynamic Effects of Pimobendan during General Anaesthesia in Healthy Senior Dogs: A Prospective, Randomised, Triple-Blinded, Placebo-Controlled Clinical Study.Animals (Basel). 2023 Jun 26;13(13):2110. doi: 10.3390/ani13132110. Animals (Basel). 2023. PMID: 37443908 Free PMC article.
-
Adaptation of a mouse Doppler echocardiograph system for assessing cardiac function and thermal performance in a juvenile salmonid.Conserv Physiol. 2021 Sep 3;9(1):coab070. doi: 10.1093/conphys/coab070. eCollection 2021. Conserv Physiol. 2021. PMID: 34512992 Free PMC article.
-
Echocardiography protocol: A tool for infrequently used parameters in mice.Front Cardiovasc Med. 2022 Dec 21;9:1038385. doi: 10.3389/fcvm.2022.1038385. eCollection 2022. Front Cardiovasc Med. 2022. PMID: 36620641 Free PMC article.
References
-
- Eskander M, Kern MJ. Invasive hemodynamics of myocardial disease: systolic and diastolic dysfunction (and Hypertrophic obstructive cardiomyopathy) Interv. Cardiol. Clin. 2017;6:297–307. - PubMed
-
- Harada Y, et al. Principle of a noninvasive method of measuring Max(dP/dt) of the left ventricle: theory and experiments. Heart Vessels. 1987;3:25–32. - PubMed
Publication types
MeSH terms
Substances
Grants and funding
LinkOut - more resources
Full Text Sources
Other Literature Sources
