

A systematic review and meta-analysis of the serum lipid profile in prediction of diabetic neuropathy
- PMID: 33436718
- PMCID: PMC7804465
- DOI: 10.1038/s41598-020-79276-0
A systematic review and meta-analysis of the serum lipid profile in prediction of diabetic neuropathy
Abstract
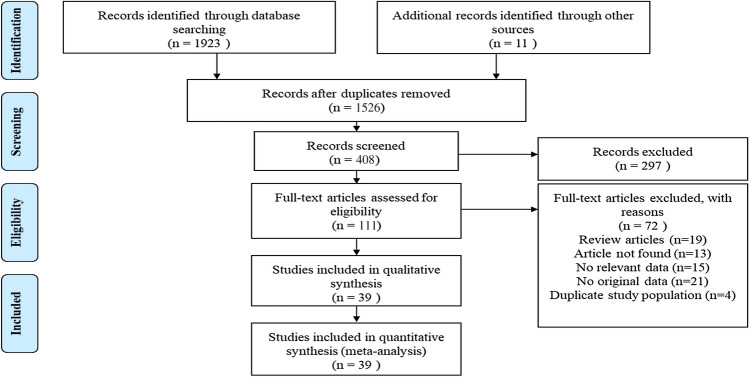
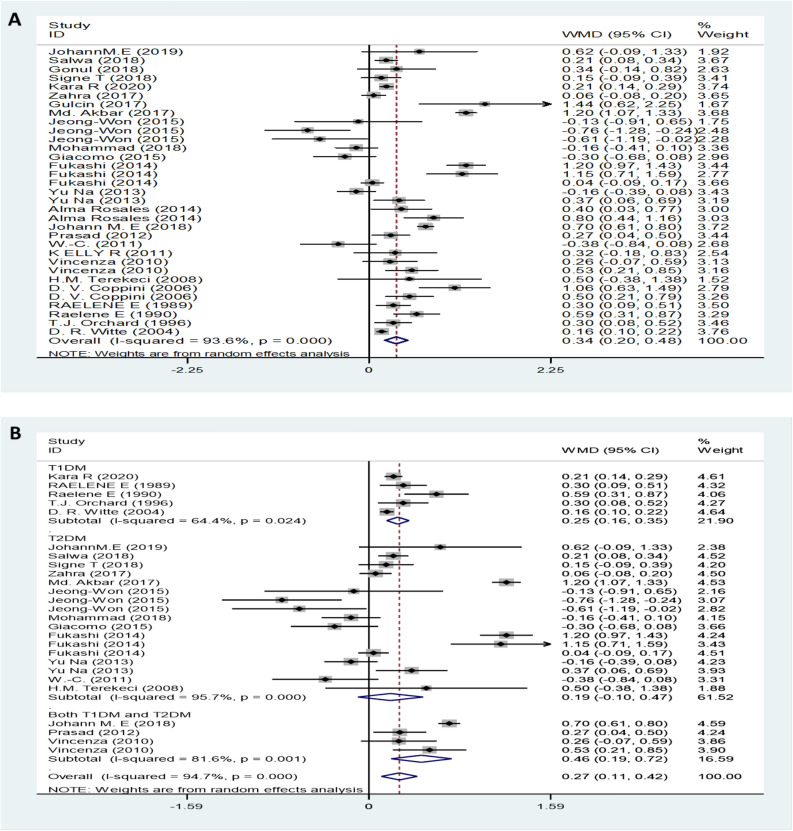
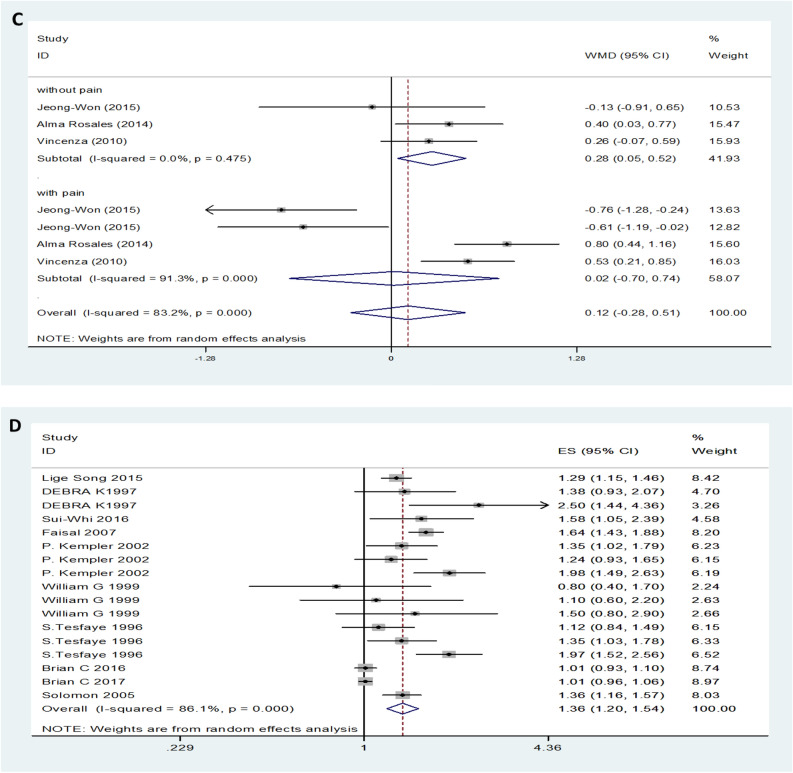
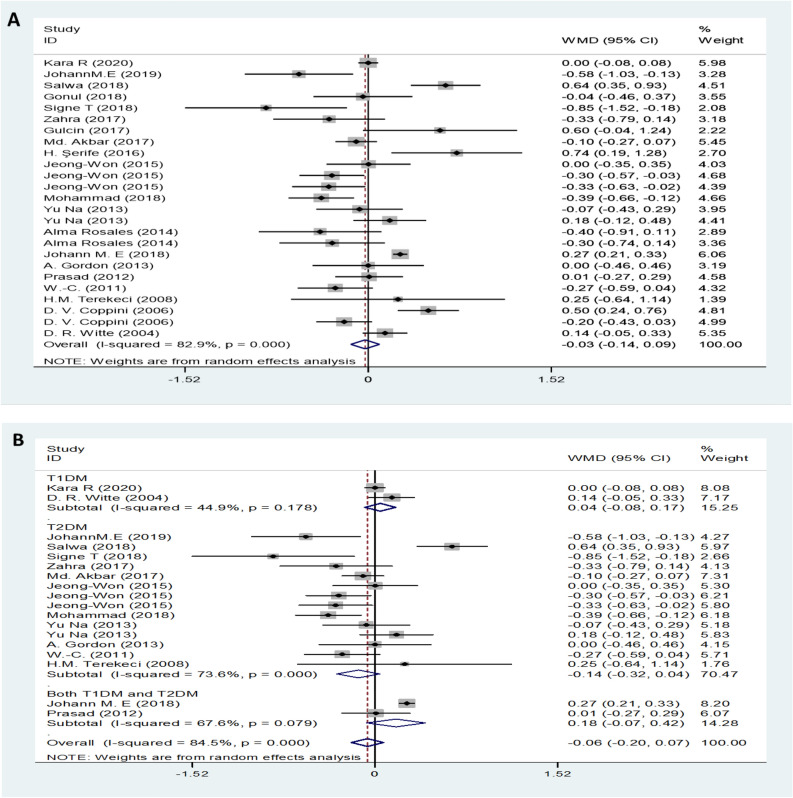
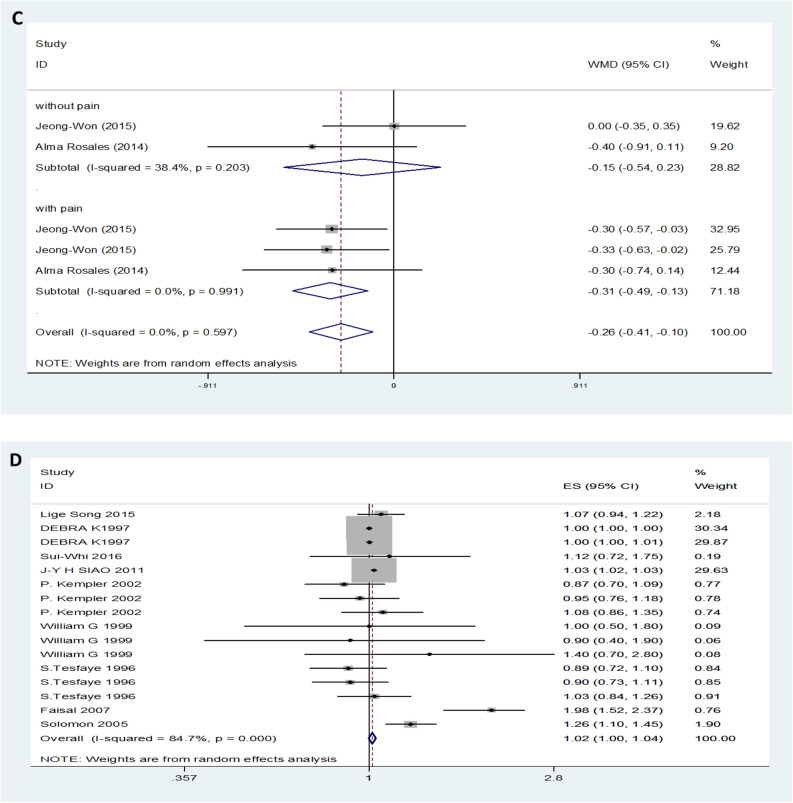
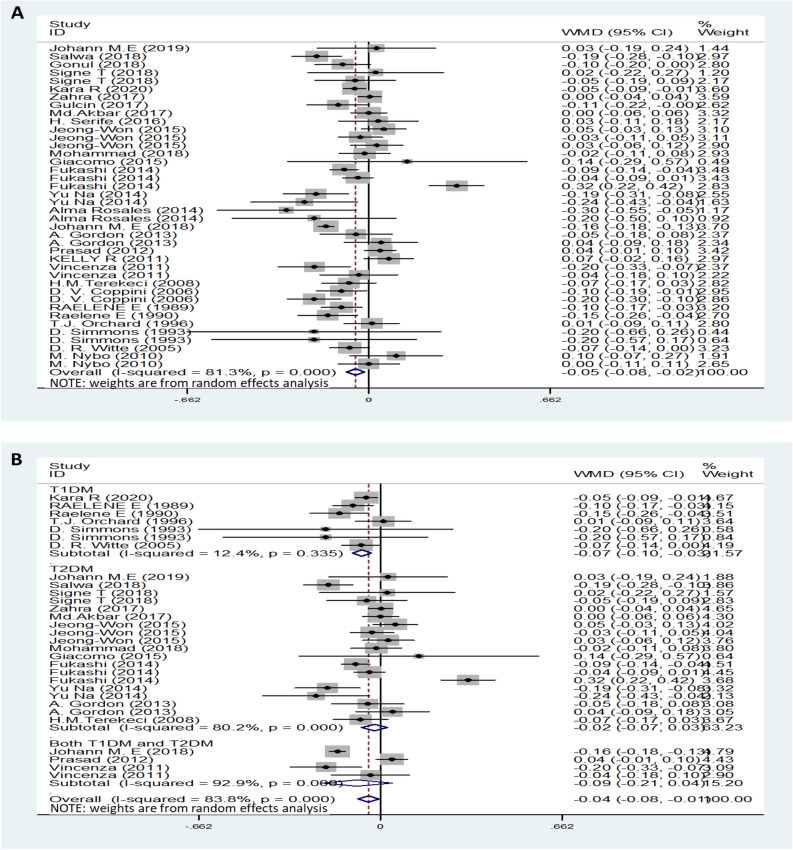
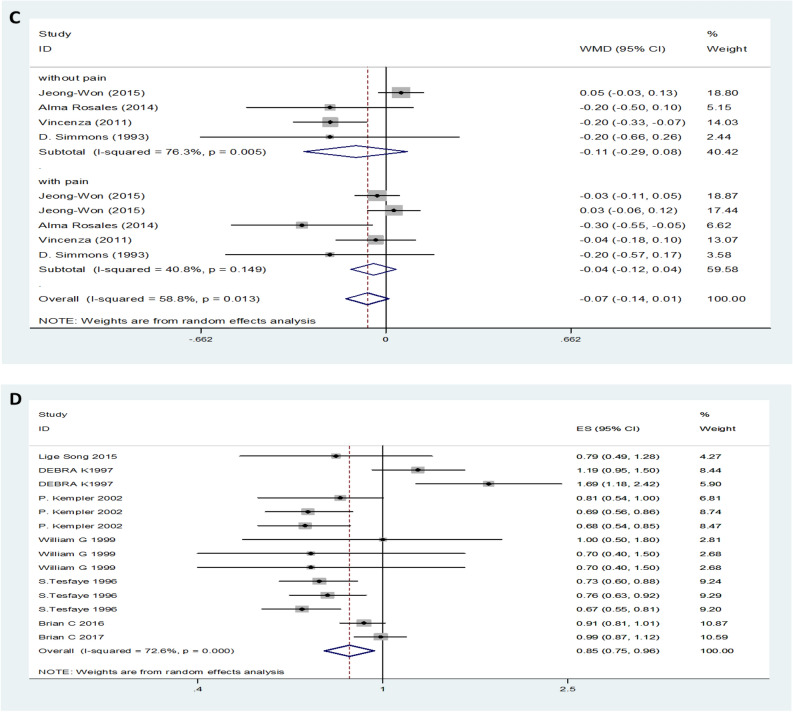
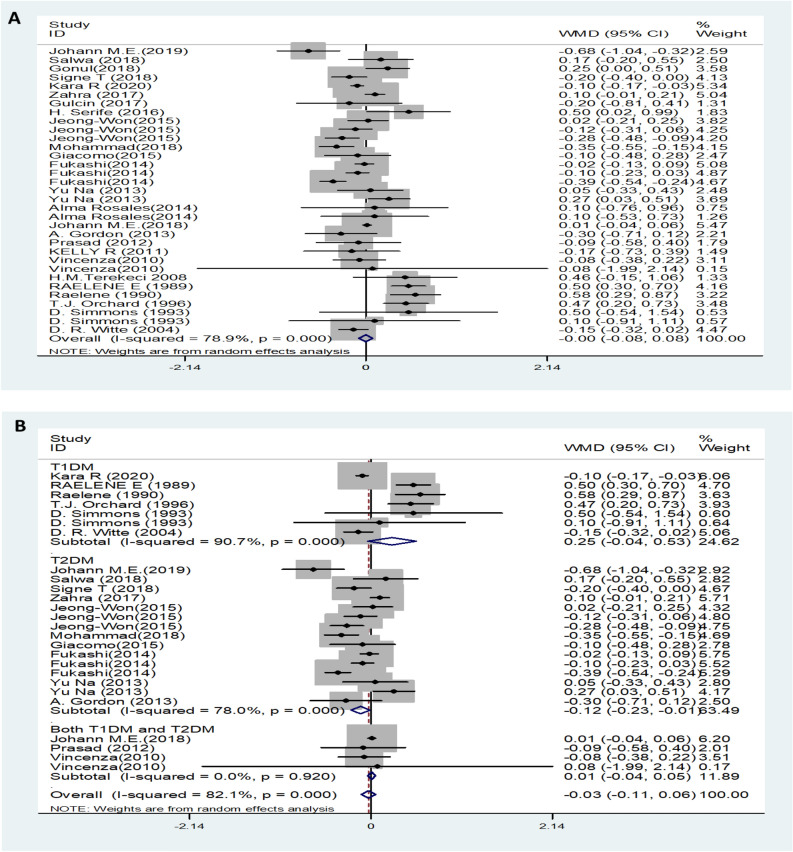
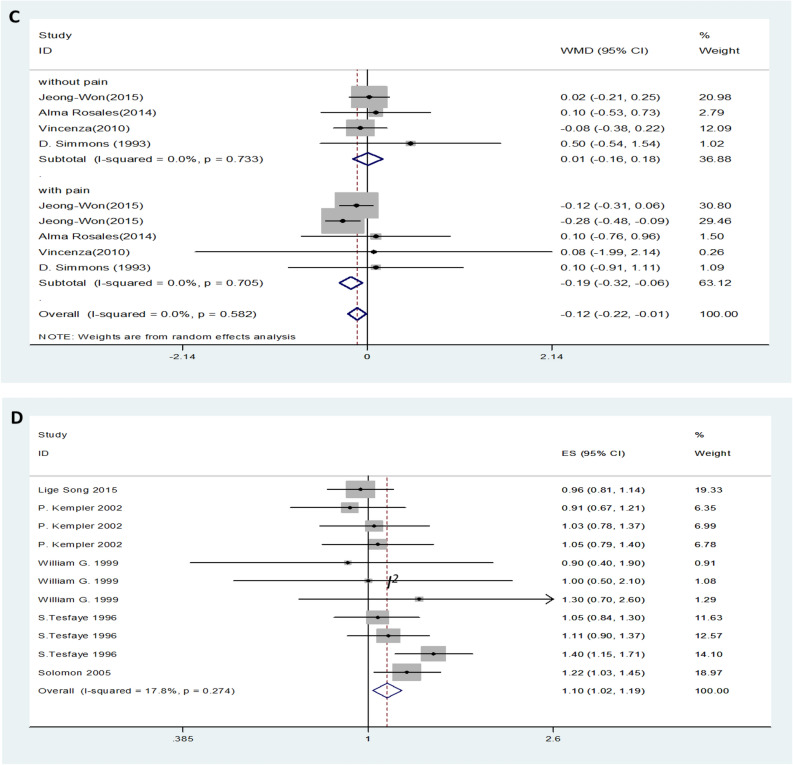
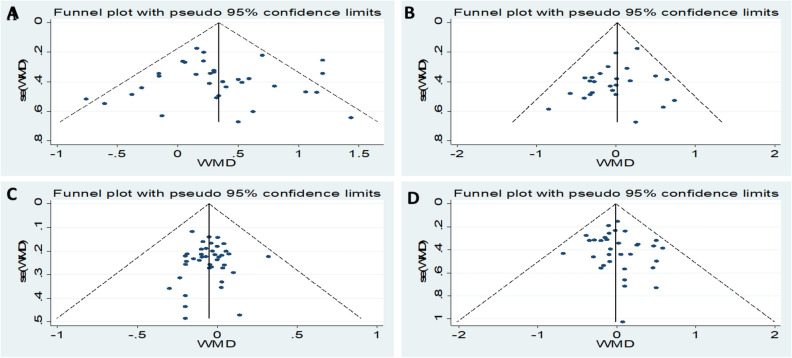
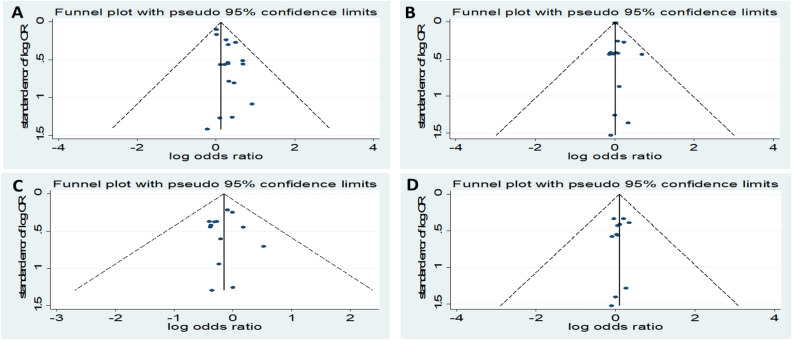
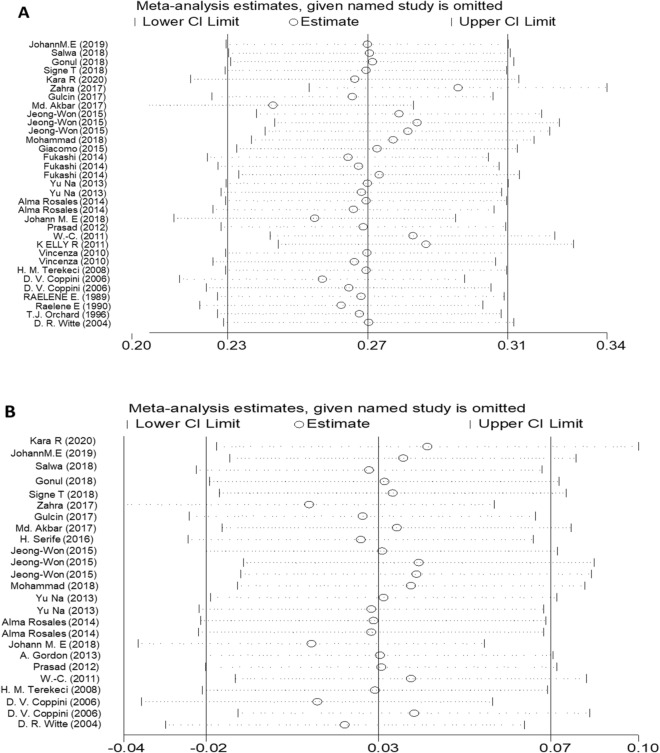
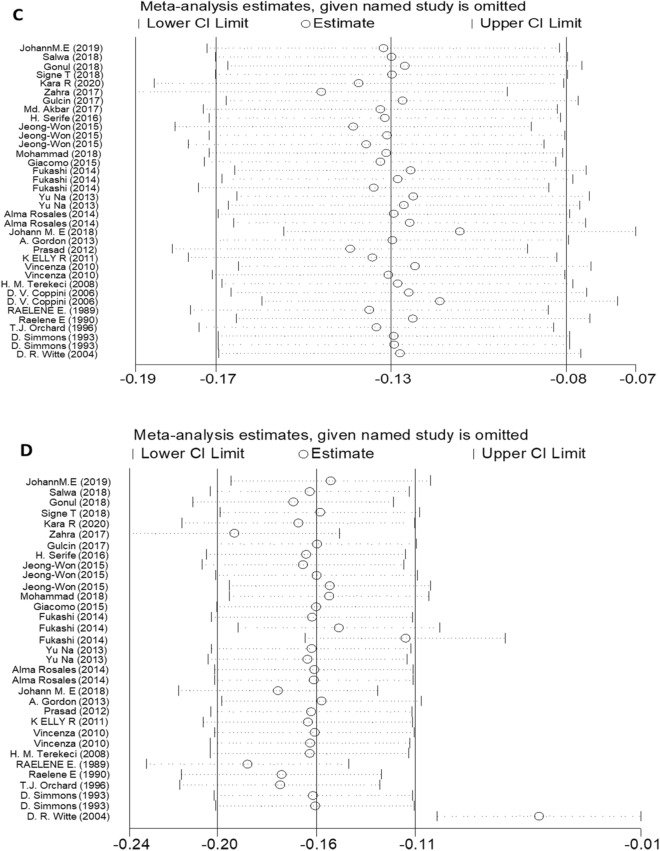
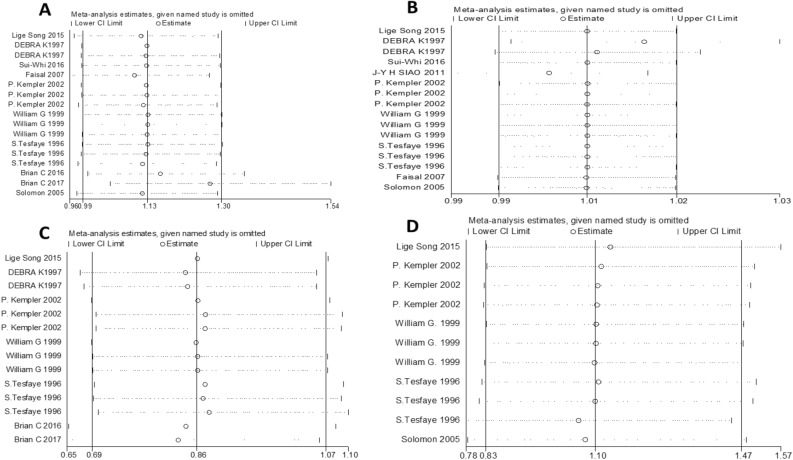
Whether the lipid profile in diabetic patients is associated with diabetic neuropathy (DN) development remains ambiguous, as does the predictive value of serum lipid levels in the risk of DN. Here, we performed the first meta-analysis designed to investigate the relationship between DN and the serum levels of triglyceride (TG), total cholesterol (TC), high-density lipoprotein cholesterol (HDL), and low-density lipoprotein cholesterol (LDL). Candidate studies were comprehensively identified by searching PubMed, Embase, Cochrane Library and Web of Science databases up to May 2020. Observational methodological meta-analysis was conducted to assess the relationships of TG, TC, HDL, and LDL levels with DN. Changes in blood lipids were used to estimate the effect size. The results were pooled using a random-effects or fixed-effects model. Potential sources of heterogeneity were explored by subgroup analysis. Various outcomes were included, and statistical analyses were performed using STATA (Version 12.0). Mean differences (MDs) and odds ratios (ORs) with 95% confidence intervals (CIs) were estimated. The Newcastle-Ottawa Scale (NOS) was applied to assess the methodological quality. I2 statistics were calculated to evaluate statistical heterogeneity. Funnel plots were utilized to test for publication bias. A sensitivity analysis was performed by omitting each study one by one. Thirty-nine clinical trials containing 32,668 patients were included in the meta-analysis. The results demonstrated that DN patients showed higher TG and lower HDL levels (MD = 0.34, 95% CI: 0.20-0.48 for TG; MD = -0.05, 95% CI: -0.08--0.02, I2 = 81.3% for HDL) than controls. Subgroup analysis showed that patients with type 1 diabetes mellitus (T1DM) neuropathy had elevated TG levels in their serum (MD = 0.25, 95% CI: 0.16-0.35,I2 = 64.4% for T1DM). However, only patients with T1DM neuropathy had reduced serum HDL levels, and there was no significant difference in serum HDL levels between patients with T2DM neuropathy and controls (MD = -0.07, 95% CI: -0.10--0.03, I2 = 12.4% for T1DM; MD = -0.02, 95% CI: -0.07-0.03, I2 = 80.2% for T2DM). TC and LDL levels were not significantly different between DN patients and controls (MD = -0.03, 95% CI: -0.14-0.09, I2 = 82.9% for TC; MD = -0.00, 95% CI: -0.08-0.08, I2 = 78.9% for LDL). In addition, compared with mild or painless DN patients, those with moderate or severe pain DN pain had significantly reduced serum TC and LDL levels (MD = -0.31, 95% CI: -0.49--0.13, I2 = 0% for TC; MD = -0.19, 95% CI: -0.32--0.08, I2 = 0% for LDL). TG levels and HDL levels did not vary considerably between patients with mild or painless DN and those with moderate or severe DN pain patients (MD = 0.12, 95% CI: -0.28-0.51, I2 = 83.2% for TG; MD = -0.07, 95% CI:-0.14-0.01, I2 = 58.8% for HDL). Furthermore, people with higher TG and LDL levels had higher risk of DN (OR = 1.36, 95% CI: 1.20-1.54, I2 = 86.1% for TG and OR = 1.10, 95% CI: 1.02-1.19, I2 = 17.8% for LDL). Conversely, high serum HDL levels reduced the risk of DN (OR = 0.85, 95% CI: 0.75-0.96, I2 = 72.6%), while TC levels made no significant difference with the risk of DN (OR = 1.02, 95% CI: 1.00-1.04, I2 = 84.7%). This meta-analysis indicated that serum lipid profile changes are among the biological characteristics of DN. Lipid levels should be explored as routine laboratory markers for predicting the risk of DN, as they will help clinicians choose appropriate therapies, and thus optimize the use of available resources.
Conflict of interest statement
The authors declare no competing interests.
Figures
Similar articles
-
Correlation Analysis and Intervention Study on Disturbance of Lipid Metabolism and Diabetic Peripheral Neuropathy.Comput Math Methods Med. 2022 Feb 22;2022:2579692. doi: 10.1155/2022/2579692. eCollection 2022. Comput Math Methods Med. 2022. Retraction in: Comput Math Methods Med. 2023 Jun 28;2023:9830307. doi: 10.1155/2023/9830307. PMID: 35242203 Free PMC article. Retracted. Clinical Trial.
-
Systematic review and meta-analysis of Coptis chinensis Franch.-containing traditional Chinese medicine as an adjunct therapy to metformin in the treatment of type 2 diabetes mellitus.Front Pharmacol. 2022 Sep 8;13:956313. doi: 10.3389/fphar.2022.956313. eCollection 2022. Front Pharmacol. 2022. PMID: 36160405 Free PMC article.
-
Effect of fenugreek consumption on serum lipid profile: A systematic review and meta-analysis.Phytother Res. 2020 Sep;34(9):2230-2245. doi: 10.1002/ptr.6690. Epub 2020 May 8. Phytother Res. 2020. PMID: 32385866
-
Maternal lipid profile and risk of pre-eclampsia in African pregnant women: A systematic review and meta-analysis.PLoS One. 2020 Dec 23;15(12):e0243538. doi: 10.1371/journal.pone.0243538. eCollection 2020. PLoS One. 2020. PMID: 33362205 Free PMC article.
-
Correlation between PPARG Pro12Ala Polymorphism and Therapeutic Responses to Thiazolidinediones in Patients with Type 2 Diabetes: A Meta-Analysis.Pharmaceutics. 2023 Jun 20;15(6):1778. doi: 10.3390/pharmaceutics15061778. Pharmaceutics. 2023. PMID: 37376225 Free PMC article. Review.
Cited by
-
Lipid Profile Paradox: Investigating Improved Lipid Levels in Diabetic Mellitus Patients with Foot Ulcer Infections-A Prospective Descriptive Study.Diagnostics (Basel). 2023 Nov 25;13(23):3531. doi: 10.3390/diagnostics13233531. Diagnostics (Basel). 2023. PMID: 38066772 Free PMC article.
-
Renal impairment is one of appropriate predictors of future diabetic peripheral neuropathy: a hospital-based 6-year follow-up study.Sci Rep. 2022 Mar 28;12(1):5240. doi: 10.1038/s41598-022-09333-3. Sci Rep. 2022. PMID: 35347201 Free PMC article.
-
Severe Hypertriglyceridaemia and Chylomicronaemia Syndrome-Causes, Clinical Presentation, and Therapeutic Options.Metabolites. 2023 Apr 30;13(5):621. doi: 10.3390/metabo13050621. Metabolites. 2023. PMID: 37233662 Free PMC article. Review.
-
Flavonoids regulating NLRP3 inflammasome: a promising approach in alleviating diabetic peripheral neuropathy.Inflammopharmacology. 2025 May;33(5):2231-2262. doi: 10.1007/s10787-025-01729-7. Epub 2025 Apr 9. Inflammopharmacology. 2025. PMID: 40205269 Free PMC article. Review.
-
Causal relationships between plasma lipidome and diabetic neuropathy: a Mendelian randomization study.Front Endocrinol (Lausanne). 2025 Jan 15;15:1398691. doi: 10.3389/fendo.2024.1398691. eCollection 2024. Front Endocrinol (Lausanne). 2025. PMID: 39882262 Free PMC article.
References
Publication types
MeSH terms
Substances
LinkOut - more resources
Full Text Sources
Other Literature Sources
Medical
Research Materials
Miscellaneous
