. 2021 Jan 12;11(1):491.
doi: 10.1038/s41598-020-79869-9.

CTCF and EGR1 suppress breast cancer cell migration through transcriptional control of Nm23-H1

Affiliations

CTCF and EGR1 suppress breast cancer cell migration through transcriptional control of Nm23-H1

Ka Ming Wong et al. Sci Rep. .

Abstract

Tumor metastasis remains an obstacle in cancer treatment and is responsible for most cancer-related deaths. Nm23-H1 is one of the first metastasis suppressor proteins discovered with the ability to inhibit metastasis of many cancers including breast, colon, and liver cancer. Although loss of Nm23-H1 is observed in aggressive cancers and correlated with metastatic potential, little is known regarding the mechanisms that regulate its cellular level. Here, we examined the mechanisms that control Nm23-H1 expression in breast cancer cells. Initial studies in aggressive MDA-MB-231 cells (expressing low Nm23-H1) and less invasive MCF-7 cells (expressing high Nm23-H1) revealed that mRNA levels correlated with protein expression, suggesting that transcriptional mechanisms may control Nm23-H1 expression. Truncational analysis of the Nm23-H1 promoter revealed a proximal and minimal promoter that harbor putative binding sites for transcription factors including CTCF and EGR1. CTCF and EGR1 induced Nm23-H1 expression and reduced cell migration of MDA-MB-231 cells. Moreover, CTCF and EGR1 were recruited to the Nm23-H1 promoter in MCF-7 cells and their expression correlated with Nm23-H1 levels. This study indicates that loss of Nm23-H1 in aggressive breast cancer is apparently caused by downregulation of CTCF and EGR1, which potentially drive Nm23-H1 expression to promote a less invasive phenotype.


Conflict of interest statement

The authors declare no competing interests.

Figures
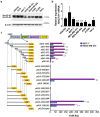
Figure 1
Figure 1
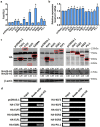
Analysis of Nm23-H1 protein, mRNA, and promoter activity in breast cancer cell lines. Confluent cell cultures were lysed and analyzed for Nm23-H1 expression by Western blot with corresponding antibodies (a) or RT-qPCR (b). (c) MCF-7 and MDA-MB-231 cells were transiently transfected with Nm23-H1 promoter constructs and pRL-TK control vector and lysed 48 h after transfection. Luciferase activities were measured using the Dual-Luciferase Reporter Assay System (Promega). RLU values of reference constructs: MCF-7/pGL3-Empty, Firefly luciferase (10,431 ± 311), Renilla luciferase (92,978 ± 1766); MDA-MB-231/pGL3-Empty, Firefly luciferase (1967 ± 75), Renilla luciferase (10,371 ± 183). Luciferase activities were calculated using firefly luciferase values normalized to renilla luciferase values. Data represent the mean and standard deviation of three independent trials. *p < 0.05.
Figure 2
Figure 2
In silico screening of transcription factor binding sites. (a) The proximal (− 244 to − 109 bp) and minimal promoter (− 109 to − 1 bp) region of the Nm23-H1 promoter were analyzed in MatInspector (matrix similarity threshold > 0.8) and TRANSFAC (matrix score threshold > 0.8) for potential transcription factor binding events. Consistently predicted transcription factors and corresponding binding sites 1–11 were selected for mutagenesis. Mutants of the proximal promoter (b) and minimal promoter (c) were transiently transfected in MCF-7 or MDA-MB-231 cells and lysed 48 h after transfection. Luciferase assays were performed using the Dual-Luciferase Reporter Assay System (Promega). RLU values of reference constructs: MCF-7/pGL3-244, Firefly luciferase (2,749,183 ± 106,184), Renilla luciferase (208,951 ± 7441); MCF-7/pGL3-109, Firefly luciferase (689,809 ± 49,773), Renilla luciferase (131,826 ± 3867); MDA-MB-231/pGL3-244, Firefly luciferase (138,241 ± 401), Renilla luciferase (24,492 ± 1526); MDA-MB-231/pGL3-109, Firefly luciferase (689,809 ± 49,773), Renilla luciferase (131,826 ± 3867). Data represent the mean and standard deviation of three independent trials. *Significance with wild-type promoter, p < 0.05.
Figure 3
Figure 3
Transcription factors regulating Nm23-H1 in MDA-MB-231 cells. (a) MDA-MB-231 cells were transiently transfected with HA-tagged transcription factors and pGL3-1291 and lysed 48 h after transfection. Luciferase assays were performed using the Dual-Luciferase Reporter Assay System (Promega). RLU values of pGL3-1291/pcDNA3.1: Firefly luciferase (310,113 ± 8524), Renilla luciferase (60,130 ± 5091). *Significant stimulation as compared to pcDNA3.1, p < 0.05. (b) RNA extraction was performed with TRIzol in transiently transfected MDA-MB-231 cells, followed by cDNA synthesis and qPCR. *Significance with pcDNA3.1, p < 0.05. Data represent the mean and standard deviation of three independent trials. (c) Proteins were separated on 15% acrylamide gels and immunoblots were probed with corresponding antibodies. Corresponding protein bands are marked by red boxes. Quantification of Nm23-H1/H2 protein bands was performed with ImageJ. Data are shown as a representative experiment from three independent trials. (d) Protein-DNA interactions were crosslinked and the chromatin was sheared into 200–500 bp fragments by sonication. Complexes were pulled down by the HA-antibody and protein G agarose beads. ‘Input’ is the chromatin collected before antibody incubation. ‘Beads only’ represents the chromatin containing protein G agarose beads without antibodies and serves as a negative control. Data are shown as a representative experiment from three independent trials.
Figure 4
Figure 4
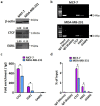
ChIP-qPCR of endogenous transcription factors binding to the NME1 promoter in breast cancer cells. (a) MCF-7 and MDA-MB-231 cells were lysed and proteins were separated on 12% acrylamide gels. Quantification of protein bands was performed with ImageJ. (b) Protein-DNA complexes were pulled down by primary antibodies and protein G agarose beads, followed by qPCR. DNA gel electrophoresis was performed to analyze the presence of a 244 bp promoter region (− 244 to − 1 bp). ‘Input’ is the chromatin collected before antibody incubation. IgG (Mouse) and IgG (Rabbit) serve as antibody isotype controls. (c) Fold enrichment was calculated as fold change of Ct over corresponding IgG isotype controls. (d) Percentage of Input was calculated using Ct value of Input that represents 1% of starting chromatin. Data represent the mean and standard deviation of three independent trials. *p < 0.05.
Figure 5
Figure 5
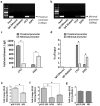
Binding of EGR1 to the NME1 proximal and minimal promoters in MCF-7 cells. Protein-DNA complexes were pulled down by primary antibodies and protein G agarose beads, followed by qPCR. DNA gel electrophoresis was performed to analyze the presence of (a) the 136 bp proximal promoter (− 244 to − 109 bp) and (b) the 109 bp minimal promoter (− 109 to − 1 bp). ‘Input’ is the chromatin collected before antibody incubation. IgG (Mouse) and IgG (Rabbit) serve as antibody isotype controls. Data are shown as a representative experiment from three independent experiments. (c) Fold enrichment was calculated as fold change of Ct over corresponding IgG isotype controls. (d) Percentage of Input was calculated using Ct value of Input that represents 1% of starting chromatin. (e,f,g) MDA-MB-231 cells were transiently transfected with CTCF or EGR1 and promoter mutants. Cells were lysed 48 h after transfection and luciferase assays were performed using the Dual-Luciferase Reporter Assay System (Promega). Fold change was calculated as the increase in promoter activity by EGR1 or CTCF relative to pcDNA3.1 control. Data represent the mean and standard deviation of three independent trials. *p < 0.05.
Figure 6
Figure 6
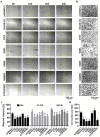
Cell migration of MDA-MB-231 cells expressing transcription factors. (a,c) Transiently transfected cells were grown to full confluency and scratched with a yellow pipette tip. Photos were taken at different time points with a microscope at ×10 magnification. Cell migration was quantified as percentage of wound closure using ImageJ and MRI Wound Healing Tool plugin. (b,d) Transiently transfected cells were seeded into the upper chamber of Transwell inserts and allowed for migration for 16 h. Photos were taken with a microscope at ×10 magnification and the number of migrated cells was quantified using ImageJ. Data represent the mean and standard deviation of three independent trials. *Significance with pcDNA3.1, p < 0.05.
Figure 7
Figure 7
siRNA knockdown of CTCF and EGR1 in MCF-7 cells. (a,d) Untransfected MCF-7 cells or MCF-7 cells transiently transfected with siCTCF, siEGR1, or siScramble, were lysed 48 h after transfection. Proteins were separated on 12% polyacrylamide gels and immunoblots were probed with corresponding antibodies. Quantification of Nm23-H1 bands was performed with ImageJ. Data are shown as a representative experiment from three independent trials. (b) Luciferase assays were performed in transiently transfected cells using the Dual-Luciferase Reporter System (Promega) *Significant inhibition as compared to siScramble, p < 0.05. (c) RNA extraction was performed in transiently transfected MCF-7 cell, followed by cDNA synthesis and qPCR. *Significance with siScramble, p < 0.05. Data represent the mean and standard deviation of three independent trials.
Figure 8
Figure 8
Cell migration of MCF-7 cells upon knockdown of CTCF and EGR1. (a,c) Transiently transfected cells were grown to full confluency and scratched with a yellow pipette tip. Photos were taken at different time points with a microscope at ×10 magnification. Cell migration was quantified as percentage of wound closure using ImageJ and MRI Wound Healing Tool plugin. (b,d) Transiently transfected cells were seeded into the upper chamber of Transwell inserts and allowed for migration for 48 h. Photos were taken with a microscope at ×10 magnification and the number of migrated cells was quantified using ImageJ. Data represent the mean and standard deviation of three independent trials. *Significance with siScramble, p < 0.05.
Figure 9
Figure 9
Cell migration of MCF-7 cells upon Nm23-H1 knockdown and CTCF or EGR1 overexpression. (a,c) Transiently transfected cells were grown to full confluency and scratched with a yellow pipette tip. Photos were taken at different time points with a microscope at ×10 magnification. Cell migration was quantified as percentage of wound closure using ImageJ and MRI Wound Healing Tool plugin. (b,d) Transiently transfected cells were seeded into the upper chamber of Transwell inserts and allowed for migration for 48 h. Photos were taken with a microscope at ×10 magnification and the number of migrated cells was quantified using ImageJ. Data represent the mean and standard deviation of three independent trials. *Significance with siScramble + pcDNA3.1, p < 0.05.
Figure 10
Figure 10
Proposed model of pathways regulating Nm23-H1 expression. CTCF and EGR1 are recruited to the promoter of NME1 to activate transcription, potentially contributing to metastasis suppression. The expression of Nm23-H1 can be further regulated by the action of AKT, which activates EGR1 and inhibits FOXO3, a negative regulator of NME1 transcription. In addition, CRE regions in the promoters of EGR1 and NME1 may be targeted by CREB to drive the expression of Nm23-H1. The low expression of CTCF and EGR1 in aggressive breast cancer cells may contribute to decreased Nm23-H1 protein levels and metastasis.

Similar articles

Cited by

References

    1. Bohl CR, Harihar S, Denning WL, Sharma R, Welch DR. Metastasis suppressors in breast cancers: Mechanistic insights and clinical potential. J. Mol. Med. 2014;92:13–30. doi: 10.1007/s00109-013-1109-y. - DOI - PMC - PubMed
    1. Steeg PS, et al. Evidence for a novel gene associated with low tumor metastatic potential. J. Natl. Cancer Inst. 1988;80:200–204. doi: 10.1093/jnci/80.3.200. - DOI - PubMed
    1. Leone A, et al. Reduced tumor incidence, metastatic potential, and cytokine responsiveness of nm3-transfected melanoma cells. Cell. 1991;65:25–35. doi: 10.1016/0092-8674(91)90404-M. - DOI - PubMed
    1. Hartsough MT, Steeg PS. Nm23/nucleoside diphosphate kinase in human cancers. J. Bioenergy Biomembr. 2000;32:301–308. doi: 10.1023/A:1005597231776. - DOI - PubMed
    1. Tan CY, Chang CL. NDPKA is not just a metastasis suppressor–be aware of its metastasis-promoting role in neuroblastoma. Lab. Investig. 2018;98:219–227. doi: 10.1038/labinvest.2017.105. - DOI - PubMed

Publication types

MeSH terms