. 2021 Jan 12;11(1):644.
doi: 10.1038/s41598-020-80060-3.

Ephrin A4-ephrin receptor A10 signaling promotes cell migration and spheroid formation by upregulating NANOG expression in oral squamous cell carcinoma cells

Affiliations

Ephrin A4-ephrin receptor A10 signaling promotes cell migration and spheroid formation by upregulating NANOG expression in oral squamous cell carcinoma cells

Yu-Lin Chen et al. Sci Rep. .

Abstract

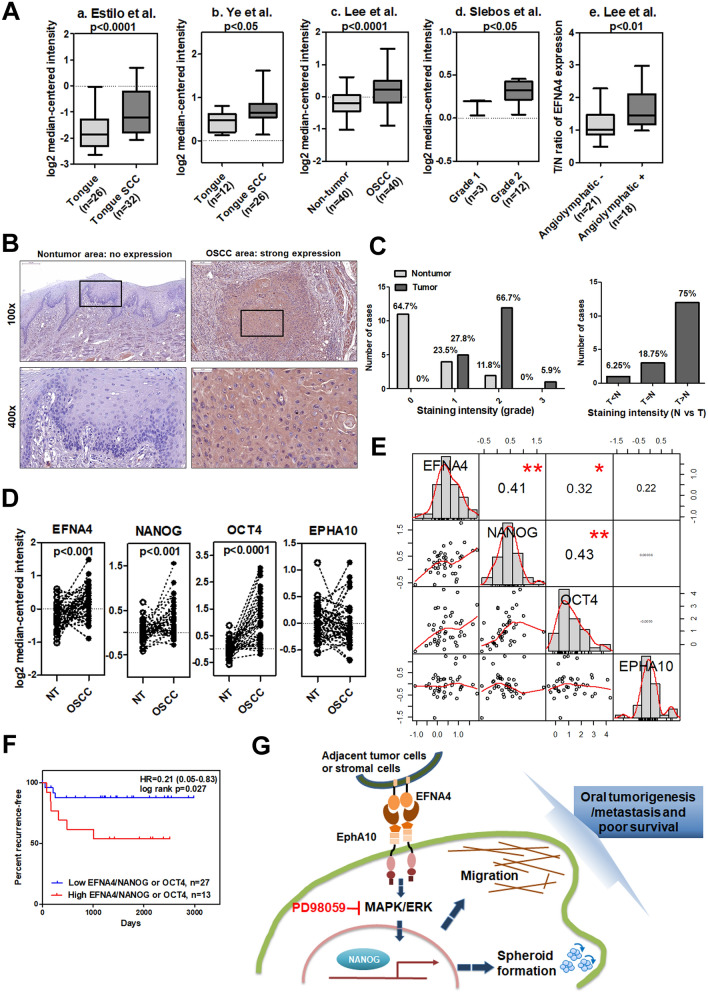
Ephrin type-A receptor 10 (EPHA10) has been implicated as a potential target for breast and prostate cancer therapy. However, its involvement in oral squamous cell carcinoma (OSCC) remains unclear. We demonstrated that EPHA10 supports in vivo tumor growth and lymphatic metastasis of OSCC cells. OSCC cell migration, epithelial mesenchymal transition (EMT), and sphere formation were found to be regulated by EPHA10, and EPHA10 was found to drive expression of some EMT- and stemness-associated transcription factors. Among EPHA10 ligands, exogenous ephrin A4 (EFNA4) induced the most OSCC cell migration and sphere formation, as well as up-regulation of SNAIL, NANOG, and OCT4. These effects were abolished by extracellular signal-regulated kinase (ERK) inhibition and NANOG knockdown. Also, EPHA10 was required for EFNA4-induced cell migration, sphere formation, and expression of NANOG and OCT4 mRNA. Our microarray dataset revealed that EFNA4 mRNA expression was associated with expression of NANOG and OCT4 mRNA, and OSCC patients showing high co-expression of EFNA4 with NANOG or OCT4 mRNA demonstrated poor recurrence-free survival rates. Targeting forward signaling of the EFNA4-EPHA10 axis may be a promising therapeutic approach for oral malignancies, and the combination of EFNA4 mRNA and downstream gene expression may be a useful prognostic biomarker for OSCC.


Conflict of interest statement

The authors declare no competing interests.

Figures

Figure 1
Figure 1
EPHA10 is required for tumorigenesis and metastasis of OSCC cells. (A) Expression of EPHA10 in 20 types of cancer versus corresponding normal tissues using the Oncomine database with the threshold of fold change ≥ 2, p ≤ 10–4, and gene rank ≥ top 10%. Red and blue, respectively, indicate the numbers of datasets with statistically significant increases and decreases in EPHA10 gene expression. (B) EPHA10 expression in human oral keratinocytes (HOK), immortalized dysplastic oral keratinocytes (DOK), and 7 OSCC cell lines was examined by western blotting. Protein levels were normalized to an internal control (α-tubulin). Relative ratios were determined by dividing the EPHA10 protein level in each cell type by that in HOK cells. (C) EPHA10 protein levels in LN1-1 cells expressing EPHA10-specific shRNA and vector control (pLKO-GFP) were determined by western blot. Protein levels were normalized to α-tubulin. Relative ratios were determined by dividing the EPHA10 protein level in each expression variant by that in the pLKO-GFP vector-expressing cells. (D) EPHA10 protein levels in LN1-1 cells expressing pLKO-GFP (green line), sh3 (dark green line), and sh5 (pink line) were determined by fluorescence activated cell sorting (FACS). Relative EPHA10 expression was determined by dividing the fluorescent intensity in each expression variant by that in the pLKO-GFP vector-expressing cells. (E) Tumor weights and volumes in mice orthotopically injected with LN1-1 pLKO-GFP (n = 9) or EPHA10 sh3 cells (n = 8). (F) Ki-67 expression by immunohistochemistry (IHC) in LN1-1 pLKO-GFP (n = 9) and EPHA10 sh3 tumors (n = 7). Left: Representative fields of IHC stained sections. Scale bars, 20 μm. Right: The percentages of Ki-67-positive cells per field were calculated for each group. Error bars represent SE; *p < 0.05; ***p < 0.001.
Figure 2
Figure 2
EPHA10 influences cell migration, epithelial–mesenchymal transition, tumorsphere formation and gene expression in LN1-1 cells. (A) Left: Representative images of migrated cells. Scale bars, 100 μm. Right: Relative migration activity of the EPHA10 knockdown cells was calculated by normalizing the mean number of migrated cells per field (EPHA10 sh3 and sh5, n = 10) to that of the control cells (pLKO-GFP, n = 10). (B) Morphology of LN1-1 pLKO-GFP, EPHA10 sh3, and EPHA10 sh5 cells. Scale bars, 20 μm. (C) Immunoblot analysis of α-catenin, β-catenin, vimentin, and E-cadherin proteins in LN1-1 cells with EPHA10 knockdown (EPHA10 sh1–5) and the control vector (pLKO-GFP). Protein levels were normalized to α-tubulin. Relative ratios were determined by dividing the level of the protein of interest in each expression variant by that in the pLKO-GFP vector-expressing cells. (D) Left: Representative images of tumorspheres in LN1-1 pLKO-GFP, EPHA10 sh3, and EPHA10 sh5 cells. Scale bars, 100 μm. Right: Relative sphere formation activity was determined by normalizing the mean number of spheres per field for the EPHA10 sh3 and sh5 cells (n = 2) to that of the pLKO-GFP cells (n = 2). (E) The levels of TWIST, SNAIL, SLUG, OCT4, NANOG, and SOX2 mRNA in LN1-1 pLKO-GFP, EPHA10 sh3, and EPHA10 sh5 cells were determined by qRT-PCR. The amplifications were first normalized to β-actin (internal control). For each gene, the relative expression in LN1-1 EPHA10 sh3 and EPHA10 sh5 cells (n = 3) was normalized to that in the LN1-1 pLKO-GFP cells (n = 3). Bars represent SE; *p < 0.05; **p < 0.01; ***p < 0.001.
Figure 3
Figure 3
Exogenous EFNA4-Fc enhanced cell migration and sphere formation of OEC-M1 cells. (A) Representative growth curves of OEC-M1 cells treated with 0.1 or 0.5 μg/ml EFNA4-Fc (n = 4) or 0.5 μg/ml IgG control (n = 4) based on MTS assay data. (B) Left: Representative CFSE cell division assay data from OEC-M1 cells treated with 0.1 or 0.5 μg/ml EFNA4-Fc (n = 2) or 0.5 μg/ml IgG control (n = 2). The interval bar indicates cell division signal on day 3. Right: The percentage of the cell population within the interval bar limits. (C) Left: Representative cell death analysis via PI/Annexin V double staining of OEC-M1 cells treated with 0.1 or 0.5 μg/ml EFNA4-Fc (n = 2) or 0.5 μg/ml IgG control (n = 2). Right: The percentage of cell death, including quadrants Q1, Q2, and Q3. (D) Left: Representative images of migrated cells. Scale bars, 100 μm. Right: Relative migration activity was determined by normalizing the mean number of migrated cells per field of EFNA4-Fc treated cells (n = 10) to that of the IgG-treated cells (n = 10). (E) Left: Representative images of tumorspheres. Scale bars, 100 μm. Right: Sphere formation in OEC-M1 cells treated with 0.1 or 0.5 μg/ml EFNA4-Fc or 0.5 μg/ml IgG control in sphere culture. Relative sphere formation activity in EFNA4-treated cells (n = 2) was determined by normalizing the mean number of spheres per well to that of the IgG-treated cells (n = 2). (F) Relative levels of TWIST, SNAIL, SLUG, OCT4, NANOG, and SOX2 mRNA in OEC-M1 cells treated with 0.1 or 0.5 μg/ml EFNA4-Fc or 0.5 μg/ml IgG as determined by qRT-PCR. The amplifications were first normalized to β-actin (internal control). The relative mRNA expression in EFNA4-treated OEC-M1 cells (n = 3) was then normalized to that in IgG-treated cells (n = 3). Bars represent SE. *p < 0.05; **p < 0.01; ***p < 0.001.
Figure 4
Figure 4
EFNA4-enhanced cellular functions were inhibited by ERK blockage. (A) Detection of EFNA4-Fc-stimulated ERK activation in OEC-M1 cells. Upper: Immunoblot assay showing total and phosphorylated ERK levels in OEC-M1 cells treated with 0.1 μg/ml EFNA4-Fc for 10, 30, 60, 120, and 360 min. Lower: The phosphorylated ERK level was normalized to that of total ERK. The relative ERK activity was calculated by dividing the level of normalized phosphorylated ERK in OEC-M1 cells treated with EFNA4-Fc (n = 2) by that in untreated cells (n = 2). (B) Left: Representative images of migrated cells. Scale bars, 100 μm. Right: Relative migration activity was determined by normalizing the mean number of migrated cells per field of OEC-M1 cells treated with 10 or 20 μM PD98059 or vehicle upon 0.1 μg/ml EFNA4-Fc stimulation (n = 10) to that of the IgG-treated cells (n = 10). (C) Left: Representative images of tumorspheres. Scale bars, 200 μm. Right: Sphere formation in OEC-M1 cells treated with 10 or 20 μM PD98059 or vehicle upon 0.1 μg/ml EFNA4-Fc stimulation. Relative sphere formation activity in OEC-M1 cells co-treated with EFNA4-Fc and PD98059 (n = 2) was determined by normalizing the mean number of spheres per well to that of the IgG-treated cells (n = 2). (D) Gene expression of SNAIL, OCT4, and NANOG in OEC-M1 cells treated with 10 or 20 μM PD98059 or vehicle upon 0.1 μg/ml EFNA4-Fc stimulation was measured by qRT-PCR. The amplifications were normalized to β-actin (internal control). Relative gene expression was obtained by dividing the normalized gene expression in the treated cells (n = 3) by that in the control cells (n = 3). (E) Detection of NANOG expression in OEC-M1 cells treated with EFNA4-Fc or co-treated with EFNA4 and PD98059 by western blot. Data was cropped and the full-length blot is presented in Supplementary Fig. S6. (F) Relative levels of NANOG mRNA in OEC-M1 cells expressing NANOG-specific shRNA and vector control (pLKO-GFP) were determined by qRT-PCR. The amplifications were first normalized to β-actin (internal control). The relative mRNA expression in NANOG knockdown OEC-M1 cells (n = 3) was normalized to that in control cells (n = 3). (G) Representative data show the relative migration potential of OEC-M1 pLKO-GFP, NANOG sh4, and NANOG sh5 cells treated with 0.1 μg/ml EFNA4-Fc or 0.1 μg/ml IgG control. Left: Representative images of migrated cells. Scale bars, 100 μm. Right: The relative migration activity was determined by normalizing the mean number of migrated cells per field of the knockdown cells treated with EFNA4-Fc (n = 10) to that of control cells (n = 10). (H) The tumorspheres in OEC-M1 pLKO-GFP, NANOG sh4, and NANOG sh5 cells treated with 0.1 μg/ml EFNA4-Fc or 0.1 μg/ml IgG control were assessed in sphere culture. Upper: Representative images of tumorspheres. Scale bars, 200 μm. Lower: Relative sphere formation activity was determined by normalizing the mean number of spheres per well of the knockdown cells treated with EFNA4-Fc (n = 4) to that of the control cells (n = 4). Bars represent SE. *p < 0.05; **p < 0.01; ***p < 0.001.
Figure 5
Figure 5
EPHA10 is required for EFNA4-induced cell migration, sphere formation, and expression of NANOG and OCT4. (A) EPHA2 and (D) EPHA10 levels in OEC-M1 cells expressing EPHA2 or EPHA10 shRNA, respectively, or the corresponding controls (pLKO-GFP) were determined by immunoblot. Protein levels were normalized to an internal control (α-tubulin). Relative ratios were determined by dividing the level of the EPHA2 or (D) EPHA10 in each expression variant by that in the pLKO-GFP vector-expressing cells. (B) Representative data show the relative migration potential of OEC-M1 pLKO-GFP, EPHA2 sh4, and EPHA2 sh5 cells or (E) pLKO-GFP, EPHA10 sh3, and EPHA10 sh5 cells treated with 0.1 μg/ml EFNA4-Fc or 0.1 μg/ml IgG control. Upper: Representative images of migrated cells. Scale bars, 100 μm. Lower: The relative migration activity as determined by normalizing the mean number of migrated cells per field of the knockdown cells treated with EFNA4-Fc (n = 10) to that of control cells (n = 10). (C) The tumorspheres in OEC-M1 pLKO-GFP, EPHA2 sh4, and EPHA2 sh5 cells or (F) pLKO-GFP, EPHA10 sh3, and EPHA10 sh5 cells treated with 0.1 μg/ml EFNA4-Fc or 0.1 μg/ml IgG control were assessed in sphere culture. Relative sphere formation activity was determined by normalizing the mean number of spheres per well of the knockdown cells treated with EFNA4-Fc (n = 2) to that of the control cells (n = 2). (G) Relative levels of NANOG, OCT4, and SNAIL mRNA in OEC-M1 pLKO-GFP, EPHA10 sh3, and EPHA10 sh5 cells treated with EFNA4-Fc or IgG were measured by qRT-PCR and normalized to β-actin (internal control). For each gene, the relative mRNA expression in EFNA4-Fc-treated EPHA10 shRNA expressing cells (n = 3) was normalized to that of control IgG-treated cells (n = 3). Bars represent SE; *p < 0.05; **p < 0.01; ***p < 0.001.
Figure 6
Figure 6
Co-expression of EFNA4 with NANOG and OCT4 mRNA in OSCC. (A) Increased EFNA4 mRNA expression in OSCC tissues compared to normal oral tissues or nontumor areas via clinical dataset analysis (a–c). Increased EFNA4 mRNA expression in OSCC of higher tumor grade or angiolymphatic invasion via clinical dataset analysis (d–e). The relative EFNA4 mRNA expression is represented by log2 median-centered intensity in datasets a–d. The average tumor/nontumor (T/N) ratio of EFNA4 mRNA is shown in dataset e. (B) Immunohistochemical analysis of EFNA4 in human OSCC samples. No expression or weak EFNA4 expression in the nontumor epithelium (left panel) and strong EFNA4 staining in the OSCC areas is visible at 100 × (scale bar, 200 μm) and 400 × (scale bar, 50 μm) magnifications. (C) Left: Scoring of EFNA4 staining intensity in 17 noncancerous epithelium samples (light grey bars) and 18 tumor samples (dark grey bars). Expression levels are scored as: 0, none; 1, weak; 2, moderate; 3, strong. Right: Comparison of the EFNA4 staining intensity between tumor areas (T) and noncancerous epithelium (N) based on each histological section. (D) EFNA4, NANOG, OCT4, and EPHA10 mRNA expression in OSCC tissues (n = 40) and corresponding nontumor (NT) tissues (n = 40). Data were obtained from clinical dataset GSE37991. The expression is represented by log2 median-centered intensity. (E) Correlations between the T/N ratios of EFNA4, EPHA10, NANOG, and OCT4 mRNA using the GSE37991 dataset and Pearson correlation analysis. Pearson's correlation coefficient (r) between two variants is shown in the center of the box at the intersect of each pair (n = 40). (F) Recurrence-free survival analysis with EFNA4, NANOG, and OCT4 mRNA expression as classification criteria using dataset GSE37991. Patients were stratified into low (EFNA4low/NANOGlow or EFNA4low/OCT4low, n = 23) and high (EFNA4high/NANOGhigh or EFNA4high/OCT4high, n = 17) groups using the median expression level of each mRNA as the cutoff. (G) The role of ephrin A4 (EFNA4)-ephrin receptor A10 (EPHA10) forward signaling in promoting OSCC tumorigenesis and metastasis. EFNA4 from adjacent tumor cells or stromal cells binds to EPHA10 on OSCC cells and induces extracellular signal-regulated kinase (ERK) activation. ERK activation drives progressive effects, including cell migration and spheroid formation, and up-regulation of NANOG expression. NANOG is required for EFNA4-induced cell migration and sphere formation (indicated as dark blue dashed arrows). Bars represent SE; *p < 0.05; **p < 0.01.

Similar articles

Cited by

References

    1. Jerjes W, et al. Clinicopathological parameters, recurrence, locoregional and distant metastasis in 115 T1–T2 oral squamous cell carcinoma patients. Head Neck Oncol. 2010;2:9. doi: 10.1186/1758-3284-2-9. - DOI - PMC - PubMed
    1. Wutzl A, et al. Mortality and causes of death after multimodality treatment for advanced oral and oropharyngeal cancer. J. Oral Maxillofac. Surg. 2007;65:255–260. doi: 10.1016/j.joms.2006.09.007. - DOI - PubMed
    1. Yang J, Weinberg RA. Epithelial-mesenchymal transition: at the crossroads of development and tumor metastasis. Dev. Cell. 2008;14:818–829. doi: 10.1016/j.devcel.2008.05.009. - DOI - PubMed
    1. Thiery JP, Acloque H, Huang RY, Nieto MA. Epithelial-mesenchymal transitions in development and disease. Cell. 2009;139:871–890. doi: 10.1016/j.cell.2009.11.007. - DOI - PubMed
    1. Thiery JP. Epithelial-mesenchymal transitions in tumour progression. Nat. Rev. Cancer. 2002;2:442–454. doi: 10.1038/nrc822. - DOI - PubMed

Publication types

MeSH terms