. 2021 Jan 12;11(1):488.
doi: 10.1038/s41598-020-80066-x.

Intermedin facilitates hepatocellular carcinoma cell survival and invasion via ERK1/2-EGR1/DDIT3 signaling cascade

Affiliations

Intermedin facilitates hepatocellular carcinoma cell survival and invasion via ERK1/2-EGR1/DDIT3 signaling cascade

Fei Xiao et al. Sci Rep. .

Abstract

As one of the most malignant cancer types, hepatocellular carcinoma (HCC) is highly invasive and capable of metastasizing to distant organs. Intermedin (IMD), an endogenous peptide belonging to the calcitonin family, has been suggested playing important roles in cancer cell survival and invasion, including in HCC. However, how IMD affects the behavior of HCC cells and the underlying mechanisms have not been fully elucidated. Here, we show that IMD maintains an important homeostatic state by activating the ERK1/2-EGR1 (early growth response 1) signaling cascade, through which HCC cells acquire a highly invasive ability via significantly enhanced filopodia formation. The inhibition of IMD blocks the phosphorylation of ERK1/2, resulting in EGR1 downregulation and endoplasmic reticulum stress (ER) stress, which is evidenced by the upregulation of ER stress marker DDIT3 (DNA damage-inducible transcript 3). The high level of DDIT3 induces HCC cells into an ER-stress related apoptotic pathway. Along with our previous finding that IMD plays critical roles in the vascular remodeling process that improves tumor blood perfusion, IMD may facilitate the acquisition of increased invasive abilities and a survival benefit by HCC cells, and it is easier for HCC cells to obtain blood supply via the vascular remodeling activities of IMD. According to these results, blockade of IMD activity may have therapeutic potential in the treatment of HCC.


Conflict of interest statement

The authors declare no competing interests.

Figures

Figure 1
Figure 1
IMD expression was higher in HCC patients with metastasis. (a) The IMD levels in healthy volunteers and in patients with HCC were presented as scatter plots with mean ± SD. (b) The IMD mRNA levels in HCC patients with or without metastasis. (c) The IMD staining scores in HCC patients with or without metastasis. (d) Representative images of the IHC staining. Significance was assessed by unpaired t test with Welch's correction.
Figure 2
Figure 2
IMD expression was higher in more aggressive HCC cells. (a) The HCC-15L and HCC-15H cells were seeded on the 6-well plates. One day after cell scratching, the recovered area was measured by Area 1 (before cell migration) minus Area 2 (after cell migration). (b) The recovered area (the mean level of the control group was set to 1) was calculated. (c) Cells were seeded on the upper chamber of the transwell system. The representative images showed the cells that invaded through the membranes were stained by Crystal Violet. (d) The Crystal-Violet-positive cells was counted (relative to the control; the mean level in the control group was set to 1.0; n = 6.). (e) The relative IMD mRNA level was measured using Real-time PCR. (f) The protein expression level of IMD was measured by Western blot analysis (WB) using the anti-IMD mAb. (g) The IMD levels in medium from HCC-15L or HCC-15H culture tested by ELISA. (h) 1 × 104 HCC-15L cells were seeded on the 24-well plate and treated with vehicle or IMD for 4 days. The cell number was counted every day from day 0 to day 4, and presented relative to that of day 0. All data were presented as scatter plots with mean ± SD (n = 6). Significance was assessed by unpaired t test with Welch's correction.
Figure 3
Figure 3
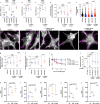
IMD promoted the formation of filopodia, which increased the HCC cell migration and invasion ability. (a) HCC-15L and HCC-15H cells treated with or without IMD were stained with AlexaFluo568-phalloidin (red) and DAPI (blue), and observed under 1000 × oil immersion lens. (b) The microscopic images were analyzed using FiloQuant. The filopodia were marked with pseudo color. (c) The filopodia density (the number of filopodia relative to border length [pixels]) were measured using 10 randomly chosen fields. (d) The filopodia length (pixels) were counted using 10 randomly chosen fields. (e,f) The cell migration and invasion ability were measured using Wound healing assay and Transwell assay (n = 6). All data were presented as scatter plots with mean ± SD. Significance was assessed by unpaired t test with Welch's correction (c,e,f, which passed the normality test) or Mann–Whitney U test (d, which did not pass the normality test).
Figure 4
Figure 4
Anti-IMD inhibited the formation of filopodia and invasive ability of HCC cells. (a) HCC-15H cells treated with or without anti-IMD were stained with AlexaFluo568-phalloidin and analyzed using FiloQuant. (b,c) The filopodia density and length were measured using 10 randomly chosen fields. (d,e) The cell migration and invasion ability were measured using Wound healing assay and Transwell assay (n = 6). All data were presented as scatter plots with mean ± SD. Significance was assessed by unpaired t test with Welch's correction (b,d,e) or Mann–Whitney u test (c).
Figure 5
Figure 5
Anti-IMD markedly inhibited the in situ tumor growth and lung metastasis. (a) 2.5 × 106 HCC-15H cells were injected subcutaneously into SCID mice. Seven days after tumor inoculation, anti-IMD mAb (5 mg/kg) or control IgG was injected into the mice through tail vein (twice a week, 4 injections). The tumor volumes were measured every 5 days until the biggest tumor reaches approximately 1500 mm3. (b) After the experiment was terminated, the tumors were removed (b), and the final volumes were measured (c). (d) The bode weight of the tumor-bearing mice were measured every 5 days. (e) The lungs from HCC-15H tumor-bearing mice treated with vehicle or the anti-IMD antibody. (f) The metastatic colonies in the lungs were counted. (g) The liver from HCC-15H tumor-bearing mice treated with vehicle or the anti-IMD antibody. (h,i) The number and covered area of metastatic colonies in the liver were counted. Data were presented with presented as growth curve (a,d) or scatter plots with mean ± SD (c,f). Significance was assessed by unpaired t test with Welch's correction (n = 6).
Figure 6
Figure 6
IMD induced phosphorylation of ERK1/2, which significantly increased EGR1 but suppressed DDIT3 transcription. (a) The square of Pearson correlation coefficient (R2) of the transcriptome sequencing analysis. R2 > 0.92 indicates good reliability. (b) Principal component analysis (PCA) showed good duplication within groups and significant differences between groups. (c) The differentially expressed genes (DEG) heatmap showed IMD or anti-IMD causing significant changes in gene transcription. (ac were extracted from the original RNA-Seq report). (d) Nine genes were found up-regulated in IMD-treated group, but significantly down-regulated in anti-IMD group. (e) The RNA-sequencing read counts of EGR1 in IMD- or anti-IMD-treated group (n = 2). (f) Seven genes were found down-regulated in IMD-treated group, but up-regulated in anti-IMD group. (g) The RNA-sequencing read counts of DDIT3 in IMD- or anti-IMD-treated group (n = 2). (h) The STRING protein interaction analysis of the EGR1 interaction network. (i) HCC-15H cells were incubated with IMD or anti-IMD for 10 min and subjected to Western blot assay. The density of the band for p-ERK1/2 (referred to total ERK1/2) is presented relative to that of the control. The mean level in the control group was set to 1.0; n = 3. (j,k) HCC-15H cells were pre-treated with PD98059; 60 min later, the cells were incubated with IMD or anti-IMD for 10 min, and the mRNA level of EGR1 or DDIT3 were measured using Real-time RT PCR. The mean level in the control group was set to 1.0; n = 6. Data were presented as scatter plots with mean ± SD (d,e,f,g,j,k were generated using the software GraphPad Prism 8.0. https://www.graphpad.com/scientific-software/prism/); and (h) was generated using the online tool STRING, https://string-db.org/cgi/input.pl?sessionId=o2YSlODG8A4I&input_page_show_search=on.) Significance was assessed by unpaired t test with Welch's correction.
Figure 7
Figure 7
EGR1 and DDIT3 were responsible for the effect of IMD on HCC cells. (a) The HCC-15H cells were transfected with shRNAs that target the 3′UTR region of EGR1 or DDIT3 (with or without Lv. EGR1 an Lv. DDIT3 rescuing). After 48 h, the mRNA levels of EGR1 or DDIT3 was measured using Real-time PCR. (b,c) The mutual effects between EGR1 and DDIT3 by measuring the mRNA level of EGR1 or DDIT3 under the condition of another gene being knockdown or overexpression (n = 3). (d) The HCC-15H cells transfected with shRNA-EGR1, shRNA-DDIT3 (with or without Lv. EGR1 an Lv. DDIT3 rescuing) were stained by AlexaFluo568-phalloidin and analyzed using FiloQuant. (e,f) The filopodia density and length were measured using 10 randomly chosen fields. (g,h) The cell migration and invasion ability were measured using Wound healing assay and Transwell assay (n = 6). (i,j) Before the HCC-15H cells were treated by different dose of anti-IMD, the cells were transfected with shRNA-DDIT3 or shRNA-EGR1 (with or without Lv. EGR1 an Lv. DDIT3 rescuing), and the cell viability (i) and apoptosis was measured (j). Data were presented as scatter plots with mean ± SD (n = 6). (ko) The RNA-sequencing read counts of PERK, IRE1, ATF6, GADD34, XBP1 in IMD- or anti-IMD-treated group (n = 2). Significance was assessed by unpaired t test with Welch's correction (a,b,c,e,g,h,j), Mann–Whitney u test (f), and p.adj comparison in the RNA-Seq DEG analysis (ko).

Similar articles

Cited by

References

    1. Finn RS, et al. Therapies for advanced stage hepatocellular carcinoma with macrovascular invasion or metastatic disease: a systematic review and meta-analysis. Hepatology. 2018;67:422–435. doi: 10.1002/hep.29486. - DOI - PubMed
    1. Sia D, Villanueva A, Friedman SL, Llovet JM. Liver cancer cell of origin, molecular class, and effects on patient prognosis. Gastroenterology. 2017;152:745–761. doi: 10.1053/j.gastro.2016.11.048. - DOI - PubMed
    1. McGuire, S. World Cancer Report 2014. Geneva, Switzerland: World Health Organization, International Agency for Research on Cancer, WHO Press, 2015. Advances in Nutrition7, 418–419 (2016). - PMC - PubMed
    1. Bruix J, Reig M, Sherman M. Evidence-based diagnosis, staging, and treatment of patients with hepatocellular carcinoma. Gastroenterology. 2016;150:835–853. doi: 10.1053/j.gastro.2015.12.041. - DOI - PubMed
    1. Bruix J, Gores GJ, Mazzaferro V. Hepatocellular carcinoma: clinical frontiers and perspectives. Gut. 2014;63:844–855. doi: 10.1136/gutjnl-2013-306627. - DOI - PMC - PubMed

Publication types

MeSH terms