. 2021 Jan 12;11(1):641.
doi: 10.1038/s41598-020-80065-y.

Transcriptomics analysis for the identification of potential age-related genes and cells associated with three major urogenital cancers

Affiliations

Transcriptomics analysis for the identification of potential age-related genes and cells associated with three major urogenital cancers

Jinlong Cao et al. Sci Rep. .

Abstract

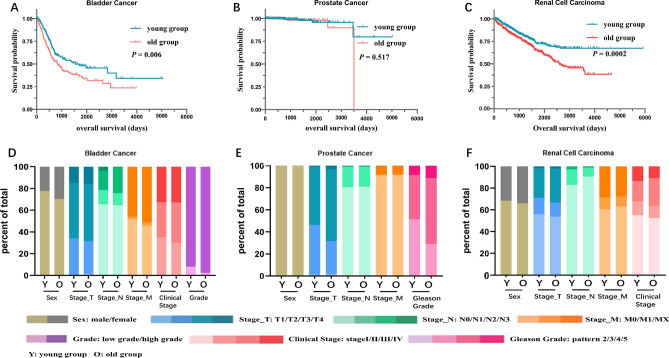
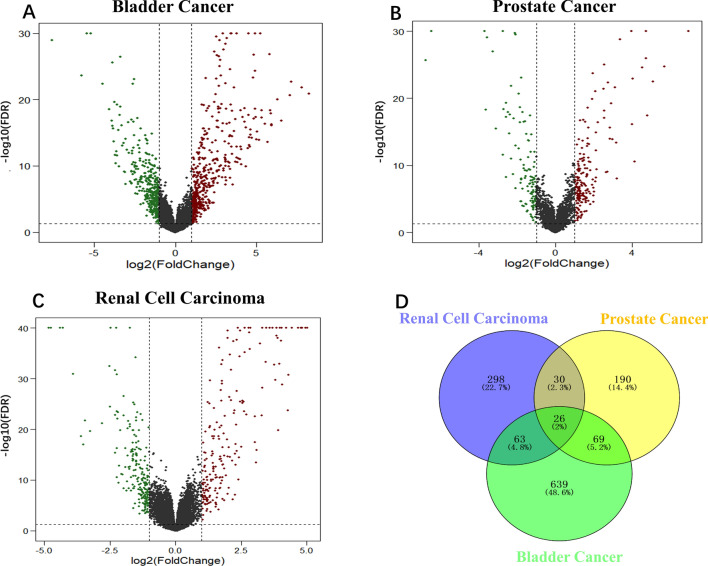
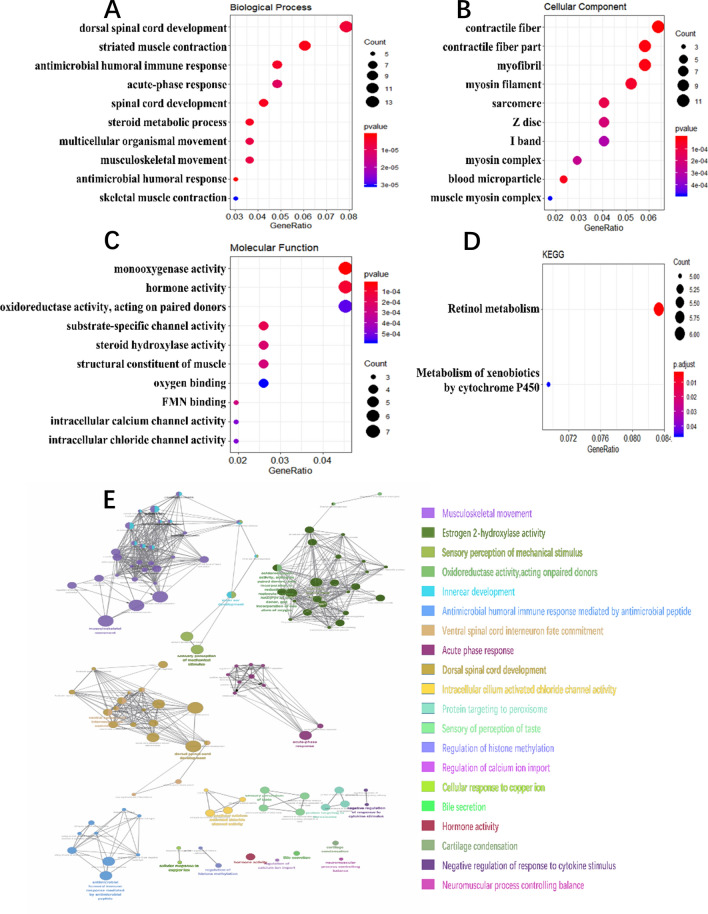
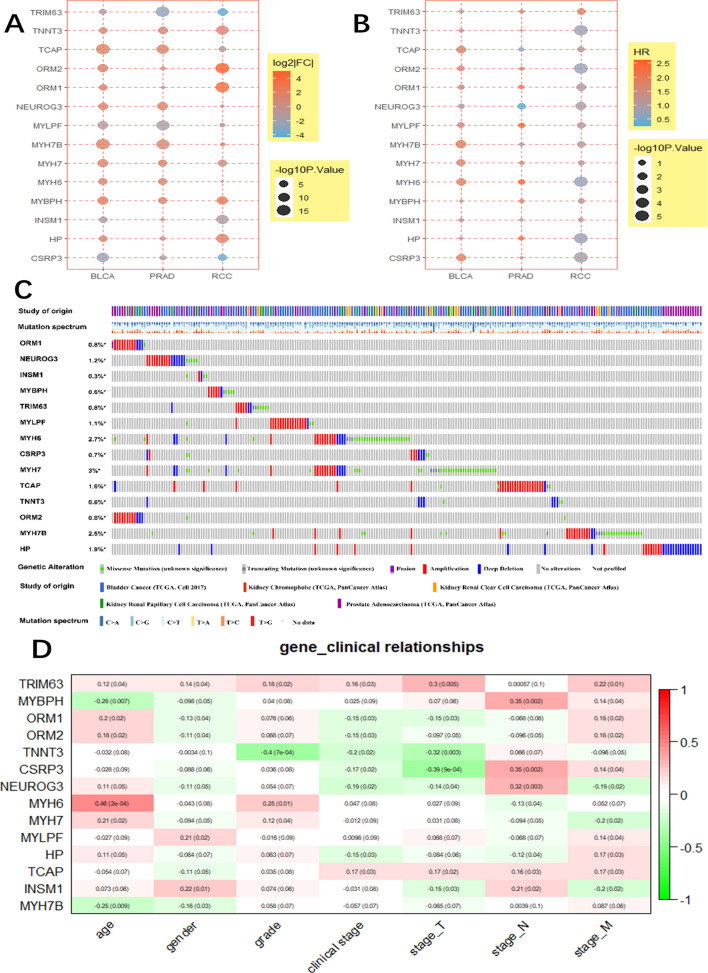
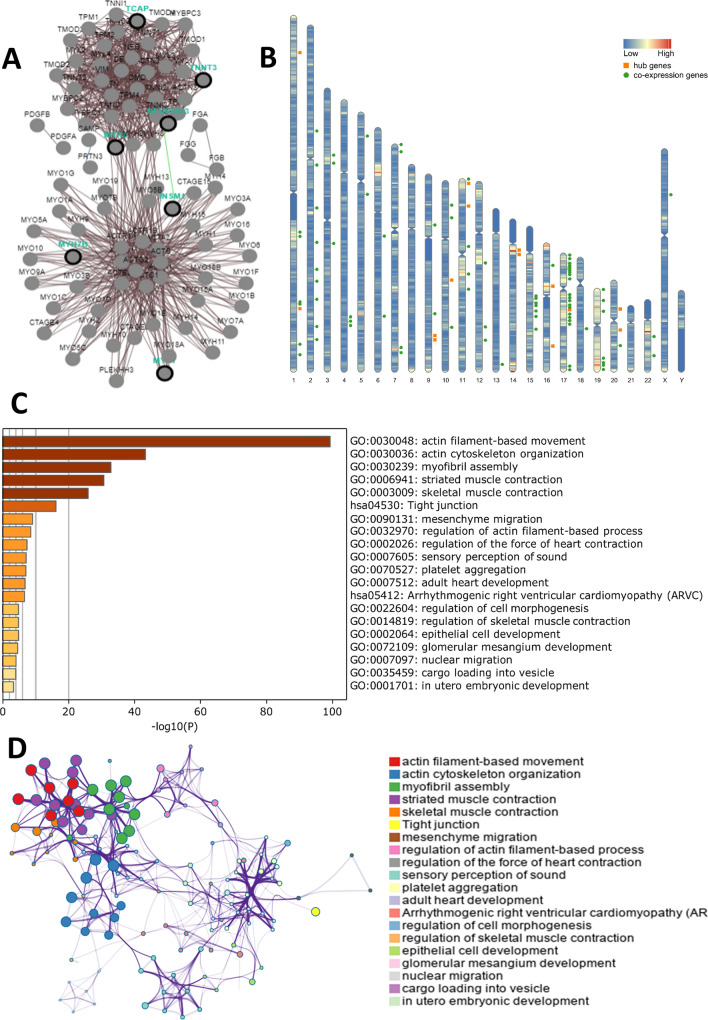
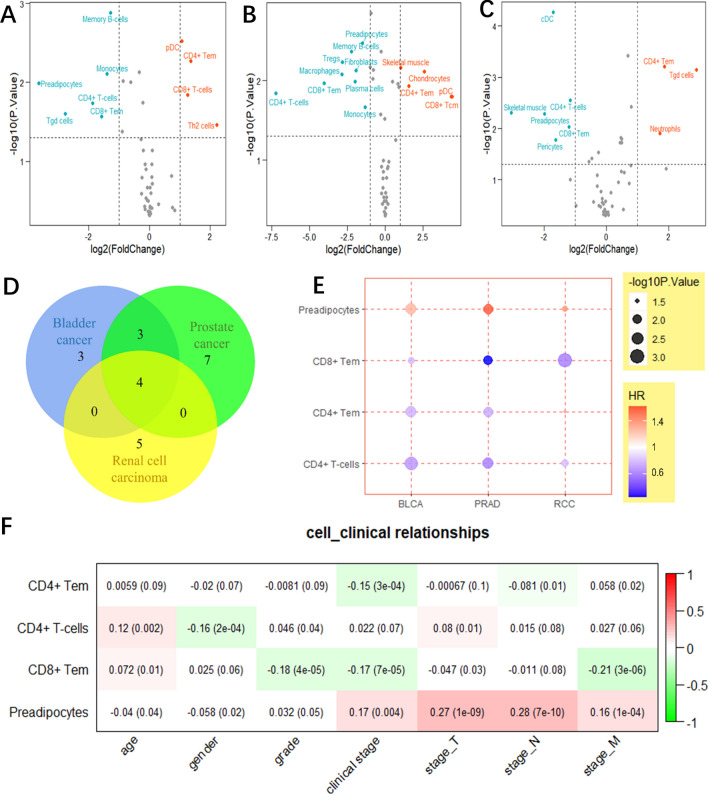
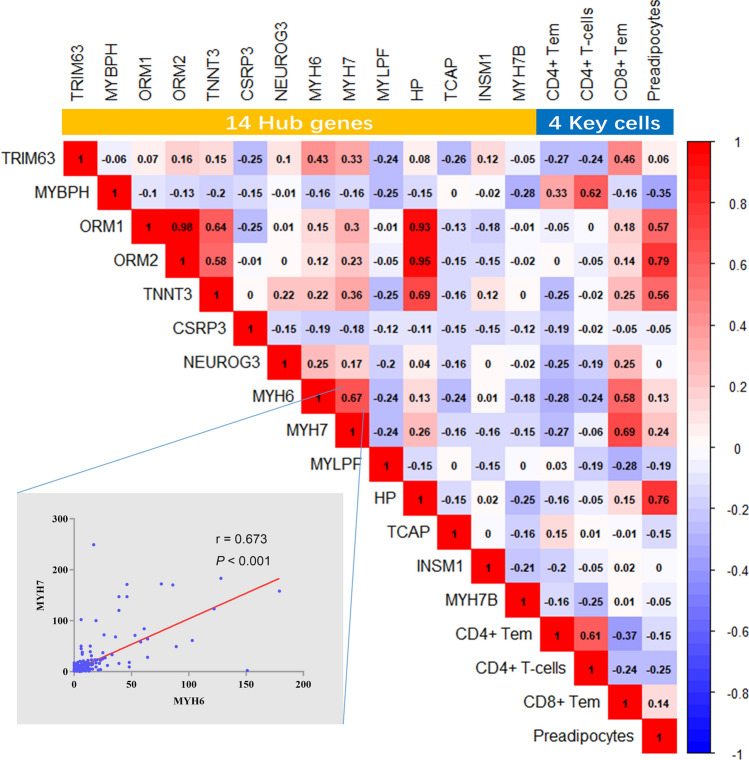
Age is one of the most important risk factors of the occurrence for tumor patients. The majority of patients with urogenital cancers are the elderly, whose clinical characteristics are greatly affected by age and ageing. Our study aimed to explore age-related genes, cells, and biological changes in three common urogenital cancers via integrative bioinformatics analysis. First, mRNA (count format) and clinical data for bladder cancer, prostate cancer and renal cell carcinoma were downloaded from the Cancer Genome Atlas (TCGA). Through the comparison of clinicopathological characteristics, genes expression and cells infiltration between the old group and the young group, it was found that the clinical characteristics, genes and cells in the tumor microenvironment of different ages were quite different. And 4 key cells, 14 hub genes and some potential pathways were identified and considered as important factors. More importantly, we analyzed the differential landscape of the genes and cells from different perspectives, and confirmed its importance. In conclusion, we identified genes and cell types associated with age-related changes in the tumour microenvironment in urogenital cancer patients. These genes and cell types may play a critical role in the age-associated differences in clinicopathological characteristics among urogenital cancers, thus providing a link between ageing and cancer occurrence. The findings of this study may pave the way for the development of age-tailored approaches to treat cancer and other age-related diseases.


Conflict of interest statement

The authors declare no competing interests.

Figures

Figure 1
Figure 1
Effects of age on the clinical characteristics of urogenital cancers. (AC) Survival rates of urogenital cancer patients in the old and young groups (red and blue lines, respectively). (DF) Clinical characteristics of bladder cancer, prostate cancer, and renal cell carcinoma patients in the old and young groups. Columns represent groups, and colours represent clinical characteristics.
Figure 2
Figure 2
Identification of age-related DEGs. (AC) Volcano plots showing the gene expression profiles of the different age groups in the three urogenital cancer types. Red/blue symbols indicate up-regulated/down-regulated genes with |log2 fold change (FC)| > 1 and adjust P-value < 0.05. (D) Venn diagram analysis (https://bioinfogp.cnb.csic.es/tools/venny/) was conducted to identify the common DEGs. We identified 188 genes that were differentially expressed in at least two cancer types.
Figure 3
Figure 3
Enrichment analysis of the common DEGs. (AD) Enrichment analyses of biological processes, cellular components, molecular functions, and KEGG pathways were conducted using clusterProfiler package of R software. The top 10 terms are shown. The colour indicates the enrichment significance (P-value) and the size indicates the number of genes. (E) Enrichment analysis of the common DEGs was also conducted using the clueGO Cytoscape plugin. Each point represents a gene, and different colours represent different enriched terms.
Figure 4
Figure 4
The relationship between the expression of hub genes and clinical characteristics. (A) mRNA levels of the 14 hub genes. The colour of each point represents the log2FC, and the size represents the P-value. (B) The association between the 14 hub genes and overall survival, as determined by univariate Cox regression analysis. The colour represents the hazard ratio (HR), and the size represents the P-value. (C) Summary of the mutations in the 14 hub genes in urogenital cancers via cBioPortal website (http://www.cbioportal.org/). Each row represents a gene, and each column represents a tumour sample. Red bars indicate gene amplifications, blue bars represent deep deletions, green squares indicate missense mutations, and grey bars indicate truncation mutations. (D) The relationship between the expression of the 14 hub genes and the clinical characteristics of bladder cancer. The numbers in rectangles indicate the correlation coefficient and the numbers in brackets indicate the P-value.
Figure 5
Figure 5
Co-expression analysis of the 14 hub genes. (A) The co-expression network was constructed using PCViz (http://www.pathwaycommons.org/pcviz). (B) Distribution of the 14 hub genes and 79 co-expressed genes on chromosomes. The orange squares represent hub genes, and the green circles represent co-expressed genes. (C) Bar graph of enriched terms among the hub and co-expressed genes, coloured based on the P-values. (D) The enrichment results via Metascape website (https://metascape.org/) were coloured according to cluster ID; nodes that share the same cluster ID are typically close to each other.
Figure 6
Figure 6
Age-related changes in cell infiltrates in the TME. (AC) Volcano plots showing the levels of 48 cell types in the TME, as determined by the xCell method. The up-regulated cells in the old group are shown in red, and the down-regulated cells are shown in light blue. (D) Venn diagram showing the common age-related cell types among the three urogenital cancers. (E) The association between the four age-related cell types and overall survival, as determined by univariate Cox regression analysis. The colour represents the HR value, and the size represents the P-value. (F) The relationship between the levels of the four age-related cell types and the clinical characteristics of bladder cancer. The numbers in rectangles indicate the correlation coefficient and the numbers in brackets indicate the P-value.
Figure 7
Figure 7
The relationship between age-related cell types and hub genes in bladder cancer. Correlation analysis of age-related cells and hub genes in bladder cancer patients and the figure was made via ggplot R package; the colours of the squares represent the correlation coefficient (Pearson correlation). The correlation map at the bottom left shows the correlation between MYH6 and MYH7.

References

    1. Kendal WS. Dying with cancer: The influence of age, comorbidity, and cancer site. Cancer. 2008;112:1354–1362. doi: 10.1002/cncr.23315. - DOI - PubMed
    1. 2Siegel, R. L., Miller, K. D. & Jemal, A. Cancer statistics, 2018. CA: a cancer journal for clinicians68, 7–30 (2018). - PubMed
    1. Hughes N, Stark D. The management of adolescents and young adults with cancer. Cancer Treat. Rev. 2018;67:45–53. doi: 10.1016/j.ctrv.2018.05.001. - DOI - PubMed
    1. López-Otín C, Blasco MA, Partridge L, Serrano M, Kroemer G. The hallmarks of aging. Cell. 2013;153:1194–1217. doi: 10.1016/j.cell.2013.05.039. - DOI - PMC - PubMed
    1. Siegel RL, Miller KD, Jemal A. Cancer statistics, 2015. CA Cancer J. Clin. 2015;65:5–29. doi: 10.3322/caac.21254. - DOI - PubMed

Publication types

MeSH terms

Substances