. 2021 Jan 12;11(1):618.
doi: 10.1038/s41598-020-79966-9.

Outer membrane vesicles containing OmpA induce mitochondrial fragmentation to promote pathogenesis of Acinetobacter baumannii

Affiliations

Outer membrane vesicles containing OmpA induce mitochondrial fragmentation to promote pathogenesis of Acinetobacter baumannii

Varnesh Tiku et al. Sci Rep. .

Abstract

Acinetobacter baumannii is a highly antibiotic resistant Gram-negative bacterium that causes life-threatening infections in humans with a very high mortality rate. A. baumannii is an extracellular pathogen with poorly understood virulence mechanisms. Here we report that A. baumannii employs the release of outer membrane vesicles (OMVs) containing the outer membrane protein A (OmpAAb) to promote bacterial pathogenesis and dissemination. OMVs containing OmpAAb are taken up by mammalian cells where they activate the host GTPase dynamin-related protein 1 (DRP1). OmpAAb mediated activation of DRP1 enhances its accumulation on mitochondria that causes mitochondrial fragmentation, elevation in reactive oxygen species (ROS) production and cell death. Loss of DRP1 rescues these phenotypes. Our data show that OmpAAb is sufficient to induce mitochondrial fragmentation and cytotoxicity since its expression in E. coli transfers its pathogenic properties to E. coli. A. baumannii infection in mice also induces mitochondrial damage in alveolar macrophages in an OmpAAb dependent manner. We finally show that OmpAAb is also required for systemic dissemination in the mouse lung infection model. In this study we uncover the mechanism of OmpAAb as a virulence factor in A. baumannii infections and further establish the host cell factor required for its pathogenic effects.


Conflict of interest statement

The authors declare no competing interests.

Figures

Figure 1
Figure 1
OmpAAb is required for bacterial colonization and dissemination in vivo. (A) Schematic representation of the mouse infection (created with BioRender.com). (BE) Neutropenic BALB/c mice were infected intranasally with 107 colony forming units (CFUs) of the indicated bacteria. Each group included five mice per time point. Two- and 24-h post-infection, animals were euthanized and lungs, liver, kidneys and spleen were homogenized and CFUs were plated from these organs. Blue dashed line in (B) represents the CFU with which each mouse was infected with. Black dotted line in (CE) represents the limit of detection. Shown is the representative data from two independent experiments. Two-tailed p value using Mann–Whitney test *p 0.05, **p 0.01.
Figure 2
Figure 2
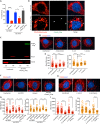
OmpAAb is necessary and sufficient to cause mitochondrial fragmentation. (A) Cytotoxicity was assessed by LDH release assay in A549 cells treated with the indicated bacteria at MOI 50 for 24 h. The experiments were done in triplicates. Error bars represent standard deviation. Two-tailed p value using unpaired t-test *p 0.05, ****p 0.0001. % cytotoxicity was calculated by normalizing the LDH release in the infected groups with uninfected cells (representing no cytotoxicity) and TritonX-100 treated cells (representing the highest cytotoxicity). (B) A549 cells were infected with the indicated bacteria for 6 h at MOI 50. Immunofluorescence was performed using anti-TOM20 antibody to stain mitochondria (red), anti-Flag antibody to stain OmpA (green) and DAPI to label nuclei (blue). Arrows indicate Flag positive OmpAAb::Flag puncta (green) colocalizing with mitochondria (red). Scale bar represents 10 µm. (C) After 6 h of infection of A549 cells with the indicated bacteria at MOI 50, cellular fractionation was performed. Western blot analysis was done on the mitochondrial and cytosolic fractions using anti-Flag, anti-Tim23 and anti-ß-actin antibodies. (D) A549 cells were infected with A. baumannii (Ab19606), E. coli (BW25113) and S. aureus (USA300) for 6 h at MOI 50. Immunofluorescence was performed using anti-TOM20 antibody to stain mitochondria (red) and DAPI to stain the nucleus (blue). Scale bar represents 10 µm. (E) The scatter plots represent the quantification of mitochondrial area (red) and perimeter (orange). Error bars represent standard deviation, n = 47–113 cells. One-way ANOVA with Tukey’s multiple comparisons test ***p 0.001, ****p 0.0001. (F) A549 cells were infected with the indicated strains of A. baumannii for 6 h at MOI 50. Immunofluorescence was performed using anti-TOM20 antibody to stain mitochondria (red) and DAPI to stain the nucleus (blue). Scale bar represents 10 µm. (G) The scatter plots represent the quantification of mitochondrial area (red) and perimeter (orange). Error bars represent standard deviation, n = 39–55 cells. One-way ANOVA with Tukey’s multiple comparisons test *p 0.05, **p 0.01, ***p 0.001, ****p 0.0001. (H) A549 cells were infected with the indicated bacteria for 6 h at MOI 50. Immunofluorescence was performed using anti-TOM20 antibody to stain mitochondria (red) and DAPI to stain the nucleus (blue). Scale bar represents 10 µm. (I) The scatter plots represent the quantification of mitochondrial area (red) and perimeter (orange). Error bars represent standard deviation, n = 55–115 cells. One-way ANOVA with Tukey’s multiple comparisons test ****p 0.0001. Mitochondrial area and perimeter quantifications were performed using an unbiased automated CellProfiler pipeline (see “Materials and methods” section for details). All the experiments shown here were performed three times independently.
Figure 3
Figure 3
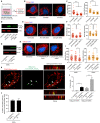
DRP1 is required for mitochondrial fragmentation upon A. baumannii infection. (A) The illustration represents the canonical mitochondrial fission pathway (created with BioRender.com). (B) A549 cells were infected with the indicated bacteria for 6 h at MOI 50. Immunofluorescence was performed using anti-TOM20 antibody to stain mitochondria (red) and anti-DRP1 antibody (green). Scale bar represents 10 µm. (C) Western blot on A549 cell lysates after indicated treatments. Anti-DRP1 antibody was used to examine DRP1 levels and ß-actin served as the loading control. (D) A549 cells treated with DRP1 siRNA or control (scrambled) siRNA were infected with wildtype A. baumannii (Ab19606) for 6 h at MOI 50. Immunofluorescence was performed using anti-TOM20 antibody to stain mitochondria (red), anti-DRP1 antibody (green) and DAPI to label the nucleus (blue). Scale bar represents 10 µm. (E) The scatter plots represent the quantification of mitochondrial area (red) and perimeter (orange). The experiment was performed in triplicates, n = 75–132 cells. Error bars represent standard deviation. One-way ANOVA with Tukey’s multiple comparisons test **p 0.01, ****p 0.0001 (F) A549 cells pre-treated with Mdivi1 (10 µM) or DMSO control were infected with wildtype A. baumannii (Ab19606) for 6 h at MOI 50. Immunofluorescence was performed using anti-TOM20 antibody to stain mitochondria (red) and DAPI to label the nucleus (blue). (G) The scatter plots represent the quantification of mitochondrial area (red) and perimeter (orange). The experiment was performed in triplicates, n = 88–138 cells. Error bars represent standard deviation. One-way ANOVA with Tukey’s multiple comparisons test ****p 0.0001. (H) Cytotoxicity was assessed by LDH release assay after 6 h of infection in A549 cells treated with the indicated siRNA and bacteria. The experiments were done in triplicates. Error bars represent standard deviation. Two-tailed p value using unpaired t-test ****p 0.0001. % cytotoxicity was calculated by normalizing the LDH release in the infected groups with uninfected/untreated cells (representing no cytotoxicity) and TritonX-100 treated cells (representing the highest cytotoxicity). Mitochondrial area and perimeter quantifications were performed using an unbiased automated CellProfiler pipeline (see “Materials and methods” section for details). All the experiments shown here were performed three times independently.
Figure 4
Figure 4
A. baumannii infection perturbs mitochondrial physiology in an OmpAAb dependent manner. (A) A549 cells were infected with the indicated bacteria for 6 h at MOI 50. The cells were treated with the CellROX reagent to examine ROS (green) and DAPI to label nuclei (blue). 30% (v/v) H2O2 treatment used at a final concentration of (1:1000) for 1 h at 37 °C served as positive control. Scale bar represents 20 µm. (B) The bar graph represents the quantification of ROS levels in A549 cells after the indicated infection/treatment. The experiment was done in triplicates, n = 90–103 cells. Error bars represent standard deviation. One-way ANOVA with Tukey’s multiple comparisons test ****p 0.0001. (C) A549 cells were infected with the indicated bacteria for 6 h at MOI 50. The cells were treated with the CellROX reagent to examine ROS (green) and DAPI to label nuclei (blue). Scale bar represents 20 µm. (D) The bar graph represents the quantification of ROS levels in A549 cells after the indicated infection. The experiment was done in triplicates, n = 72–85 cells. Error bars represent standard deviation. One-way ANOVA with Tukey’s multiple comparisons test ****p 0.0001. (E) TMRE assay to examine mitochondrial membrane potential in A549 cells after 24 h of infection with the indicated bacteria. The experiment was done in triplicates, Error bars represent standard deviation. One-way ANOVA with Tukey’s multiple comparisons test ****p 0.0001. (F) ATP levels in A549 cells after 24 h of infection with the indicated bacteria. The experiment was done in triplicates. Error bars represent standard deviation. One-way ANOVA with Tukey’s multiple comparisons test **p 0.01, ****p 0.0001. All the experiments shown here were performed three times independently.
Figure 5
Figure 5
OMVs containing OmpAAb trigger mitochondrial fragmentation. (A) Illustration showing the transwell assay set-up (created with BioRender.com). (B) A549 cells seeded in the bottom chamber of the transwell plate were incubated with the indicated bacteria (corresponding to MOI 50) in the top chamber for 6 h. The bacteria were not in contact with the cells. Immunofluorescence was performed using anti-TOM20 antibody to stain mitochondria (red) and DAPI to stain the nucleus (blue). Scale bar represents 10 µm. (C) The scatter plots represent the quantification of mitochondrial area (red) and perimeter (orange). Error bars represent standard deviation, n = 32–46 cells. One-way ANOVA with Tukey’s multiple comparisons test ****p 0.0001. (D) Western blot analysis of indicated bacterial lysates and OMVs using anti-Flag and anti-GroEL antibodies. (E) A549 cells were treated with 400 µg/ml of the indicated OMVs for 6 h. Immunofluorescence was performed using anti-TOM20 antibody to stain mitochondria (red) and DAPI to stain the nucleus (blue). Scale bar represents 10 µm. (F) The scatter plots represent the quantification of mitochondrial area (red) and perimeter (orange). Error bars represent standard deviation, n = 35–40 cells. One-way ANOVA with Tukey’s multiple comparisons test *p 0.05, **p 0.01. (G) Western blot analysis of indicated OMVs using anti-Flag and anti-BamA antibodies. (H) A549 cells were treated with 400 µg/ml of the indicated OMVs for 6 h. Immunofluorescence was performed using anti-TOM20 antibody to stain mitochondria (red) and DAPI to stain the nucleus (blue). Scale bar represents 10 µm. (I) The scatter plots represent the quantification of mitochondrial area (red) and perimeter (orange). Error bars represent standard deviation, n = 37–50 cells. One-way ANOVA with Tukey’s multiple comparisons test *p 0.05, **p 0.01. (J) Cytotoxicity was assessed by LDH release assay after 6 h of OMV treatment in A549 cells. The experiments were done in triplicates. Error bars represent standard deviation. Two-tailed p value using unpaired t-test **p 0.01. % cytotoxicity was calculated by normalizing the LDH release in the treated groups with untreated cells (representing no cytotoxicity) and TritonX-100 treated cells (representing the highest cytotoxicity). (K) A549 cells were treated with 400 µg/ml of the indicated OMVs (fluorescently labelled with Vybrant Dio) for 6 h. Immunofluorescence was performed using anti-TOM20 antibody to stain mitochondria (red) and OMVs were labelled in green. Z-stack confocal imaging was performed on the cells, orthogonal views presented here. Arrows indicate OMVs (green) colocalizing with mitochondria (red). Scale bar represents 10 µm. (L) The bar graph represents the % of indicated OMVs colocalizing with mitochondria. The cells were stained with phalloidin and intracellular OMVs were scored for their colocalization with mitochondria or not. Error bars represent standard deviation. Mitochondrial area and perimeter quantifications were performed using an unbiased automated CellProfiler pipeline (see “Materials and methods” section for details). All the experiments shown here were performed three times independently.
Figure 6
Figure 6
OmpAAb induces mitochondrial fragmentation in vivo. (A) Illustration of the mouse infection (created with BioRender.com). (B) Neutropenic BALB/c mice were infected intranasally with 107 colony forming units (CFUs) of the indicated bacteria. Six hours post-infection bronchoalveolar lavage (BAL) fluid was collected from the trachea of mice. Alveolar macrophages were isolated and immunofluorescence was performed using anti-TOM20 antibody to stain mitochondria (red) and DAPI to stain nuclei. Scale bar represents 10 µm. (C) Quantification of cells with fragmented mitochondria. The cells displaying a discontinuous segmented mitochondrial network were scored as fragmented. The quantification was performed in a blinded manner. Error bars represent standard deviation, n = 157–521 cells. One-way ANOVA with Tukey’s multiple comparisons test *p 0.05, **p 0.01. (D) Immunofluorescence was performed on the alveolar macrophages isolated from the BAL fluid from mice infected with ΔOmpA + OmpAAb::Flag complemented strain using anti-TOM20 antibody to stain mitochondria (red), anti-Flag antibody to stain OmpA::Flag (green) and DAPI to stain the nucleus (blue). Arrows indicate OmpAAb::Flag (green) colocalization with mitochondria (red). Scale bar represents 10 µm.

Similar articles

Cited by

References

    1. Kim UJ, et al. Update on the epidemiology, treatment, and outcomes of carbapenem-resistant acinetobacter infections. Chonnam Med. J. 2014 doi: 10.4068/cmj.2014.50.2.37. - DOI - PMC - PubMed
    1. Wong D, et al. Clinical and pathophysiological overview of Acinetobacter infections: A century of challenges. Clin. Microbiol. Rev. 2017 doi: 10.1128/CMR.00058-16. - DOI - PMC - PubMed
    1. Tacconelli E, Margrini N. Global priority list of antibiotic-resistant bacteria to guide research, discovery, and development of new antibiotics. WHO. 2013 doi: 10.1590/S0100-15742013000100018. - DOI
    1. Raible KM, et al. Molecular characterization of β-lactamase genes in clinical isolates of carbapenem-resistant Acinetobacter baumannii. Ann. Clin. Microbiol. Antimicrob. 2017 doi: 10.1186/s12941-017-0248-3. - DOI - PMC - PubMed
    1. Coyne S, Courvalin P, Périchon B. Efflux-mediated antibiotic resistance in Acinetobacter spp. Antimicrob. Agents Chemother. 2011 doi: 10.1128/AAC.01388-10. - DOI - PMC - PubMed

MeSH terms

Substances