

Quantitative assessment of pulmonary artery occlusion using lung dynamic perfusion CT
- PMID: 33436837
- PMCID: PMC7804280
- DOI: 10.1038/s41598-020-80177-5
Quantitative assessment of pulmonary artery occlusion using lung dynamic perfusion CT
Abstract
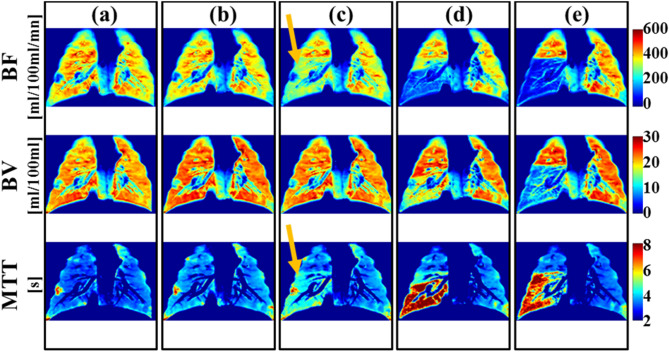
Quantitative measurement of lung perfusion is a promising tool to evaluate lung pathophysiology as well as to assess disease severity and monitor treatment. However, this novel technique has not been adopted clinically due to various technical and physiological challenges; and it is still in the early developmental phase where the correlation between lung pathophysiology and perfusion maps is being explored. The purpose of this research work is to quantify the impact of pulmonary artery occlusion on lung perfusion indices using lung dynamic perfusion CT (DPCT). We performed Lung DPCT in ten anesthetized, mechanically ventilated juvenile pigs (18.6-20.2 kg) with a range of reversible pulmonary artery occlusions (0%, 40-59%, 60-79%, 80-99%, and 100%) created with a balloon catheter. For each arterial occlusion, DPCT data was analyzed using first-pass kinetics to derive blood flow (BF), blood volume (BV) and mean transit time (MTT) perfusion maps. Two radiologists qualitatively assessed perfusion maps for the presence or absence of perfusion defects. Perfusion maps were also analyzed quantitatively using a linear segmented mixed model to determine the thresholds of arterial occlusion associated with perfusion derangement. Inter-observer agreement was assessed using Kappa statistics. Correlation between arterial occlusion and perfusion indices was evaluated using the Spearman-rank correlation coefficient. Our results determined that perfusion defects were detected qualitatively in BF, BV and MTT perfusion maps for occlusions larger than 55%, 80% and 55% respectively. Inter-observer agreement was very good with Kappa scores > 0.92. Quantitative analysis of the perfusion maps determined the arterial occlusion threshold for perfusion defects was 50%, 76% and 44% for BF, BV and MTT respectively. Spearman-rank correlation coefficients between arterial occlusion and normalized perfusion values were strong (- 0.92, - 0.72, and 0.78 for BF, BV and MTT, respectively) and were statically significant (p < 0.01). These findings demonstrate that lung DPCT enables quantification and stratification of pulmonary artery occlusion into three categories: mild, moderate and severe. Severe (occlusion ≥ 80%) alters all perfusion indices; mild (occlusion < 55%) has no detectable effect. Moderate (occlusion 55-80%) impacts BF and MTT but BV is preserved.
Conflict of interest statement
HM is an employee of Canon Medical Systems, Canada. PSF in an employee of Vital images, USA. NP receives research grant support from Canon Medical Systems. None of the other authors have a competing interest.
Figures


Similar articles
-
Arterial input function placement effect on computed tomography lung perfusion maps.Quant Imaging Med Surg. 2016 Feb;6(1):25-34. doi: 10.3978/j.issn.2223-4292.2016.01.05. Quant Imaging Med Surg. 2016. PMID: 26981452 Free PMC article.
-
The role of perfusion CT as a follow-up modality after transcatheter arterial chemoembolization: an experimental study in a rabbit model.Invest Radiol. 2010 Jul;45(7):427-36. doi: 10.1097/RLI.0b013e3181e07516. Invest Radiol. 2010. PMID: 20440211
-
Quantification of variability in breath-hold perfusion CT of hepatocellular carcinoma: a step toward clinical use.Radiology. 2012 Nov;265(2):448-56. doi: 10.1148/radiol.12111232. Epub 2012 Sep 20. Radiology. 2012. PMID: 22996748
-
Computed tomography perfusion of the liver: assessment of pure portal blood flow studied with CT perfusion during superior mesenteric arterial portography.Acta Radiol. 2004 Nov;45(7):709-15. doi: 10.1080/02841850410001385. Acta Radiol. 2004. PMID: 15624511
-
Diagnostic Performance of Perfusion Computed Tomography for Differentiating Lung Cancer from Benign Lesions: A Meta-Analysis.Med Sci Monit. 2019 May 11;25:3485-3494. doi: 10.12659/MSM.914206. Med Sci Monit. 2019. PMID: 31077263 Free PMC article.
Cited by
-
Pulmonary regional blood flow: validation of low-dose two-volume dynamic CT perfusion imaging in a swine model.Eur Radiol Exp. 2025 Feb 18;9(1):17. doi: 10.1186/s41747-025-00556-3. Eur Radiol Exp. 2025. PMID: 39966217 Free PMC article.
References
Publication types
MeSH terms
LinkOut - more resources
Full Text Sources
Other Literature Sources
Medical
Miscellaneous
