Gene expression in blood reflects smoking exposure among cancer-free women in the Norwegian Women and Cancer (NOWAC) postgenome cohort
- PMID: 33436844
- PMCID: PMC7803754
- DOI: 10.1038/s41598-020-80158-8
Gene expression in blood reflects smoking exposure among cancer-free women in the Norwegian Women and Cancer (NOWAC) postgenome cohort
Abstract
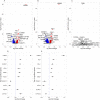
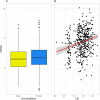
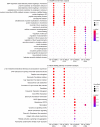
Active smoking has been linked to modulated gene expression in blood. However, there is a need for a more thorough understanding of how quantitative measures of smoking exposure relate to differentially expressed genes (DEGs) in whole-blood among ever smokers. This study analysed microarray-based gene expression profiles from whole-blood samples according to smoking status and quantitative measures of smoking exposure among cancer-free women (n = 1708) in the Norwegian Women and Cancer postgenome cohort. When compared with never smokers and former smokers, current smokers had 911 and 1082 DEGs, respectively and their biological functions could indicate systemic impacts of smoking. LRRN3 was associated with smoking status with the lowest FDR-adjusted p-value. When never smokers and all former smokers were compared, no DEGs were observed, but LRRN3 was differentially expressed when never smokers were compared with former smokers who quit smoking ≤ 10 years ago. Further, LRRN3 was positively associated with smoking intensity, pack-years, and comprehensive smoking index score among current smokers; and negatively associated with time since cessation among former smokers. Consequently, LRRN3 expression in whole-blood is a molecular signal of smoking exposure that could supplant self-reported smoking data in further research targeting blood-based markers related to the health effects of smoking.
Conflict of interest statement
The authors declare no competing interests.
Figures


Similar articles
-
A whole-blood transcriptome meta-analysis identifies gene expression signatures of cigarette smoking.Hum Mol Genet. 2016 Nov 1;25(21):4611-4623. doi: 10.1093/hmg/ddw288. Hum Mol Genet. 2016. PMID: 28158590 Free PMC article.
-
Evaluation of the tobacco heating system 2.2. Part 9: Application of systems pharmacology to identify exposure response markers in peripheral blood of smokers switching to THS2.2.Regul Toxicol Pharmacol. 2016 Nov 30;81 Suppl 2:S151-S157. doi: 10.1016/j.yrtph.2016.11.011. Epub 2016 Nov 11. Regul Toxicol Pharmacol. 2016. PMID: 27845159 Clinical Trial.
-
Gene expression analyses in breast cancer epidemiology: the Norwegian Women and Cancer postgenome cohort study.Breast Cancer Res. 2008;10(1):R13. doi: 10.1186/bcr1859. Epub 2008 Feb 13. Breast Cancer Res. 2008. PMID: 18271962 Free PMC article.
-
Associations of Cigarette Smoking With Subclinical Inflammation and Atherosclerosis: ELSA-Brasil (The Brazilian Longitudinal Study of Adult Health).J Am Heart Assoc. 2017 Jun 24;6(6):e005088. doi: 10.1161/JAHA.116.005088. J Am Heart Assoc. 2017. PMID: 28647689 Free PMC article.
-
Impact of smoking cessation on global gene expression in the bronchial epithelium of chronic smokers.Cancer Prev Res (Phila). 2008 Jul;1(2):112-8. doi: 10.1158/1940-6207.CAPR-07-0017. Epub 2008 Mar 31. Cancer Prev Res (Phila). 2008. PMID: 19138944 Free PMC article.
Cited by
-
Phenotype prediction using biologically interpretable neural networks on multi-cohort multi-omics data.NPJ Syst Biol Appl. 2024 Aug 2;10(1):81. doi: 10.1038/s41540-024-00405-w. NPJ Syst Biol Appl. 2024. PMID: 39095438 Free PMC article.
-
Cohort profile: The Clinical and Multi-omic (CAMO) cohort, part of the Norwegian Women and Cancer (NOWAC) study.PLoS One. 2023 Feb 6;18(2):e0281218. doi: 10.1371/journal.pone.0281218. eCollection 2023. PLoS One. 2023. PMID: 36745618 Free PMC article.
-
The blood transcriptome prior to ovarian cancer diagnosis: A case-control study in the NOWAC postgenome cohort.PLoS One. 2021 Aug 27;16(8):e0256442. doi: 10.1371/journal.pone.0256442. eCollection 2021. PLoS One. 2021. PMID: 34449791 Free PMC article.
-
Associations of breast cancer related exposures and gene expression profiles in normal breast tissue-The Norwegian Women and Cancer normal breast tissue study.Cancer Rep (Hoboken). 2023 Apr;6(4):e1777. doi: 10.1002/cnr2.1777. Epub 2023 Jan 8. Cancer Rep (Hoboken). 2023. PMID: 36617746 Free PMC article.
-
Immune cell-specific smoking-related expression characteristics are revealed by re-analysis of transcriptomes from the CEDAR cohort.Cent Eur J Immunol. 2022;47(3):246-259. doi: 10.5114/ceji.2022.120618. Epub 2022 Nov 16. Cent Eur J Immunol. 2022. PMID: 36817262 Free PMC article.
References
-
- World Health Organization. Don't Let Tobacco Take Your Breath Away: Choose Health, not Tobacco: 31 May, World tobacco day (accessed 10 August 2019). https://www.who.int/docs/default-source/world-no-tobacco-day/wntb-2019-b... (2019).
-
- Bonnie RJ, Kwan LY, Stratton KR. Public Health Implications of Raising the Minimum Age of Legal Access to Tobacco Products. Washington, DC: National Academies Press; 2015. pp. 91–123. - PubMed
Publication types
MeSH terms
Substances
LinkOut - more resources
Full Text Sources
Other Literature Sources

