

Expression and function of the cdgD gene, encoding a CHASE-PAS-DGC-EAL domain protein, in Azospirillum brasilense
- PMID: 33436847
- PMCID: PMC7804937
- DOI: 10.1038/s41598-020-80125-3
Expression and function of the cdgD gene, encoding a CHASE-PAS-DGC-EAL domain protein, in Azospirillum brasilense
Abstract
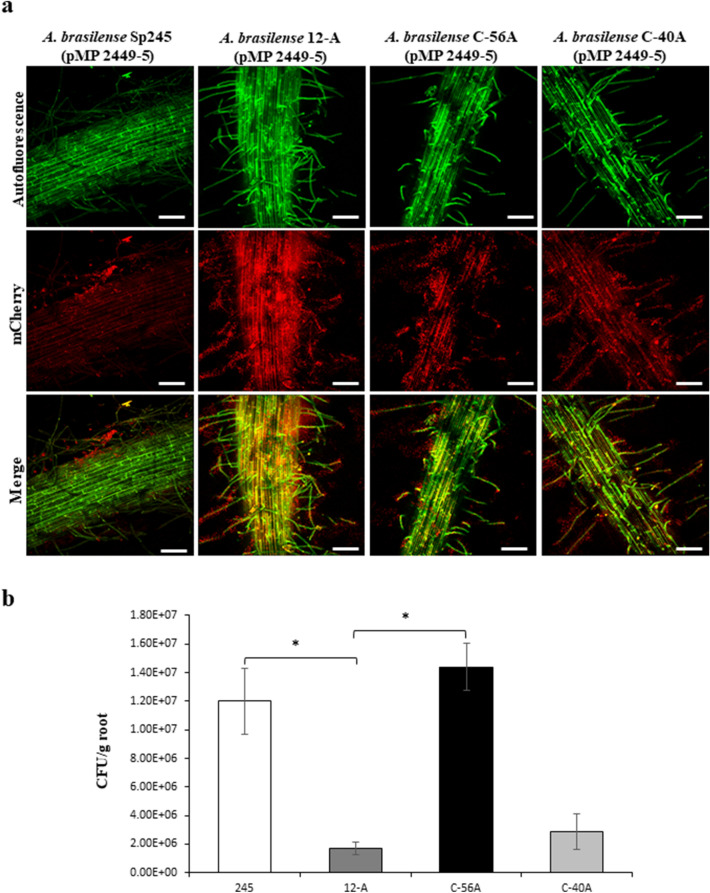
The plant growth-promoting bacterium Azospirillum brasilense contains several genes encoding proteins involved in the biosynthesis and degradation of the second messenger cyclic-di-GMP, which may control key bacterial functions, such as biofilm formation and motility. Here, we analysed the function and expression of the cdgD gene, encoding a multidomain protein that includes GGDEF-EAL domains and CHASE and PAS domains. An insertional cdgD gene mutant was constructed, and analysis of biofilm and extracellular polymeric substance production, as well as the motility phenotype indicated that cdgD encoded a functional diguanylate protein. These results were correlated with a reduced overall cellular concentration of cyclic-di-GMP in the mutant over 48 h compared with that observed in the wild-type strain, which was recovered in the complemented strain. In addition, cdgD gene expression was measured in cells growing under planktonic or biofilm conditions, and differential expression was observed when KNO3 or NH4Cl was added to the minimal medium as a nitrogen source. The transcriptional fusion of the cdgD promoter with the gene encoding the autofluorescent mCherry protein indicated that the cdgD gene was expressed both under abiotic conditions and in association with wheat roots. Reduced colonization of wheat roots was observed for the mutant compared with the wild-type strain grown in the same soil conditions. The Azospirillum-plant association begins with the motility of the bacterium towards the plant rhizosphere followed by the adsorption and adherence of these bacteria to plant roots. Therefore, it is important to study the genes that contribute to this initial interaction of the bacterium with its host plant.
Conflict of interest statement
The authors declare no competing interests.
Figures


 malate,
  fumarate, or
  proline). Error bars represent the standard deviations of three biological replicates, and the asterisks indicate values that are significantly different from those in the wild type (P < 0.05) according to Student’s T test by SigmaPlot (Systat Software, San Jose, CA). (b) Photograph of a typical agar plate containing minimal medium with 10 mM proline as the carbon source showing the swimming rings of each strain. Wild type (Sp245), isogenic mutant (12-A), complemented mutant (C-56A), and empty vector mutant (C-40A).
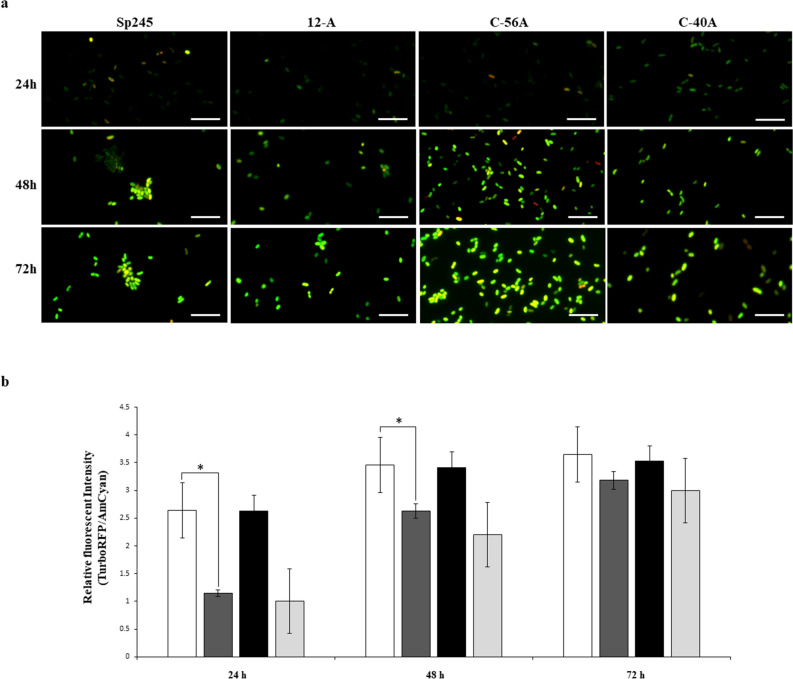
 , A. brasilense 12-A
  , and A. brasilense C-56A
  , and C-40A
strains containing the c-di-GMP biosensor (pFY4535) were grown in NFB* + KNO3 broth containing 30 μg/mL Gm with incubation for 24, 48, or 72 h at 30 °C. Then, Azospirillum cells were attached to the surface of a coverslip and sealed with a 1% agar plug. Cell images were collected at these time points after inoculation using a Nikon TE2000U microscope equipped with a 100× objective (oil immersion objective). Merge images represented the overlay of the fluorescence images AmCyan green, TurboRFP red and both yellow. (b) RFI represents the ratio between the TurboRFP and AmCyan fluorescence intensities and is directly proportional to c-di-GMP levels, as analysed using ImageJ software. The RFI values represent the standard deviations of three biological replicates, and significant differences are indicated at *P < 0.05 according to Student’s t-test by SigmaPlot (Systat Software, San Jose, CA). The bar corresponds to 10 µm.
, and C-40A
strains containing the c-di-GMP biosensor (pFY4535) were grown in NFB* + KNO3 broth containing 30 μg/mL Gm with incubation for 24, 48, or 72 h at 30 °C. Then, Azospirillum cells were attached to the surface of a coverslip and sealed with a 1% agar plug. Cell images were collected at these time points after inoculation using a Nikon TE2000U microscope equipped with a 100× objective (oil immersion objective). Merge images represented the overlay of the fluorescence images AmCyan green, TurboRFP red and both yellow. (b) RFI represents the ratio between the TurboRFP and AmCyan fluorescence intensities and is directly proportional to c-di-GMP levels, as analysed using ImageJ software. The RFI values represent the standard deviations of three biological replicates, and significant differences are indicated at *P < 0.05 according to Student’s t-test by SigmaPlot (Systat Software, San Jose, CA). The bar corresponds to 10 µm.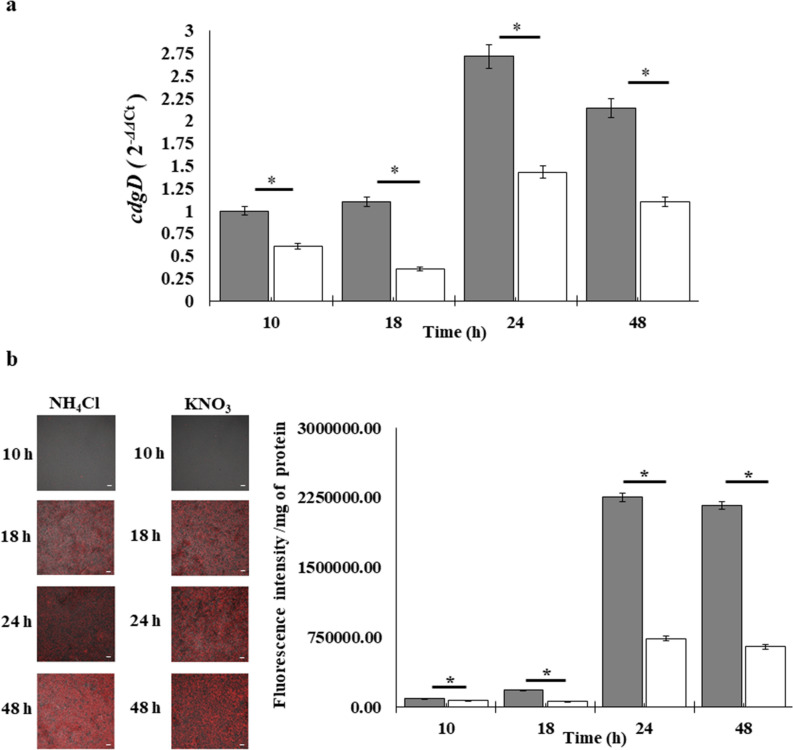 NFB* + KNO3,
NFB* + NH4Cl.
NFB* + KNO3,
NFB* + NH4Cl.
Similar articles
-
In silico comparative analysis of GGDEF and EAL domain signaling proteins from the Azospirillum genomes.BMC Microbiol. 2018 Mar 9;18(1):20. doi: 10.1186/s12866-018-1157-0. BMC Microbiol. 2018. PMID: 29523074 Free PMC article.
-
Versatile use of Azospirillum brasilense strains tagged with egfp and mCherry genes for the visualization of biofilms associated with wheat roots.Microbiol Res. 2018 Oct;215:155-163. doi: 10.1016/j.micres.2018.07.007. Epub 2018 Jul 19. Microbiol Res. 2018. PMID: 30172303
-
The cyclic-di-GMP diguanylate cyclase CdgA has a role in biofilm formation and exopolysaccharide production in Azospirillum brasilense.Res Microbiol. 2016 Apr;167(3):190-201. doi: 10.1016/j.resmic.2015.12.004. Epub 2015 Dec 18. Res Microbiol. 2016. PMID: 26708984
-
Surface characteristics of Azospirillum brasilense in relation to cell aggregation and attachment to plant roots.Crit Rev Microbiol. 2000;26(2):91-110. doi: 10.1080/10408410091154200. Crit Rev Microbiol. 2000. PMID: 10890352 Review.
-
Azospirillum, a free-living nitrogen-fixing bacterium closely associated with grasses: genetic, biochemical and ecological aspects.FEMS Microbiol Rev. 2000 Oct;24(4):487-506. doi: 10.1111/j.1574-6976.2000.tb00552.x. FEMS Microbiol Rev. 2000. PMID: 10978548 Review.
Cited by
-
Functional analysis of cyclic diguanylate-modulating proteins in Vibrio fischeri.bioRxiv [Preprint]. 2024 Sep 24:2023.07.24.550417. doi: 10.1101/2023.07.24.550417. bioRxiv. 2024. Update in: mSystems. 2024 Nov 19;9(11):e0095624. doi: 10.1128/msystems.00956-24. PMID: 37546929 Free PMC article. Updated. Preprint.
-
CdgC, a Cyclic-di-GMP Diguanylate Cyclase of Azospirillum baldaniorum Is Involved in Internalization to Wheat Roots.Front Plant Sci. 2021 Oct 20;12:748393. doi: 10.3389/fpls.2021.748393. eCollection 2021. Front Plant Sci. 2021. PMID: 34745182 Free PMC article.
-
Functional analysis of cyclic diguanylate-modulating proteins in Vibrio fischeri.mSystems. 2024 Nov 19;9(11):e0095624. doi: 10.1128/msystems.00956-24. Epub 2024 Oct 22. mSystems. 2024. PMID: 39436151 Free PMC article.
-
The GGDEF-EAL protein CdgB from Azospirillum baldaniorum Sp245, is a dual function enzyme with potential polar localization.PLoS One. 2022 Nov 23;17(11):e0278036. doi: 10.1371/journal.pone.0278036. eCollection 2022. PLoS One. 2022. PMID: 36417483 Free PMC article.
References
-
- Bashan Y, de Bashan L. How the plant growth-promoting bacterium azospirillum promotes plant growth—A critical assessment. Adv. Agron. 2010;108:77–136. doi: 10.1016/S0065-2113(10)08002-8. - DOI
-
- Pereg L, de Bashan LE, Bashan Y. Assessment of affinity and specificity of Azospirillum for plants. Plant Soil. 2016;399:389–414. doi: 10.1007/s11104-015-2778-9. - DOI
Publication types
MeSH terms
Substances
LinkOut - more resources
Full Text Sources
Other Literature Sources
