. 2021 Jan 12;11(1):515.
doi: 10.1038/s41598-020-80019-4.

Generation of proliferating human adult hepatocytes using optimized 3D culture conditions

Affiliations

Generation of proliferating human adult hepatocytes using optimized 3D culture conditions

Sophie Rose et al. Sci Rep. .

Abstract

Generating the proliferation of differentiated normal adult human hepatocytes is a major challenge and an expected central step in understanding the microenvironmental conditions that regulate the phenotype of human hepatocytes in vitro. In this work, we described optimized 3D culture conditions of primary human hepatocytes (PHH) to trigger two waves of proliferation and we identified matrix stiffness and cell-cell interactions as the main actors necessary for this proliferation. We demonstrated that DNA replication and overexpression of cell cycle markers are modulate by the matrix stiffness while PHH cultured in 3D without prior cellular interactions did not proliferate. Besides, we showed that PHH carry out an additional cell cycle after transient inhibition of MAPK MER1/2-ERK1/2 signaling pathway. Collagen cultured hepatocytes are organized as characteristic hollow spheroids able to maintain survival, cell polarity and hepatic differentiation for long-term culture periods of at least 28 days. Remarkably, we demonstrated by transcriptomic analysis and functional experiments that proliferating cells are mature hepatocytes with high detoxication capacities. In conclusion, the advanced 3D model described here, named Hepoid, is particularly relevant for obtaining normal human proliferating hepatocytes. By allowing concomitant proliferation and differentiation, it constitutes a promising tool for many pharmacological and biotechnological applications.


Conflict of interest statement

The authors declare no competing interests.

Figures
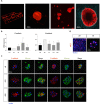
Figure 1
Figure 1
Optimized 3D collagen culture conditions promote spheroid formation and the maintenance of hepatic functions over time. (A) TPEF images of Hepoid after 8 days of culture. 3D reconstruction (xyz) of (left) 250 μm and (middle left) 100 μm depth images stack (TPEF stack) at 10× and 60× magnification, respectively; (middle right) and (right) are TPEF images taken at 20× and 60× magnification, respectively. (B) Quantification of the gene expression patterns by RT-qPCR of E-cadherin and N-cadherin in FIH (black), 2D cultures (light grey) and 3D cultured PHH (dark grey), 4 (d4), 15 (d15) and 28 days (d28) after seeding. The results are from at least three independant experiments and are expressed according to the 2D culture level (*p < 0.05, **p < 0.01, ***p < 0.001, ****p < 0.0001, one-way ANOVA test, GraphPad Prism v.7.0). (C) Immunostaining of E-cadherin or N-cadherin (red), Albumin (green) and nuclei (blue) in PHH spheroids at d4, d15 and d28. (D) Immunostaining of MKL1 (pink) and nuclei (blue) in 2D and 3D cultures. Scale bar = 25 μm.
Figure 2
Figure 2
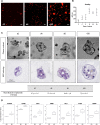
The size of spheroids sharply increases and correlates with the expression of proliferation genes. (A) TPEF images of 3D cultured PHH at d2, d6 and d10 of culture (10× magnification, z projection). Scale bar = 100 μm. (B) The viability was assessed by measuring the cellular ATP content in 3D cultured PHH at different times of culture (n = 3) (Mean ± SD, **p < 0.01, ***p < 0.001, one-way ANOVA test). (C) Phase-contrast imaging and HES staining of spheroids at d2, d4, d6 and d10 of culture. Scale bar = 50 μm. Quantification of the mean diameter size of spheroids during the time of culture. Diameters of spheroids are from three independents experiments (Mean ± SD). (D) Boxplots extracted from transcriptomic analysis of the expression of the main genes involved in the proliferation of epithelial cells (AURKB, CCND1, CDK1, MIK67, PKL1, PTTG1, CENPF). (*p < 0.05, Mann–Whitney U test).
Figure 3
Figure 3
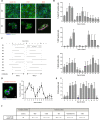
3D cultured PHH perform spontaneously two waves of proliferation. (A) Illustration of the staining of two markers of proliferation, Cyclin D1 and KI67, and the incorporation of BrdU (red) at d4 in the PHH cultured in 2D or in 3D. Albumin (green) was always stained in parallel to attest the hepatic phenotype. Nuclei (Dapi) were in blue. Scale bar = 25 μm. (B) Two waves of proliferation were observed in Hepoid during the first 2 weeks of culture as shown by the quantification of positive Cyclin D1 and KI67 cells and of the incorporation of BrdU. (C) These two waves of proliferation were observed in all cases of PHH analyzed (HL-3 to HL-10). The common proliferation waves always occurred between days 3 and 7 for the first wave and between days 8 and 13 for the second. For cases HL-1 and HL-2, quantification for the KI67 labeling index was done only during the 1st week. (D) (Left) Fluorescent immunostaining of phospho-histone H3 (red), a marker for mitotic cells, Albumin (green) and nuclei (blue) in Hepoid at d4 after 24 h of treatment with colcemid (1 μm). Scale bar = 25 μm. (Right) Mitotic index quantified by phospho-histone H3 positive cells in spheroids at the indicated time in the figure, after treatment with colcemid. (E) The incorporation of EdU was used to quantify the rate of proliferation of cryopreserved PHH cultured in 3D. (F) Percentage of proliferating PHH (Cyclin D1/Albumin positive cells) seeded in collagen gels at 1.5 mg/ml with complete culture medium (Control) or in medium depleted in EGF, HGF, ITS or FBS.
Figure 4
Figure 4
Implication of MEK1/2-ERK1/2 signaling pathway in the proliferation of Hepoid. Quantification of PHH proliferation after 6 days of culture in the presence of U0126 (20 μM), ML7 (20 μM), Rapamycin (10 nM) or vehicle (DMSO, 0.1%) (AC). (A) TPEF images (left) and (right) quantification of the surface of Hepoid performed using ImageJ software. Scale bar = 300 μm. (B) Quantification of EdU incorporation during 24 h in the presence of inhibitors or vehicle. The results are expressed according to the DMSO-treated culture (*p < 0.05, **p < 0.01, ***p < 0.001, ****p < 0.0001, one-way ANOVA test). (C) Control of phospho-ERK, phospho-MLC on Serine 19 and phospho-P70 on Threonine 389 inhibition in the presence of U0126, ML7 and Rapamycin, respectively (+), or vehicle (−). Transient inhibition of the MEK1/2-ERK1/2 pathway was performed during 48 h by U0126 (20 μM) in 3D cultured PHH after the two waves of proliferation (DF). (D) Phospho-ERK inhibition in the presence of U0126 (+) or vehicle control (−). Controls were done in presence of 0.1% DMSO. (E) Cyclin D1 or KI67 (red), Albumin (green) and nuclei (blue) staining. Scale bar = 25 μm. (F) Quantification of Cyclin D1 (light grey) and KI67 (dark grey) positive cells after release of the inhibition. Cyclin D1 was quantified in cells treated vehicle (white). No KI67 positive cell has been detected after treatment with the vehicle.
Figure 5
Figure 5
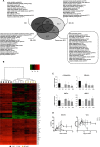
Transcriptomic analysis reveals great similarities between FIH and 3D cultured PHH. (A) Transcriptomic analysis of up-regulated genes in FIH and 3D cultured PHH cultured during 4 (d4) and 15 (d15) days. The numbers indicate the numbers of differentially up-regulated genes compared to 2D culture with fold change > 2 and p < 0.05 using WebGestalT. In bold, the most enriched Go Terms found in Webgestald online tool, an important part of them being shared between the three conditions (Common GO). Indicated p-values are after Benjamini–Hochberg multiple testing correction. (B) Heatmap showing levels of major hepatic genes (LiGEP) in FIH (black), at maximum differentiation in 2D culture at d4 (white) and in 3D cultured PHH at d15 (yellow). (C) Quantification of the gene expression patterns by RT-qPCR of α-fetoprotein, albumin, HNF4α and HNF1β in FIH (black), 2D cultures (light grey) and 3D cultured PHH (dark grey), 4 (d4), 15 (d15) and 28 days (d28) after seeding. The results are from at least three independant experiments and are expressed according to the 2D culture level (Mean ± SD, *p < 0.05, one-way ANOVA test). (D) Albumin and urea secretions in PHH cultured in 2D or in 3D at the indicated times of culture. The results are from at least three independant experiments (Mean ± SD).
Figure 6
Figure 6
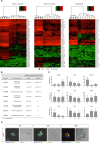
3D cultured PHH exhibit optimal drug detoxification capabilities. (A) Heatmap showing the expression of the main phase I and II enzymes and drug transporters in FIH (black), 2D cultures (white) and in PHH cultured in 3D at d15 (yellow). (B) LC/MS–MS assays of the activities of the major CYPs isoforms involved in the liver detoxication of xenobiotics in 3D cultured PHH at d15. CYP1A2 was induced by 3-methylcholantrene (5 μm, 24 h), CYP3A4 and CYP2C8 were induced by rifampicin (50 μM, 72 h) and CYP2B6 was induced by phenobarbital (3.2 mM, 72 h) (Mean ± SD, *p < 0.05, **p < 0.01, ***p < 0.001, Student’s t-test). (C) Quantification of mRNA levels of phase II (UGT1A1, NAT1, GSTA1/2), hepatic transporters (MRP2, OCT1, BSEP) and CYPs regulators (CAR, PXR, AhR) in PHH cultured in 3D at d4, d15 and d28. The results are from at least three independant experiments and are expressed according to the 2D culture level (Mean ± SD, *p < 0.05, one-way ANOVA test). (D) Immunostaining and functional analysis of the MRP2 drug transporter in spheroids revealed bile canaliculi from the beginning to the late stages of the culture (d4, d15 and d28). MRP2 (red), albumin (green) and nuclei (blue) are detected by immunostaining. Functionality of the transporter was assessed by CDFDA processing (green). Scale bar = 25 μm.

Similar articles

Cited by

References

    1. Michalopoulos GK, DeFrances MC. Liver regeneration. Science. 1997;276:60–66. doi: 10.1126/science.276.5309.60. - DOI - PubMed
    1. Frémin C, et al. Multiple division cycles and long-term survival of hepatocytes are distinctly regulated by extracellular signal-regulated kinases ERK1 and ERK2. Hepatology. 2009;49:930–939. doi: 10.1002/hep.22730. - DOI - PubMed
    1. Loyer P, et al. Growth factor dependence of progression through G1 and S phases of adult rat hepatocytes in vitro. Evidence of a mitogen restriction point in mid-late G1. J. Biol. Chem. 1996;271:11484–11492. doi: 10.1074/jbc.271.19.11484. - DOI - PubMed
    1. Thoresen GH, Guren TK, Christoffersen T. Role of ERK, p38 and PI3-kinase in EGF receptor-mediated mitogenic signalling in cultured rat hepatocytes: Requirement for sustained ERK activation. Cell. Physiol. Biochem. Int. J. Exp. Cell. Physiol. Biochem. Pharmacol. 2003;13:229–238. doi: 10.1159/000072426. - DOI - PubMed
    1. Corlu A, et al. A plasma membrane protein is involved in cell contact-mediated regulation of tissue-specific genes in adult hepatocytes. J. Cell Biol. 1991;115:505–515. doi: 10.1083/jcb.115.2.505. - DOI - PMC - PubMed

Publication types