. 2021 Jan 12;11(1):826.
doi: 10.1038/s41598-020-80637-y.

Chronic stress and corticosterone exacerbate alcohol-induced tissue injury in the gut-liver-brain axis

Affiliations

Chronic stress and corticosterone exacerbate alcohol-induced tissue injury in the gut-liver-brain axis

Pradeep K Shukla et al. Sci Rep. .

Abstract

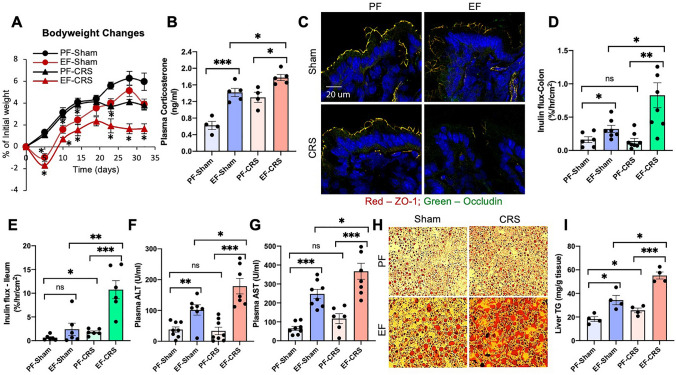
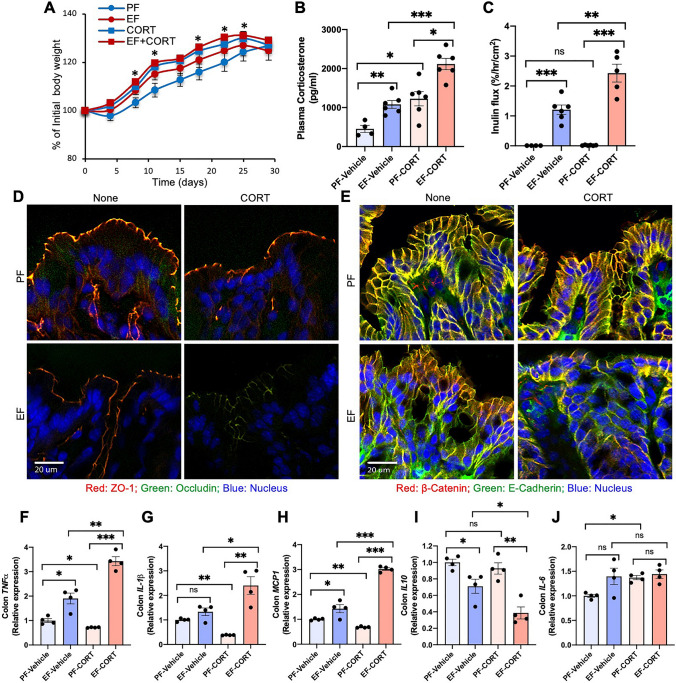
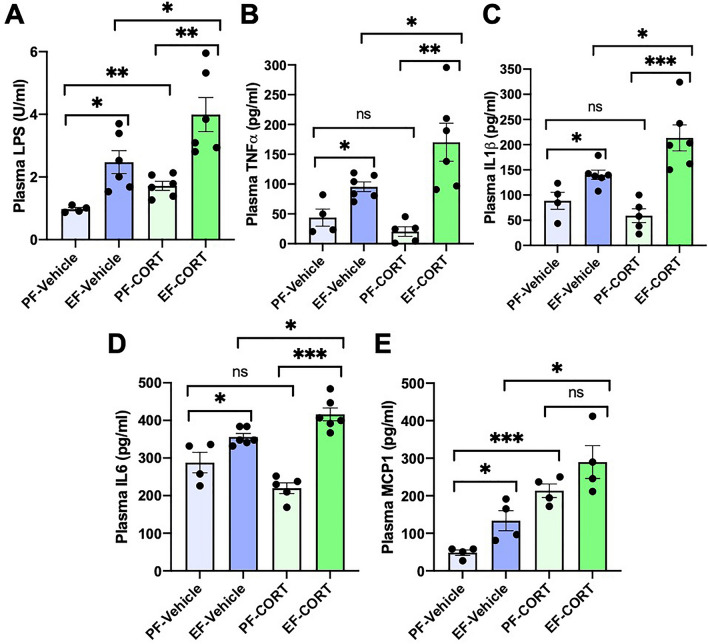
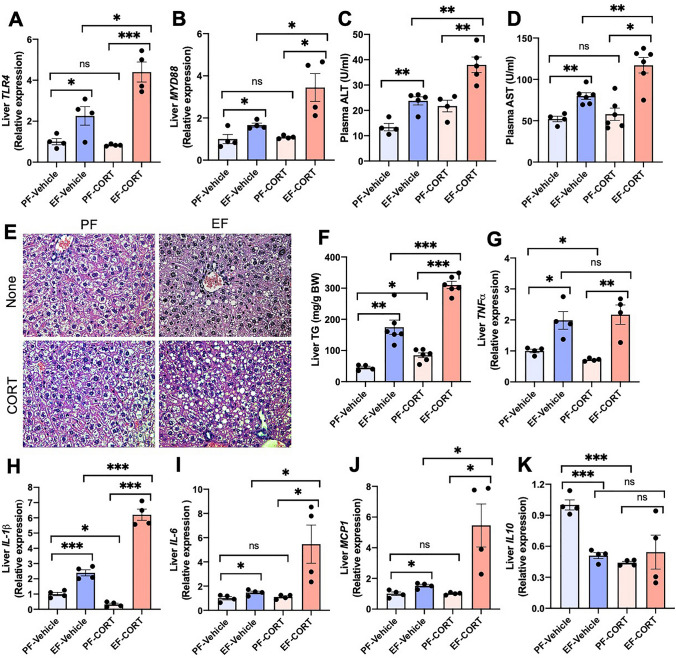
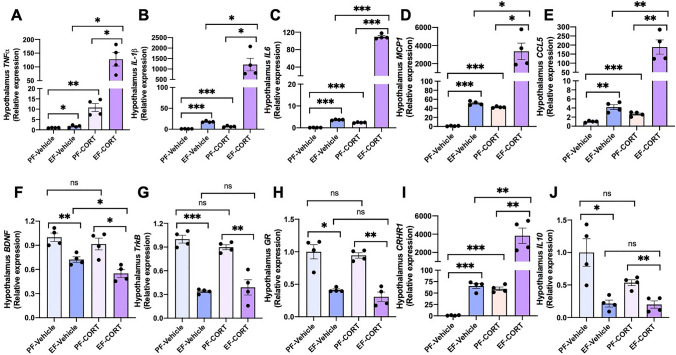
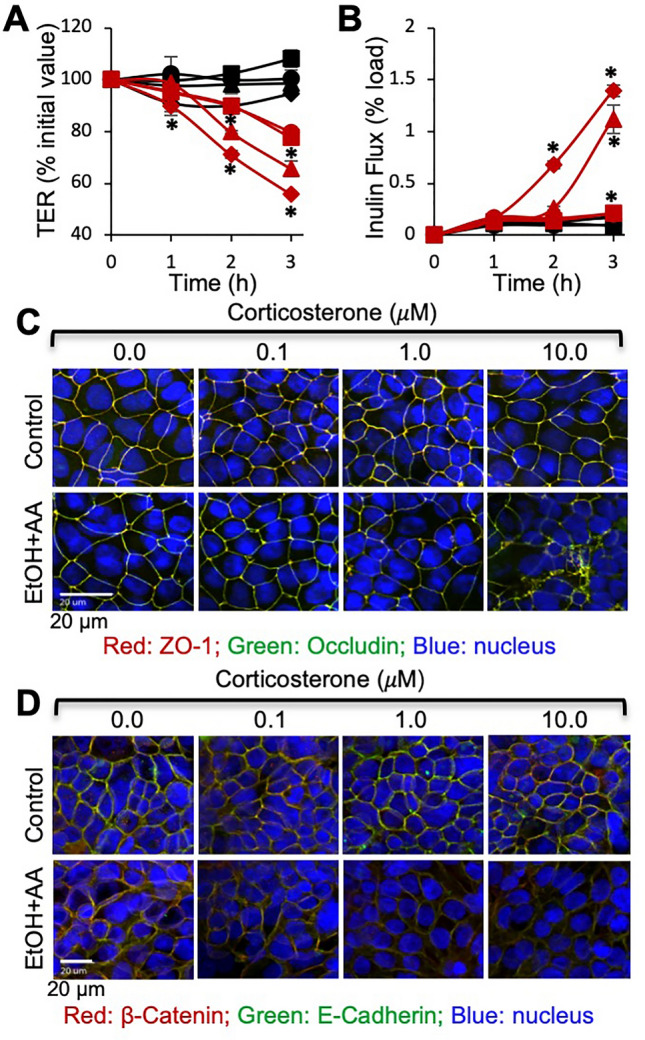
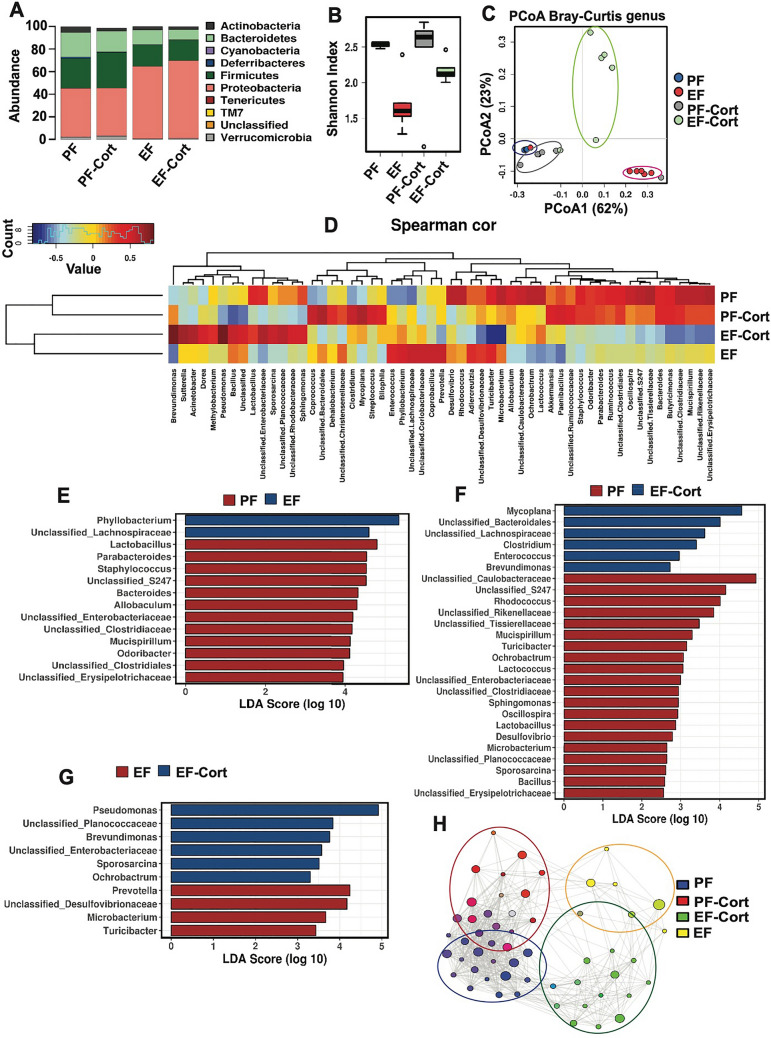
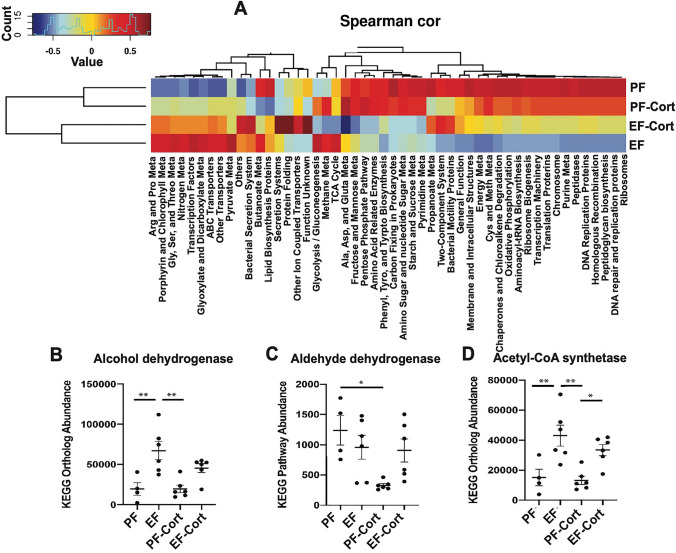
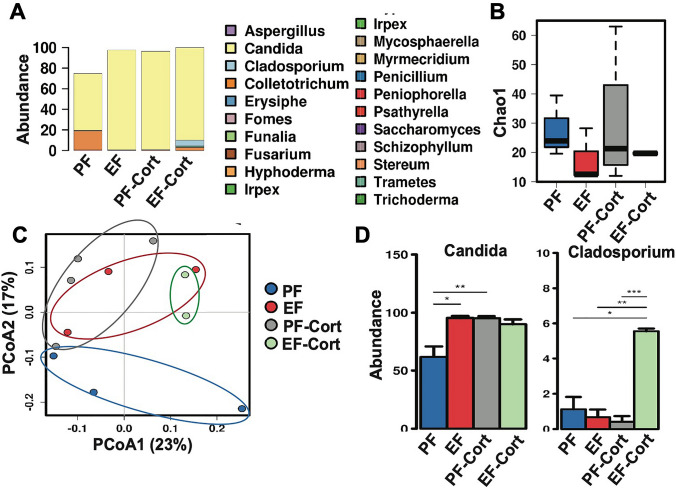
Alcohol use disorders are associated with altered stress responses, but the impact of stress or stress hormones on alcohol-associated tissue injury remain unknown. We evaluated the effects of chronic restraint stress on alcohol-induced gut barrier dysfunction and liver damage in mice. To determine whether corticosterone is the stress hormone associated with the stress-induced effects, we evaluated the effect of chronic corticosterone treatment on alcoholic tissue injury at the Gut-Liver-Brain (GLB) axis. Chronic restraint stress synergized alcohol-induced epithelial tight junction disruption and mucosal barrier dysfunction in the mouse intestine. These effects of stress on the gut were reproduced by corticosterone treatment. Corticosterone synergized alcohol-induced expression of inflammatory cytokines and chemokines in the colonic mucosa, and it potentiated the alcohol-induced endotoxemia and systemic inflammation. Corticosterone also potentiated alcohol-induced liver damage and neuroinflammation. Metagenomic analyses of 16S RNA from fecal samples indicated that corticosterone modulates alcohol-induced changes in the diversity and abundance of gut microbiota. In Caco-2 cell monolayers, corticosterone dose-dependently potentiated ethanol and acetaldehyde-induced tight junction disruption and barrier dysfunction. These data indicate that chronic stress and corticosterone exacerbate alcohol-induced mucosal barrier dysfunction, endotoxemia, and systemic alcohol responses. Corticosterone-mediated promotion of alcohol-induced intestinal epithelial barrier dysfunction and modulation of gut microbiota may play a crucial role in the mechanism of stress-induced promotion of alcohol-associated tissue injury at the GLB axis.


Conflict of interest statement

The authors declare no competing interests.

Figures

Figure 1
Figure 1
Chronic restraint stress synergizes alcohol-induced disruption of gut barrier dysfunction and liver damage. Adult mice were fed a liquid diet with (EF) or without (PF) ethanol for four weeks. In some groups, animals were subjected to two-hour restraint stress (CRS) or "Sham" treated. (A) Body weights were recorded twice a week. (B) Plasma corticosterone levels. (C) Epithelial tight junction integrity was assessed by staining cryosections of the colon for occludin and ZO-1 by immunofluorescence method followed by confocal imaging. (D,E) Mucosal permeability was measured by the vascular-to-luminal flux of FITC-inulin in the colon (D) and ileum (E) in vivo. (F,G) ALT (F) and AST (G) activities were measured in plasma. (H,I) Liver sections were stained with Oil-Red-O for fat deposits (H). Liver extracts were analyzed for triglyceride content (I). Values in graphs are mean ± SEM (n = 6). Dots in bars indicate individual values. The numbers above the bars are p-values for differences between the groups indicated by the horizontal lines, and "ns" indicates no significant difference between groups.
Figure 2
Figure 2
Corticosterone enhances alcohol-induced barrier dysfunction and mucosal inflammatory responses in the mouse colon. Adult mice were fed a liquid diet with (EF) or without (PF) ethanol for four weeks. In some groups, animals were injected with corticosterone (CORT) daily. Animals in other groups were injected with the vehicle. (A) Body weights were recorded twice a week. (B) Corticosterone levels were measured in plasma. (C) Mucosal permeability was measured by the vascular-to-luminal flux of FITC-inulin in the colon in vivo. (D,E) Epithelial junctional integrity was assessed by staining the cryosections of the colon for occludin and ZO-1 for tight junction (D) and E-cadherin and β-catenin for adherens junction (E) by immunofluorescence method followed by confocal imaging. (F–J) RNA isolated from colonic mucosa was analyzed for mRNA specific for TNFα (D), IL-1β (E), MCP1 (F), and IL-10 (G) by RT-qPCR. Values in graphs are mean ± SEM (n = 4–6 for AC and 4 for FJ). Dots in bars indicate individual values. The numbers above the bars are p-values for differences between the groups indicated by the horizontal lines, and "ns" indicates no significant difference between groups.
Figure 3
Figure 3
Corticosterone exacerbates alcohol-induced endotoxemia and systemic inflammation. Adult mice were fed a liquid diet with (EF) or without (PF) ethanol for four weeks. In some groups, animals were injected with corticosterone (CORT) daily. Animals in other groups were injected with the vehicle. (A) Endotoxemia was assessed by measuring plasma LPS levels. (BD) Levels of TNFα (B), IL-1β (C), IL-6 (D), and MCP1 (E) were measured in plasma by ELISA. Values in graphs are mean ± SEM (n = 6, except 4 for the PF-Vehicle group). Dots in bars indicate individual values. The numbers above the bars are p-values for differences between the groups indicated by the horizontal lines, and "ns" indicates no significant difference between groups.
Figure 4
Figure 4
Corticosterone potentiates alcohol-induced liver damage. Adult mice were fed a liquid diet with (EF) or without (PF) ethanol for four weeks. In some groups, animals were injected with corticosterone (CORT) daily. Animals in other groups were injected with the vehicle. (A,B) Expression of TLR4 (A) and MYD88 (B) in the liver was assessed by RT-qPCR for specific mRNA. (C,D) Plasma was analyzed for ALT (C) and AST (D) activities. (E) Liver histopathology was performed by H&E staining and bright field microscopy. (F) Steatosis was assessed by measuring liver triglyceride content. (G–K) Inflammatory responses in the liver were determined by measuring specific mRNA for TNFα (G), IL-1β (H), IL-6 (I), MCP1 (J), and IL-10 (K). Values in graphs are mean ± SEM (n = 6 for AE, and 4 for FJ). Dots in bars indicate individual values. The numbers above the bars are p-values for differences between the groups indicated by the horizontal lines, and "ns" indicates no significant difference between groups.
Figure 5
Figure 5
Corticosterone synergizes alcohol-induced neuroinflammation. Adult mice were fed a liquid diet with (EF) or without (PF) ethanol for four weeks. In some groups, animals were injected with corticosterone (CORT) daily. Animals in other groups were injected with the vehicle. Inflammatory responses in the hypothalamus were assessed by measuring specific mRNA for TNFα (A), IL-1β (B), IL-6 (C), MCP1 (D), CCL5 (E), BDNF (F), TrkB (G), GR (H), CRHR1 (I), and IL-10 (J). Values in graphs are mean ± SEM (n = 4). Dots in bars indicate individual values. The numbers above the bars are p-values for differences between the groups indicated by the horizontal lines, and "ns" indicates no significant difference between groups.
Figure 6
Figure 6
Corticosterone sensitizes Caco-2 cell monolayers for ethanol and acetaldehyde-induced tight junction disruption and barrier dysfunction. Caco-2 cell monolayers were pretreated with varying concentrations (black circle, red circle 0 μM, black square, red square 0.1 μM, black triangle, red triangle 1.0 μM, black diamond, red diamond 10 μM) of corticosterone (CORT) for 24 h, followed by incubation with (red circle, red square, red triangle, red diamond) or without (black circle, black square, black triangle, black diamond) ethanol (20 mM) and acetaldehyde (100 μM) (EtOH + AA). At varying times, TER (A) and FITC-inulin permeability (B) were measured. At 3 h of incubation, cell monolayers were fixed and co-stained for occludin and ZO-1 (C) or E-cadherin and β-catenin (D). Values in graphs are mean ± SEM (n = 6). Asterisks indicate the values that are significantly (P < 0.05) different from corresponding values for groups without ethanol and acetaldehyde treatments.
Figure 7
Figure 7
Corticosterone effect alcohol-induced intestinal dysbiosis: taxonomic analysis. Adult mice were fed a liquid diet with (EF) or without (PF) ethanol for four weeks. In some groups, animals were injected with corticosterone (CORT) daily. Animals in other groups were injected with the vehicle. Analysis of data from 16S rRNA-sequencing of fecal samples from different groups of mice is presented. (A) Relative abundance of different phyla of bacteria. (B) The Shannon Index was used to quantify α-diversity. (C) Principal coordinate analysis (PCoA) based on Bray–Curtis dissimilarity analysis was performed to determine β-diversity. (D) Spearman's correlation of microbiota at the genus level in different experimental groups. The dendrogram illustrates the genus and experimental group clustering. (E) Linear discriminate analysis of effect size (LefSe) was used to identify enriched taxa following ethanol feeding and corticosterone administration. (F) The network analysis of genus clustering was calculated by Spearman's correlations, where nodes represent genera associated and the experimental groups coded by color.
Figure 8
Figure 8
Corticosterone effect alcohol-induced intestinal dysbiosis: a functional analysis. Adult mice were fed a liquid diet with (EF) or without (PF) ethanol for four weeks. In some groups, animals were injected with corticosterone (CORT) daily. Animals in other groups were injected with the vehicle. Analysis of data from 16S rRNA-sequencing of fecal samples from different groups of mice is presented. (A) Functional categories associated with taxonomic composition were analyzed from the phylogenetic investigation of bacterial communities by PICRUSt. Spearman’s correlation on the most abundant microbial metabolic pathways in different groups is presented. (BD) Effects of alcohol and corticosterone on the abundance of microbial categories expressing ethanol metabolizing enzymes, alcohol dehydrogenase (B), aldehyde dehydrogenase (C), and acetyl CoA synthetase (D).
Figure 9
Figure 9
Corticosterone effect alcohol-induced dysbiosis of intestinal mycobiome. Adult mice were fed a liquid diet with (EF) or without (PF) ethanol for four weeks. In some groups, animals were injected with corticosterone (CORT) daily. Animals in other groups were injected with the vehicle. Analysis of data from 16S rRNA-sequencing of fecal samples from different groups of mice is presented. (A) Fungal phylum is displayed in each group. (B) Fungal α-diversity calculated by Chao1. (C) Principal coordinate analysis was used to visualize β-diversity in fungal populations with Jaccard dissimilarity. (D) Significantly altered fungal genus are displayed by ANOVA. *P < 0.05; **P < 0.01; ***P < 0.005.

References

    1. Gonzalez-Reimers E, Santolaria-Fernandez F, Martin-Gonzalez MC, et al. Alcoholism: A systemic pro-inflammatory condition. World J. Gastroenterol. 2014;20:14660–14671. doi: 10.3748/wjg.v20.i40.14660. - DOI - PMC - PubMed
    1. Patel S, Behara R, Swanson GR, et al. Alcohol and the Intestine. Biomolecules. 2015;5:2573–2588. doi: 10.3390/biom5042573. - DOI - PMC - PubMed
    1. Morris NL, Ippolito JA, Curtis BJ, et al. Alcohol and inflammatory responses: Summary of the 2013 Alcohol and Immunology Research Interest Group (AIRIG) meeting. Alcohol. 2015;49:1–6. doi: 10.1016/j.alcohol.2014.07.018. - DOI - PMC - PubMed
    1. Seabra V, Stachlewitz RF, Thurman RG. Taurine blunts LPS-induced increases in intracellular calcium and TNF-alpha production by Kupffer cells. J. Leukoc. Biol. 1998;64:615–621. doi: 10.1002/jlb.64.5.615. - DOI - PubMed
    1. Thomas P, Lazure DA, Moussa R, et al. Identification of two novel LPS-binding proteins in Kupffer cells: Implications in TNF-alpha production. J. Endotoxin Res. 2006;12:352–357. doi: 10.1177/09680519060120060501. - DOI - PubMed

Publication types

MeSH terms

LinkOut - more resources