

Automatic segmentation of ventricular volume by 3D ultrasonography in post haemorrhagic ventricular dilatation among preterm infants
- PMID: 33436974
- PMCID: PMC7803781
- DOI: 10.1038/s41598-020-80783-3
Automatic segmentation of ventricular volume by 3D ultrasonography in post haemorrhagic ventricular dilatation among preterm infants
Abstract
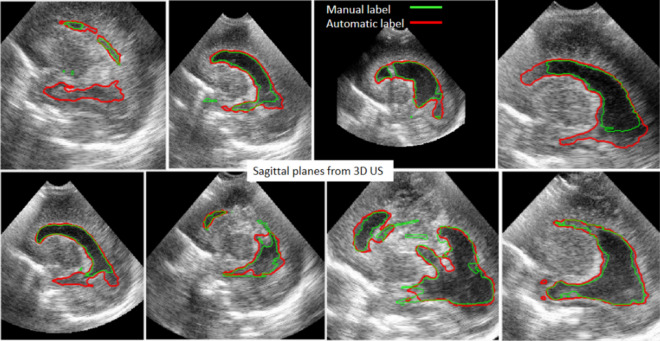
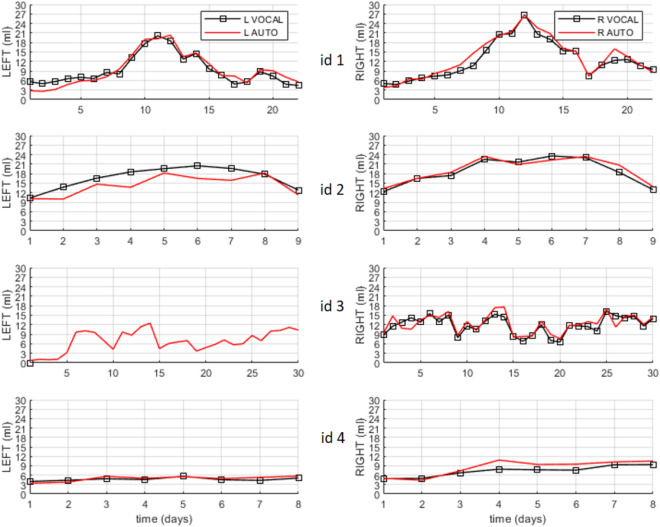
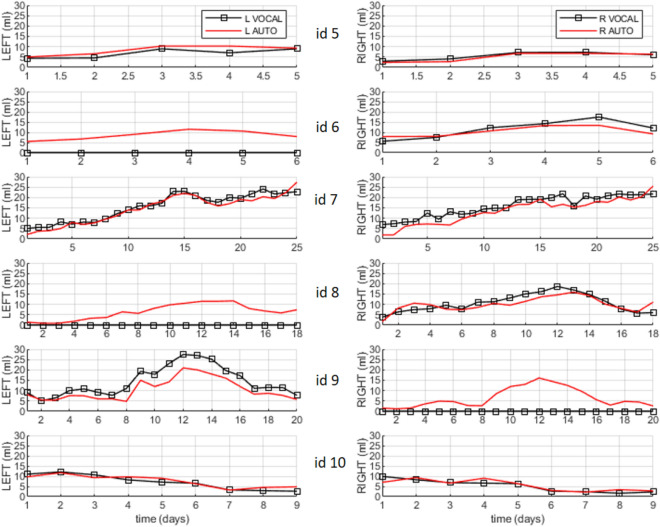
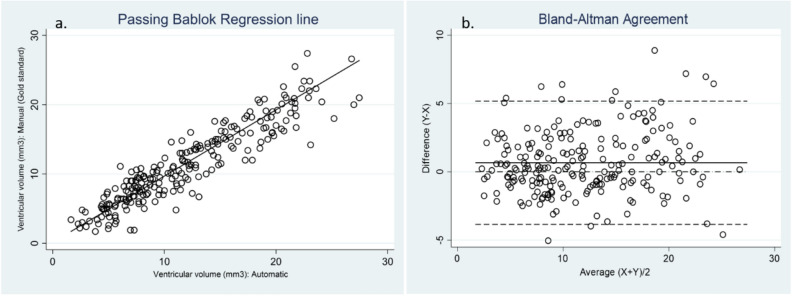
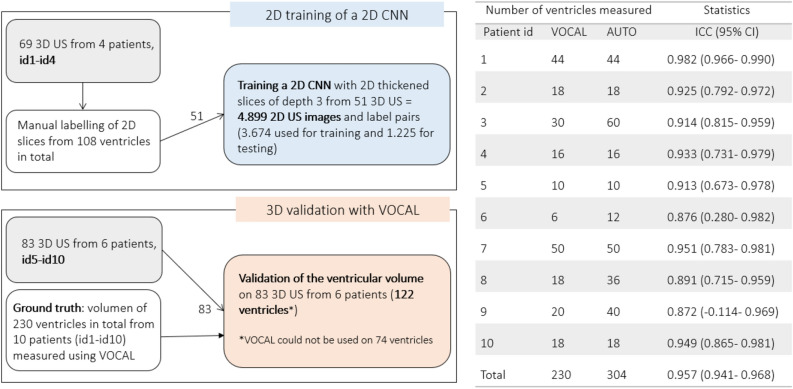
To train, evaluate, and validate the application of a deep learning framework in three-dimensional ultrasound (3D US) for the automatic segmentation of ventricular volume in preterm infants with post haemorrhagic ventricular dilatation (PHVD). We trained a 2D convolutional neural network (CNN) for automatic segmentation ventricular volume from 3D US of preterm infants with PHVD. The method was validated with the Dice similarity coefficient (DSC) and the intra-class coefficient (ICC) compared to manual segmentation. The mean birth weight of the included patients was 1233.1 g (SD 309.4) and mean gestational age was 28.1 weeks (SD 1.6). A total of 152 serial 3D US from 10 preterm infants with PHVD were analysed. 230 ventricles were manually segmented. Of these, 108 were used for training a 2D CNN and 122 for validating the methodology for automatic segmentation. The global agreement for manual versus automated measures in the validation data (n = 122) was excellent with an ICC of 0.944 (0.874-0.971). The Dice similarity coefficient was 0.8 (± 0.01). 3D US based ventricular volume estimation through an automatic segmentation software developed through deep learning improves the accuracy and reduces the processing time needed for manual segmentation using VOCAL. 3D US should be considered a promising tool to help deepen our current understanding of the complex evolution of PHVD.
Conflict of interest statement
The authors declare no competing interests.
Figures
Similar articles
-
Automated 3D U-net based segmentation of neonatal cerebral ventricles from 3D ultrasound images.Med Phys. 2022 Feb;49(2):1034-1046. doi: 10.1002/mp.15432. Epub 2022 Jan 12. Med Phys. 2022. PMID: 34958147
-
Automatic segmentation approach to extracting neonatal cerebral ventricles from 3D ultrasound images.Med Image Anal. 2017 Jan;35:181-191. doi: 10.1016/j.media.2016.06.038. Epub 2016 Jul 9. Med Image Anal. 2017. PMID: 27428629
-
Automatic segmentation and location learning of neonatal cerebral ventricles in 3D ultrasound data combining CNN and CPPN.Comput Biol Med. 2021 Apr;131:104268. doi: 10.1016/j.compbiomed.2021.104268. Epub 2021 Feb 17. Comput Biol Med. 2021. PMID: 33639351
-
Automatic Segmentation of Multiple Organs on 3D CT Images by Using Deep Learning Approaches.Adv Exp Med Biol. 2020;1213:135-147. doi: 10.1007/978-3-030-33128-3_9. Adv Exp Med Biol. 2020. PMID: 32030668 Review.
-
A deep learning-based approach to automatic proximal femur segmentation in quantitative CT images.Med Biol Eng Comput. 2022 May;60(5):1417-1429. doi: 10.1007/s11517-022-02529-9. Epub 2022 Mar 24. Med Biol Eng Comput. 2022. PMID: 35322343 Review.
Cited by
-
Automatic brain segmentation in preterm infants with post-hemorrhagic hydrocephalus using 3D Bayesian U-Net.Hum Brain Mapp. 2022 Apr 15;43(6):1895-1916. doi: 10.1002/hbm.25762. Epub 2022 Jan 13. Hum Brain Mapp. 2022. PMID: 35023255 Free PMC article.
-
Neurosonography: Shaping the future of neuroprotection strategies in extremely preterm infants.Heliyon. 2024 May 24;10(11):e31742. doi: 10.1016/j.heliyon.2024.e31742. eCollection 2024 Jun 15. Heliyon. 2024. PMID: 38845994 Free PMC article. Review.
-
Ultrasonographic Estimation of Total Brain Volume: 3D Reliability and 2D Estimation. Enabling Routine Estimation During NICU Admission in the Preterm Infant.Front Pediatr. 2021 Jul 22;9:708396. doi: 10.3389/fped.2021.708396. eCollection 2021. Front Pediatr. 2021. PMID: 34368031 Free PMC article.
-
Three-dimensional cranial ultrasound and functional near-infrared spectroscopy for bedside monitoring of intraventricular hemorrhage in preterm neonates.Sci Rep. 2023 Mar 6;13(1):3730. doi: 10.1038/s41598-023-30743-4. Sci Rep. 2023. PMID: 36878952 Free PMC article.
References
Publication types
MeSH terms
Supplementary concepts
LinkOut - more resources
Full Text Sources
Other Literature Sources
Medical
