. 2021 Jan 12;11(1):735.
doi: 10.1038/s41598-020-80895-w.

Characterizing genetic and antigenic divergence from vaccine strain of influenza A and B viruses circulating in Thailand, 2017-2020

Affiliations

Characterizing genetic and antigenic divergence from vaccine strain of influenza A and B viruses circulating in Thailand, 2017-2020

Nungruthai Suntronwong et al. Sci Rep. .

Abstract

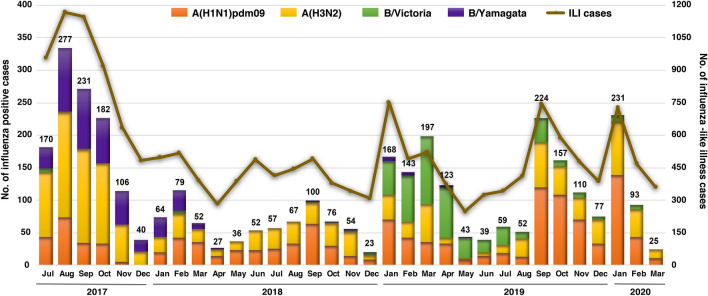
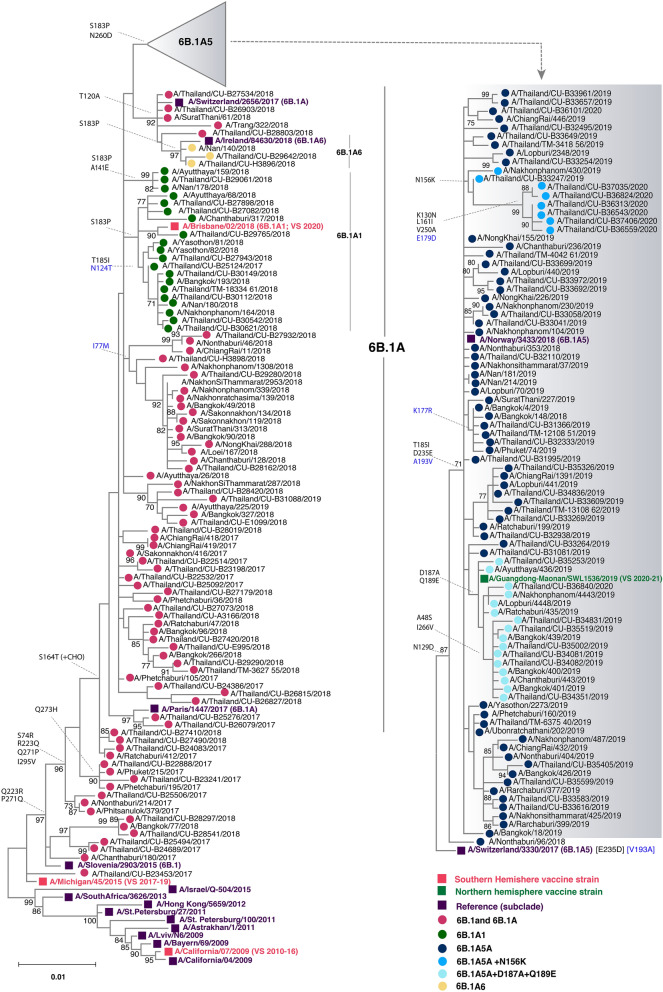
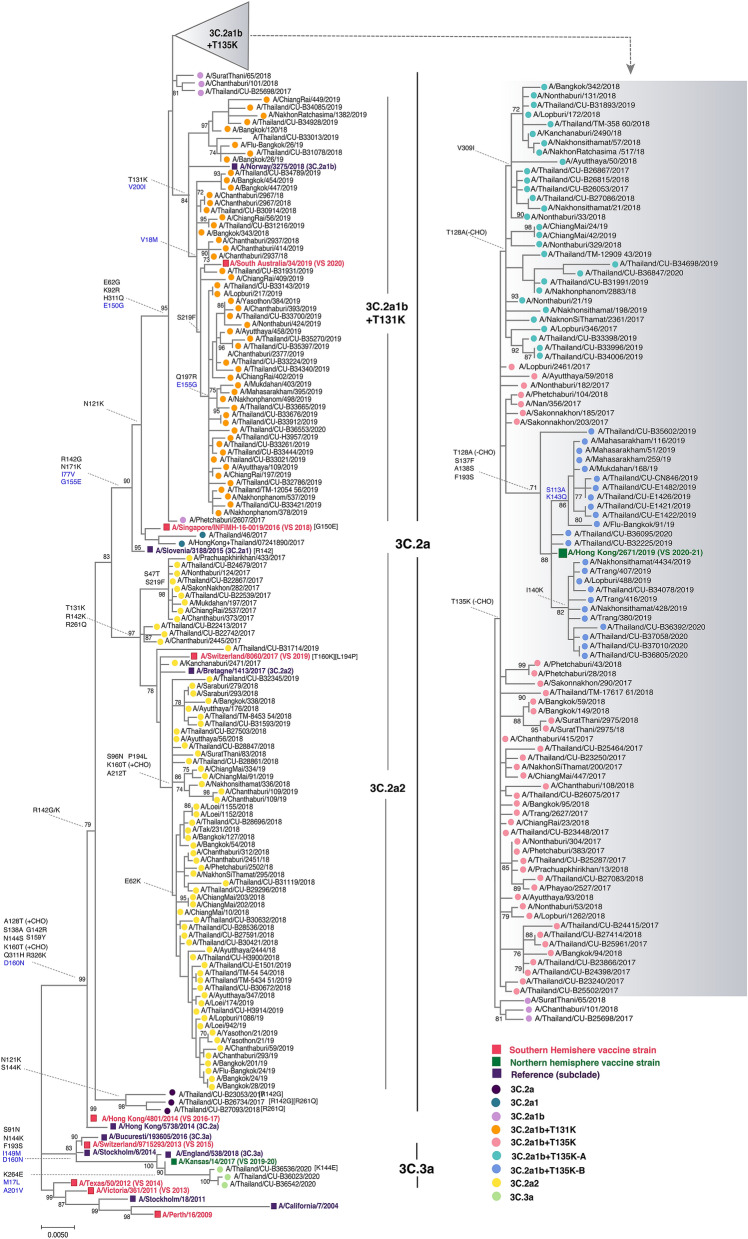
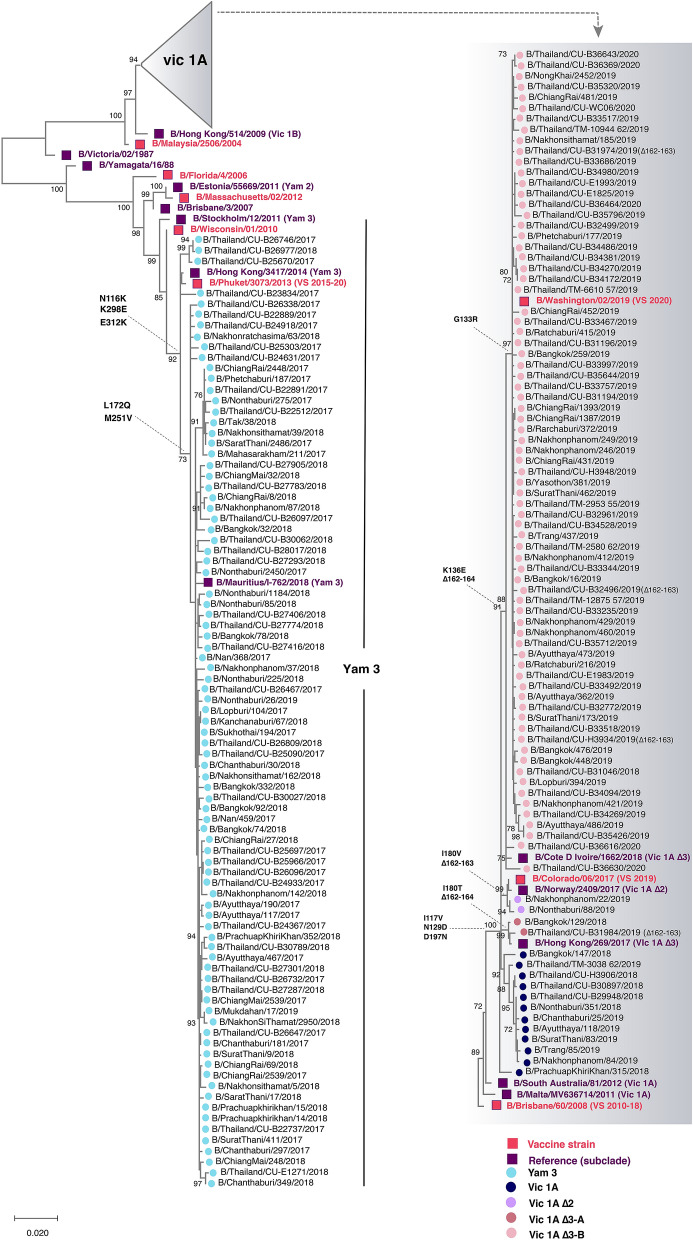
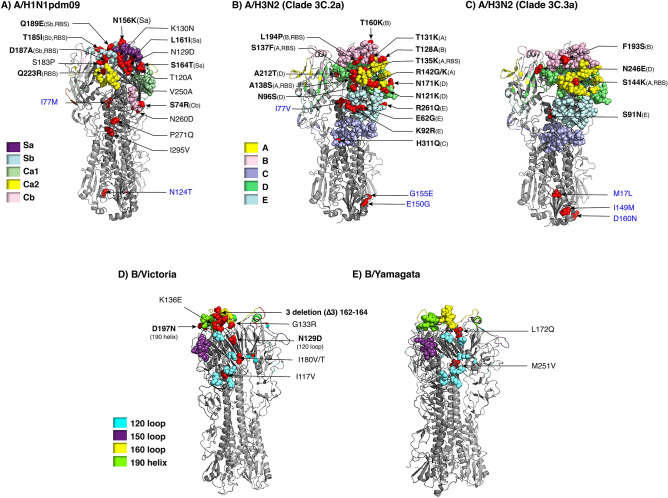
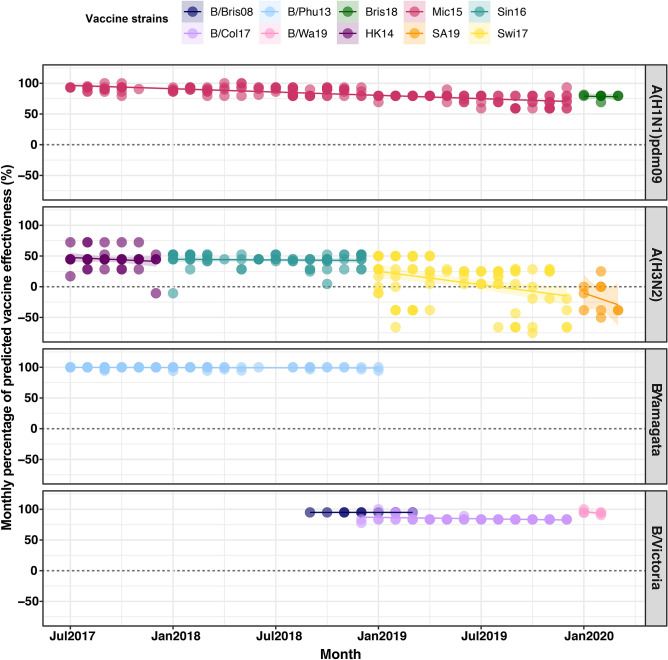
We monitored the circulating strains and genetic variation among seasonal influenza A and B viruses in Thailand between July 2017 and March 2020. The hemagglutinin gene was amplified and sequenced. We identified amino acid (AA) changes and computed antigenic relatedness using the Pepitope model. Phylogenetic analyses revealed multiple clades/subclades of influenza A(H1N1)pdm09 and A(H3N2) were circulating simultaneously and evolved away from their vaccine strain, but not the influenza B virus. The predominant circulating strains of A(H1N1)pdm09 belonged to 6B.1A1 (2017-2018) and 6B.1A5 (2019-2020) with additional AA substitutions. Clade 3C.2a1b and 3C.2a2 viruses co-circulated in A(H3N2) and clade 3C.3a virus was found in 2020. The B/Victoria-like lineage predominated since 2019 with an additional three AA deletions. Antigenic drift was dominantly facilitated at epitopes Sa and Sb of A(H1N1)pdm09, epitopes A, B, D and E of A(H3N2), and the 120 loop and 190 helix of influenza B virus. Moderate computed antigenic relatedness was observed in A(H1N1)pdm09. The computed antigenic relatedness of A(H3N2) indicated a significant decline in 2019 (9.17%) and 2020 (- 18.94%) whereas the circulating influenza B virus was antigenically similar (94.81%) with its vaccine strain. Our findings offer insights into the genetic divergence from vaccine strains, which could aid vaccine updating.


Conflict of interest statement

The authors declare no competing interests.

Figures

Figure 1
Figure 1
Monthly distribution of influenza A and B viruses from July 2017 to March 2020 (n = 17,480). Numbers above the bar graph indicate the monthly number of influenza virus-positive samples (left Y-axis) with respect to the monthly ILI samples (right Y-axis). The bar graph was generated by using Microsoft Excel (Office 365).
Figure 2
Figure 2
Phylogenetic analysis of the entire HA gene of A(H1N1)pdm09. Sequences from 90 A/Thailand/CU strains and 93 other Thai strains available from the database were compared with the A(H1N1)pdm09 vaccine and reference strains of known clades. Phylogenetic tree was constructed using the maximum-likelihood method using the TN93 + G model with 1,000 bootstrap replicates implemented in MEGAX. Branch values of > 70% are indicated at the nodes, along with the characteristic residues defining these branches. Residue changes in HA1 are denoted in black; changes in HA2 are in blue. Gain (+ CHO) and loss (−CHO) potential glycosylation sites were indicated. Southern hemisphere vaccine strains (magenta squares), the 2020–21 northern hemisphere vaccine (green squares) and the reference strains (purple squares) are indicated. Colored circles indicate the clade and subclade of A(H1N1)pdm09 circulating strains. VS defined as vaccine strain.
Figure 3
Figure 3
Phylogenetic analysis of the HA gene of A(H3N2). Sequences from 90 A/Thailand/CU strains and 142 other Thai strains available from the database were compared with the A(H3N2) vaccine and reference strains of known clades. Phylogenetic tree was constructed using the maximum-likelihood method using the HKY + G + I model with 1000 bootstrap replicates implemented in MEGAX. Branch values of > 70% are indicated at the nodes, along with the characteristic residues defining these branches. Residue changes in HA1 are denoted in black; changes in HA2 are in blue. Gain (+ CHO) and loss (−CHO) potential glycosylation sites were indicated. Southern hemisphere vaccine strains (magenta squares), the 2019–2021 northern hemisphere vaccine (green squares) and the reference strains (purple squares) are indicated. Colored circles denote the clade and subclade of A(H3N2) circulating strains. VS defined as vaccine strain.
Figure 4
Figure 4
Phylogenetic analyses of the nucleotide sequences of the HA coding region of the influenza B virus. Eighty-one nucleotide sequences from this study (designated A/Thailand/CU) and other Thai strains available from the database during July 2017-March 2020 (n = 96) were compared with the influenza B vaccine and reference strains of known clades (magenta and purple squared, respectively). Phylogenetic tree was constructed using the maximum-likelihood method and the HKY + G model with 1000 bootstrap replicates implemented in MEGAX. Branch values of > 70% are indicated at nodes. Colored circles denote the clade and subclade of the circulating influenza B virus strains. VS defined as vaccine strain.
Figure 5
Figure 5
Placement of residue changes identified in the influenza virus strains in this study. Trimeric HA of influenza A and B virus for which three-dimensional structures were available from the Protein Data Bank (https://www.rcsb.org) served to illustrate differences in amino acids at various positions between the vaccine and the Thai strains identified in this study. The AA changes were mapped by using PyMOL Molecular Graphics System Version 1.3 (Schrödinger; https://www.schrodinger.com). A) The AA changes between A/Michigan/45/2015 and A(H1N1)pdm09 Thai strains were mapped onto HA structure of A/California/04/2009 (PDB:3LZG). Amino acid substitutions of A(H3N2) Thai strains compared with B) A/Hong Kong/4801/2014 (3C.2a) and C) A/Switzerland/9,715,293/2013 (3C.3a) were mapped on A/Victoria/361/2011 (PDB: 4WE9). D) Residue changes between B/Victoria Thai strains and vaccine strain, B/Brisbane/60/2008 (PDB: 4FQM) were shown. E) The AA changes of B/Yamagata Thai strains and B/Phuket/3073/2013 were mapped on B/Yamanashi/166/98 (PDB: 4M44). RBS and antigenic sites are color-coded. Residue of the vaccine strain, followed by the numerical position and the residue found in the Thai strains, are indicated with arrows pointing to the location (red). Bolded amino acid designations denote important antigenic and/or RBS, while blue designations are on HA2. Only one subunit comprising the trimeric HA is labeled for clarity.
Figure 6
Figure 6
Estimation of the trend of computed antigenic relatedness between July 2017 and March 2020. Computed antigenic relatedness was derived using the Pepitope model by comparing vaccine strains and plotted by using R v3.6.0 (https://www.r-project.org). Circulating A(H1N1)pdm09 viruses were compared with A/Michigan/45/2015 (Mic15) and B/Brisbane/02/2018 (Bris18). Circulating A(H3N2) viruses were compared with A/Hong Kong/4801/2014 (HK14), A/Singapore/INFIMH-16–0019/2016 (Sin16), A/Switzerland/8060/2017 (Swi17) and A/South Australia/34/2019 (SA19). The circulating B/Yamagata-like lineage was compared with B/Phuket/3073/2013 (B/Phu13) and the B/Victoria-like lineage was compared with B/Brisbane/60/2008 (B/Bris08), B/Colorado/06/2017 (B/Col17), B/Washington/02/2019 (B/Wa19) with the corresponding number of deletions. The colored circles of each panel represent individual computed antigenic relatedness against the vaccine strain in that year.

Similar articles

Cited by

References

    1. Wang X, et al. Global burden of respiratory infections associated with seasonal influenza in children under 5 years in 2018: A systematic review and modelling study. Lancet Glob. Health. 2020;8(4):e497–e510. doi: 10.1016/S2214-109X(19)30545-5. - DOI - PMC - PubMed
    1. Cox NJ, Subbarao KJA. Global epidemiology of influenza: past and present. Annu. Rev. Med. 2000;51(1):407–421. doi: 10.1146/annurev.med.51.1.407. - DOI - PubMed
    1. Tricco AC, et al. Comparing influenza vaccine efficacy against mismatched and matched strains: A systematic review and meta-analysis. BMC Med. 2013;11(1):153. doi: 10.1186/1741-7015-11-153. - DOI - PMC - PubMed
    1. Skowronski DM, et al. Serial vaccination and the antigenic distance hypothesis: Effects on influenza vaccine effectiveness during A (H3N2) epidemics in Canada, 2010–2011 to 2014–2015. J. Infect. Dis. 2017;215(7):1059–1099. doi: 10.1093/infdis/jix074. - DOI - PMC - PubMed
    1. Skowronski DM, et al. A perfect storm: Impact of genomic variation and serial vaccination on low influenza vaccine effectiveness during the 2014–2015 season. Clin. Infect. Dis. 2016;63(1):21–32. doi: 10.1093/cid/ciw176. - DOI - PMC - PubMed

Publication types

MeSH terms

Substances