

Integrated bioinformatics analysis for differentially expressed genes and signaling pathways identification in gastric cancer
- PMID: 33437215
- PMCID: PMC7797537
- DOI: 10.7150/ijms.47339
Integrated bioinformatics analysis for differentially expressed genes and signaling pathways identification in gastric cancer
Abstract
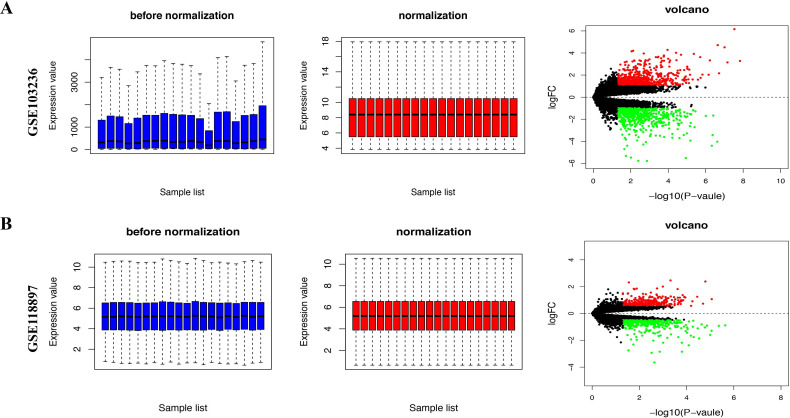
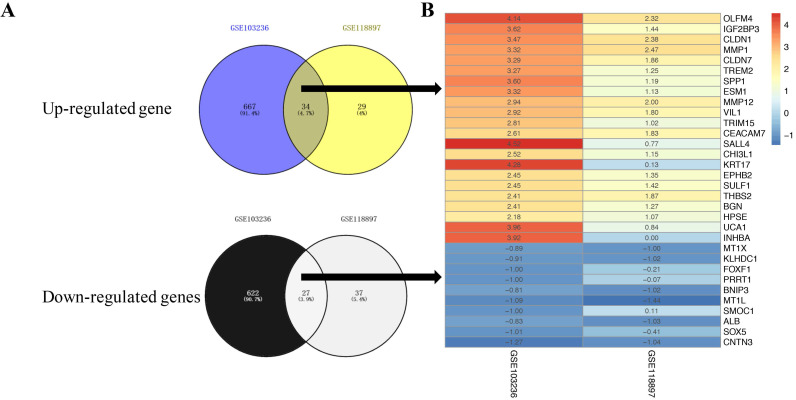
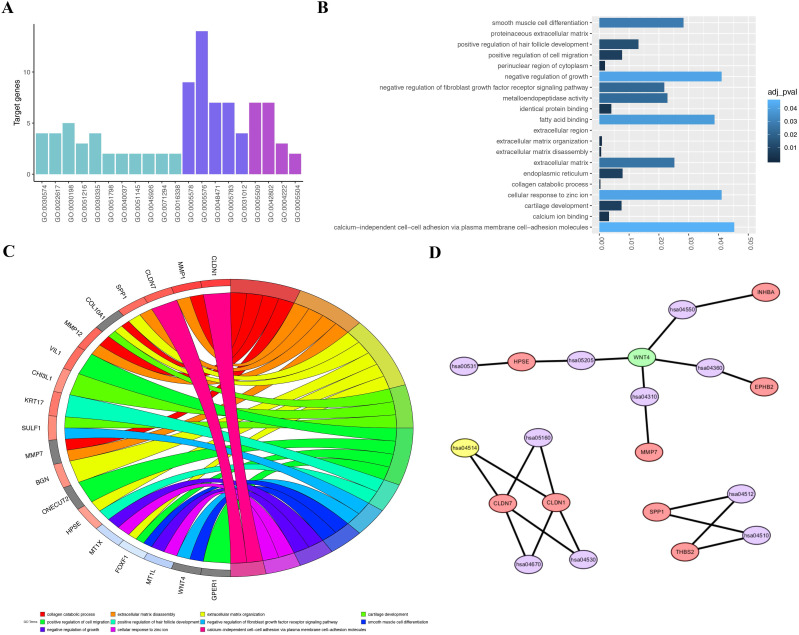
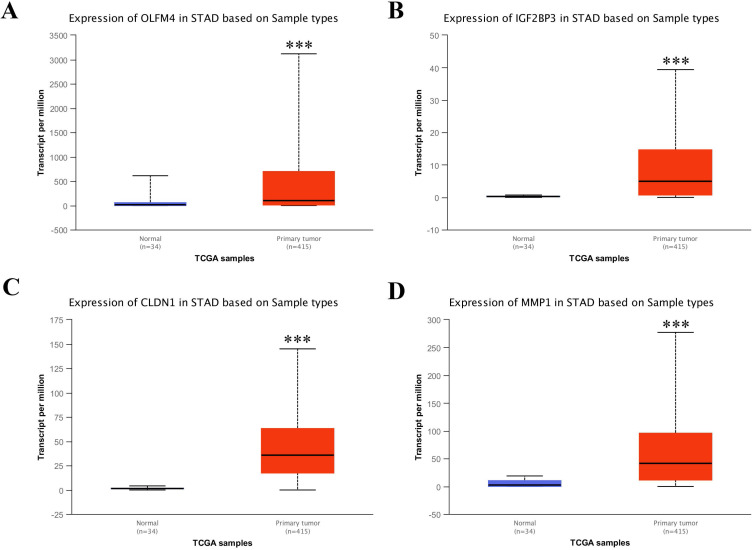
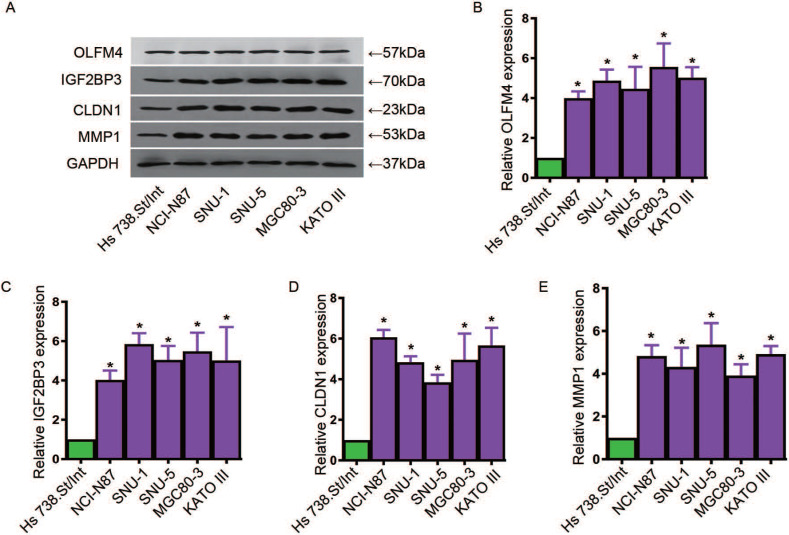
Background: Gastric cancer (GC) has a high mortality rate in cancer-related deaths worldwide. Currently, the pathogenesis of gastric cancer progression remains unclear. Here, we identified several vital candidate genes related to gastric cancer development and revealed the potential pathogenic mechanisms using integrated bioinformatics analysis. Methods: Two microarray datasets from Gene Expression Omnibus (GEO) database integrated. Limma package was used to analyze differentially expressed genes (DEGs) between GC and matched normal specimens. DAVID was utilized to conduct Gene ontology (GO) and KEGG enrichment analysis. The relative expression of OLFM4, IGF2BP3, CLDN1 and MMP1were analyzed based on TCGA database provided by UALCAN. Western blot and quantitative real time PCR assay were performed to determine the protein and mRNA levels of OLFM4, IGF2BP3, CLDN1 and MMP1 in GC tissues and cell lines, respectively. Results: We downloaded the expression profiles of GSE103236 and GSE118897 from the Gene Expression Omnibus (GEO) database. Two integrated microarray datasets were used to obtain differentially expressed genes (DEGs), and bioinformatics methods were used for in-depth analysis. After gene ontology (GO) and Kyoto Encyclopedia of Genes and Genomes (KEGG) pathway enrichments analysis, we identified 61 DEGs in common, of which the expression of 34 genes were elevated and 27 genes were decreased. GO analysis displayed that the biological functions of DEGs mainly focused on negative regulation of growth, fatty acid binding, cellular response to zinc ion and calcium-independent cell-cell adhesion. KEGG pathway analysis demonstrated that these DEGs mainly related to the Wnt and tumor signaling pathway. Interestingly, we found 4 genes were most significantly upregulated in the DEGs, which were OLFM4, IGF2BP3, CLDN1 and MMP1. Then, we confirmed the upregulation of these genes in STAD based on sample types. In the final, western blot and qRT-PCR assay were performed to determine the protein and mRNA levels of OLFM4, IGF2BP3, CLDN1 and MMP1 in GC tissues and cell lines. Conclusion: In our study, using integrated bioinformatics to screen DEGs in gastric cancer could benefit us for understanding the pathogenic mechanism underlying gastric cancer progression. Meanwhile, we also identified four significantly upregulated genes in DEGs from both two datasets, which might be used as the biomarkers for early diagnosis and prevention of gastric cancer.
Keywords: GEO data; differentially expressed genes; gastric cancer; integrated bioinformatics.
© The author(s).
Conflict of interest statement
Competing Interests: The authors have declared that no competing interest exists.
Figures

Similar articles
-
FN1, SPARC, and SERPINE1 are highly expressed and significantly related to a poor prognosis of gastric adenocarcinoma revealed by microarray and bioinformatics.Sci Rep. 2019 May 24;9(1):7827. doi: 10.1038/s41598-019-43924-x. Sci Rep. 2019. PMID: 31127138 Free PMC article.
-
Identification of Hub Genes and Pathways in Gastric Adenocarcinoma Based on Bioinformatics Analysis.Med Sci Monit. 2020 Feb 14;26:e920261. doi: 10.12659/MSM.920261. Med Sci Monit. 2020. PMID: 32058995 Free PMC article.
-
Integrated bioinformatics analysis reveals novel key biomarkers and potential candidate small molecule drugs in gastric cancer.Pathol Res Pract. 2019 May;215(5):1038-1048. doi: 10.1016/j.prp.2019.02.012. Epub 2019 Feb 28. Pathol Res Pract. 2019. PMID: 30975489
-
Exploring nasopharyngeal carcinoma genetics: Bioinformatics insights into pathways and gene associations.Med J Malaysia. 2024 Sep;79(5):615-625. Med J Malaysia. 2024. PMID: 39352166 Review.
-
Identification of hub genes in placental dysfunction and recurrent pregnancy loss through transcriptome data mining: A meta-analysis.Taiwan J Obstet Gynecol. 2024 May;63(3):297-306. doi: 10.1016/j.tjog.2024.01.035. Taiwan J Obstet Gynecol. 2024. PMID: 38802191 Review.
Cited by
-
Role of SPP1 in the diagnosis of gastrointestinal cancer.Oncol Lett. 2023 Aug 7;26(3):411. doi: 10.3892/ol.2023.13997. eCollection 2023 Sep. Oncol Lett. 2023. PMID: 37614657 Free PMC article.
-
The Identification of Novel Therapeutic Biomarkers in Rheumatoid Arthritis: A Combined Bioinformatics and Integrated Multi-Omics Approach.Int J Mol Sci. 2025 Mar 19;26(6):2757. doi: 10.3390/ijms26062757. Int J Mol Sci. 2025. PMID: 40141401 Free PMC article.
-
EFNA4 deletion suppresses the migration, invasion, stemness, and angiogenesis of gastric cancer cells through the inactivation of Pygo2/Wnt signaling.Histol Histopathol. 2025 Mar;40(3):343-356. doi: 10.14670/HH-18-779. Epub 2024 Jun 12. Histol Histopathol. 2025. PMID: 38953488
-
Olfactomedin 4 promotes gastric cancer cell G2/M progression and serves as a therapeutic target in gastric adenocarcinoma.Carcinogenesis. 2025 Apr 3;46(2):bgaf010. doi: 10.1093/carcin/bgaf010. Carcinogenesis. 2025. PMID: 40056162
-
Identifying ferroptosis-related genes in lung adenocarcinoma using random walk with restart in the PPI network.Sci Rep. 2025 Aug 6;15(1):28832. doi: 10.1038/s41598-025-14307-2. Sci Rep. 2025. PMID: 40770024 Free PMC article.
References
-
- Siegel RL, Miller KD, Jemal A. Cancer statistics, 2019. CA: a cancer journal for clinicians. 2019;69:7–34. - PubMed
-
- Torre LA, Bray F, Siegel RL, Ferlay J, Lortet-Tieulent J, Jemal A. Global cancer statistics, 2012. CA: a cancer journal for clinicians. 2015;65:87–108. - PubMed
-
- Van Cutsem E, Sagaert X, Topal B, Haustermans K, Prenen H. Gastric cancer. Lancet. 2016;388:2654–64. - PubMed
-
- Zong L, Abe M, Seto Y, Ji J. The challenge of screening for early gastric cancer in China. Lancet. 2016;388:2606. - PubMed
MeSH terms
Substances
LinkOut - more resources
Full Text Sources
Other Literature Sources
Medical
Miscellaneous
