. 2020 Dec 15;12(12):7836-7854.
eCollection 2020.

Enzastaurin enhances ATRA-induced differentiation of acute myeloid leukemia cells

Affiliations

Enzastaurin enhances ATRA-induced differentiation of acute myeloid leukemia cells

Ze-Yi Li et al. Am J Transl Res. .

Abstract

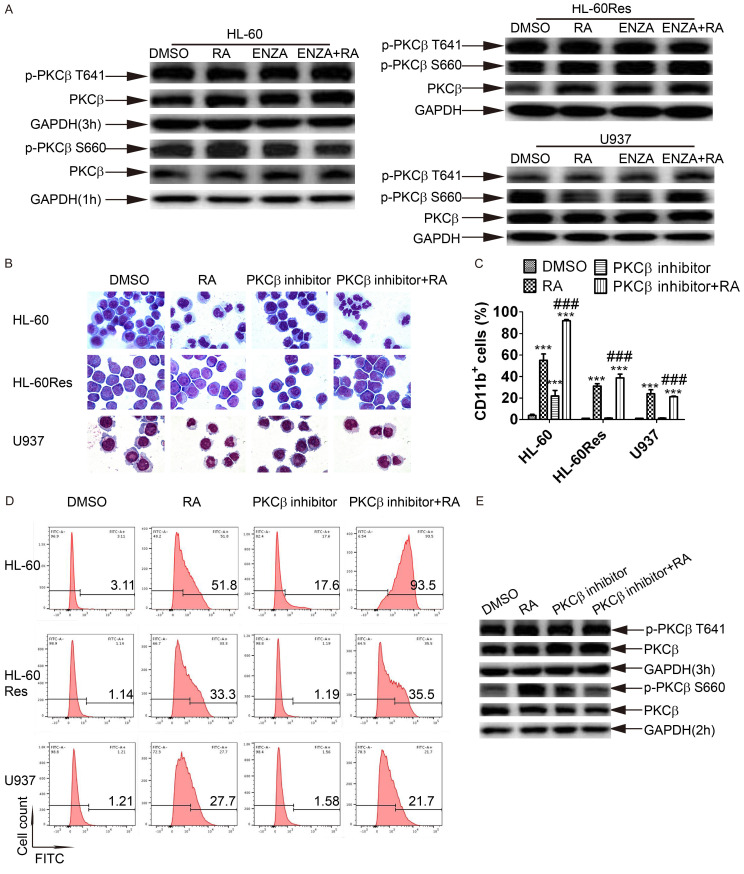
All-trans retinoic acid (ATRA) is considered to be the sole clinically-useful differentiating agent in the treatment of acute myeloid leukemia (AML). However, ATRA has been effective only in acute promyelocytic leukemia (APL) but not other subtypes of AML. Therefore, discovering strategies to sensitize cells to ATRA may lead to the development of ATRA-based treatments in non-APL AML patients. In the present study, a clinically-achievable concentration of enzastaurin enhanced ATRA-induced differentiation in AML cell lines, HL-60 and U937 as well as non-APL AML primary cells. Furthermore, it also restored ATRA sensitivity in ATRA-resistant cell line, HL-60Res. Mechanistically, in all these cell lines, enzastaurin-ATRA (enz-ATRA) co-treatment enhanced the protein levels of PU.1, CCAAT/enhancer-binding protein β (C/EBPβ) and C/EBPε. The activity of protein kinase C β (PKCβ) was suppressed by enz-ATRA treatment in HL-60 and HL-60Res cells. However, another PKCβ-selective inhibitor mimicked the cellular and molecular effects of enzastaurin only in HL-60 cells. Furthermore, in U937 cells, enz-ATRA activated MEK and ERK, and a MEK-specific inhibitor suppressed enz-ATRA-triggered differentiation and reduced the protein levels of PU.1, C/EBPβ and C/EBPε. Enz-ATRA activated Akt in HL-60 and HL-60Res cells. However, an Akt inhibitor blocked enz-ATRA-triggered differentiation and restored the protein levels of PU.1, C/EBPβ and C/EBPε only in HL-60Res cells. Therefore, PKCβ inhibition, MEK/ERK and Akt activation were involved in enz-ATRA-induced differentiation in HL-60, U937 and HL-60Res cells, respectively, via modulation of the protein levels of C/EBPβ, C/EBPε and PU.1. Taken together, our findings may help to guide novel therapeutic strategies for AML patients.

Keywords: Acute myeloid leukemia; all-trans retinoic acid; differentiation; enzastaurin.


Conflict of interest statement

None.

Figures

Figure 1
Figure 1
The effects of enz-ATRA treatment on cell growth and survival in HL-60, HL-60Res and U937 cells. U937 (right column) and HL-60Res (middle column) cells were treated with 1 μM of enzastaurin (1EN), 2 μM of enzastaurin (2EN), 1 μM of ATRA (RA) or an enz-ATRA combination (EN+RA) for the indicated days. HL-60 cells (left column) were treated with 1 μM of enzastaurin (1EN), 2 μM of enzastaurin (2EN), 0.1 μM of ATRA (0.1RA) or enz-ATRA co-treatment (EN+0.1RA) for 4 d. Representative experiments of cell growth (A-C) and cell viability (D-F) are shown. Each value represents the mean ± SD of triplicate samples. Similar results were obtained in three independent experiments. Annexin-V assays of HL-60 (G), U937 (I) and HL-60Res (H) cells treated with enzastaurin and/or ATRA for 4, 3 and 6 d, respectively. Each value represents the mean ± SD of three independent measurements. ***P<0.001 versus DMSO-treated cells.
Figure 2
Figure 2
The effects of enz-ATRA treatment on cell differentiation in HL-60, HL-60Res and U937 cells. (A) HL-60 cells were treated with 1/2 μM of enzastaurin (1EN/2EN) and/or 0.1 μM of ATRA (RA) for 3 d. HL-60Res and U937 cells were treated with 1/2 μM of enzastaurin (1EN/2EN) and/or 1 μM of ATRA (RA) for 10 and 3 d, respectively. One representative morphological image of HL-60 (upper panel), HL-60Res (middle panel) and U937 (lower panel) cells are shown. Magnification is 1,000×. Similar results were obtained in three independent experiments. Differentiation was also evaluated by flow-cytometric analysis of CD11b expression in HL-60 (B), HL-60Res (C) and U937 cells (D) with the indicated treatment for 4, 6 and 3 d, respectively. Each value represents the mean ± SD of three independent measurements. ***P<0.001, versus DMSO-treated cells. ###P<0.001, versus ATRA-treated cells. &&&P<0.001, as compared with 1EN+RA in U937 and HL-60Res cells or 1EN+0.1RA in HL-60 cells. (E) Representative histograms of flow-cytometric analysis of CD11b expression in HL-60, HL-60Res and U937 cells with the indicated treatment for 4, 6 and 3 d, respectively. The percentages of CD11b+ cells are shown in the corresponding panels.
Figure 3
Figure 3
Enzastaurin enhances ATRA-induced differentiation in some primary cells from non-APL AML patients. Primary cells from patients were treated with 2 μM of enzastaurin (EN) and/or 1 μM of ATRA (RA) for 4 d. The morphology (A) and the histograms of flow-cytometric analysis of CD11b expression (B) are shown. Magnification of morphology is 1,000×. The percentages of CD11b+ cells are shown in the corresponding panels.
Figure 4
Figure 4
PKCβ-inhibition mediates enzastaurin-enhanced ATRA-triggered differentiation in HL-60 cells. A. HL-60 cells were treated with 2 μM of enzastaurin (EN) and/or 0.1 μM of ATRA (RA) for 1 or 3 h. HL-60Res and U937 cells were treated with 2 μM of enzastaurin (EN) and/or 1 μM of ATRA (RA) for 3 h. The activation of PKCβ was evaluated by western blotting analysis of phosphorylated PKCβ at serine 660 and threonine 641. The same membrane incubated with anti-phospho-PKCβ was stripped and followed by detection of PKCβ. Since diverse time points for collecting protein were used, each has the expression of GAPDH as an internal control. B. HL-60 cells were treated with 500 nM of PKCβ inhibitor and/or 0.1 μM of ATRA (RA) for 3 d. HL-60Res cells were treated with 200 nM of PKCβ inhibitor and/or 1 μM of ATRA (RA) for 10 d. U937 cells were treated with 100 nM of PKCβ inhibitor and/or 1 μM of ATRA (RA) for 3 d. Representative morphologies of HL-60, HL-60Res and U937 cells are shown. Magnification is 1,000×. Similar results were obtained in three independent experiments. C. Differentiation was also evaluated by flow-cytometric analysis of CD11b expression in HL-60, HL-60Res and U937 cells with the indicated treatment for 4, 6 and 3 d, respectively. Each value represents the mean ± SD of three independent measurements. ***P<0.001, versus DMSO-treated cells. ###P<0.001, versus ATRA-treated cells. D. Representative histograms of flow-cytometric analysis of CD11b expression in HL-60, HL-60Res and U937 cells with the indicated treatment for 4, 6 and 3 d, respectively. The percentages of CD11b+ cells are shown in the corresponding panels. E. HL-60 cells were treated with 500 nM of PKCβ inhibitor and/or 0.1 μM of ATRA (RA) for 2 or 3 h. Phosphorylation of PKCβ was measured by western blotting analysis. The same membrane incubated with anti-phospho-PKCβ was stripped and followed by detection of PKCβ. Since diverse time points for collecting protein were used, each has the expression of GAPDH as internal control.
Figure 5
Figure 5
Enz-ATRA or PKCβ-inhibitor/ATRA treatment increases the protein levels of C/EBPβ, C/EBPε and PU.1, while enz-ATRA treatment activates MEK/ERK pathway only in U937 cells. HL-60 cells (upper left) were treated with 2 μM of enzastaurin (EN) and/or 0.1 μM of ATRA (RA) for 24 h. For the PKCβ inhibitor, 500 nM was used in HL-60 cells for 24 h (lower right). U937 cells (lower left) were treated with 2 μM of enzastaurin (EN) and/or 1 μM of ATRA (RA) for 6, 12 or 24 h. HL-60Res (upper right) cells were treated with 2 μM of enzastaurin (EN) and/or 1 μM of ATRA (RA) for 48 or 72 h. The same membrane incubated with the antibodies to phosphorylated Erk1/2 or MEK1/2 was stripped and followed by detection of MEK and ERK1/2. Since diverse time points for collecting protein were used, each has the expression of GAPDH as internal control. Similar results were obtained in three independent experiments.
Figure 6
Figure 6
MEK/ERK inhibition suppresses enz-ATRA-triggered differentiation and restores the protein levels of C/EBPβ, C/EBPε and PU.1 only in U937 cells. HL-60, HL-60Res and U937 cells were pretreated with 0.01 μM, 0.1 μM and 5 μM of trametinib, respectively, for 2 h. A. The attenuation of MEK activation by trametinib (T) was detected by western blotting analysis of phosphorylated ERK1/2 in HL-60, HL-60Res and U937 cells with indicated treatments for 24, 48 or 4 h, respectively. The same membrane incubated with the antibodies to phosphorylated Erk1/2 was stripped and followed by detection of ERK1/2. The expression of GAPDH was evaluated as internal control. Similar results were obtained in three independent experiments. B. Effects of trametinib on morphologies in HL-60, HL-60Res and U937 cells incubated with the indicated drugs for 4, 10 or 3 d, respectively. The magnification is 1,000×. One representative experiment among three independent assays is shown. Similar results were obtained in three independent experiments. C. Differentiation was also evaluated by flow-cytometric analysis of CD11b expression in HL-60, HL-60Res and U937 cells with the indicated treatment for 4, 6 or 3 d, respectively. Each value represents the mean ± SD of three independent measurements. ###P<0.001, as compared with 2EN+RA in U937 and HL-60Res cells or 2EN+0.1RA in HL-60 cells. D. Representative histograms of flow-cytometric analysis of CD11b expression in HL-60, HL-60Res and U937 cells with the indicated treatment for 4, 6 and 3 d, respectively. The percentages of CD11b+ cells are shown in the corresponding panels. E. The protein levels of C/EBPβ, C/EBPε and PU.1 in U937 cells with the indicated drugs for 24 h, were assayed by western blotting. The expression of GAPDH was evaluated as internal control. Similar results were obtained in three independent experiments.
Figure 7
Figure 7
AKT activation is required for enz-ATRA-induced differentiation and enhanced protein levels of C/EBPβ, C/EBPε and PU.1 in HL-60Res cells. A. HL-60 cells were treated with 2 μM of enzastaurin (EN) and/or 0.1 μM of ATRA (RA) for 48 h. HL-60Res cells were treated with 2 μM of enzastaurin (EN) and/or 1 μM of ATRA (RA) for 72 h. The activation of AKT was evaluated by western blotting analysis of phosphorylated AKT at serine 473 and threonine 308. The same membrane incubated with anti-phospho-AKT was stripped and followed by detection of AKT. The expression of GAPDH was evaluated as internal control. Similar results were obtained in three independent experiments. B. The attenuation of AKT activation by LY294002 (LY) was detected by western blotting analysis of phosphorylated AKT in HL-60 and HL-60Res cells with indicated treatments for 48 or 72 h, respectively. The same membrane incubated with the anti-phospho-AKT was stripped and followed by detection of AKT. The expression of GAPDH was evaluated as internal control. Similar results were obtained in three independent experiments. C. The effects of LY294002 on morphologies in HL-60 and HL-60Res cells incubated with the indicated drugs for 4 or 10 d, respectively. The magnification is 1,000×. One representative experiment among three independent assays is shown. Similar results were obtained in three independent experiments. D. Differentiation was also evaluated by flow-cytometric analysis of CD11b expression in HL-60 and HL-60Res cells with the indicated treatment for 4 or 6 d, respectively. Each value represents the mean ± SD of three independent measurements. ###P<0.001, as compared with 2EN+RA in HL-60Res cells. E. Representative histograms of flow-cytometric analysis of CD11b expression in HL-60 and HL-60Res cells with the indicated treatment for 4 or 6 d, respectively. The percentages of CD11b+ cells are shown in the corresponding panels. F. The protein levels of C/EBPβ, C/EBPε and PU.1 in HL-60Res cells with the indicated drugs for 72 h, were assayed by western blotting. The expression of GAPDH was evaluated as internal control. Similar results were obtained in three independent experiments.

Similar articles

Cited by

References

    1. Döhner H, Weisdorf DJ, Bloomfield CD. Acute myeloid leukemia. N Engl J Med. 2015;373:1136–1152. - PubMed
    1. Bohl SR, Bullinger L, Rücker FG. New targeted agents in acute myeloid leukemia: new hope on the rise. Int J Mol Sci. 2019;20:1983. - PMC - PubMed
    1. Huang ME, Ye YC, Chen SR, Chai JR, Lu JX, Zhoa L, Gu LJ, Wang ZY. Use of all-trans retinoic acid in the treatment of acute promyelocytic leukemia. Blood. 1988;72:567–572. - PubMed
    1. Tallman MS. Differentiating therapy with all-trans retinoic acid in acute myeloid leukemia. Leukemia. 1996;10(Suppl 1):S12–S15. - PubMed
    1. Schlenk RF, Döhner K, Kneba M, Götze K, Hartmann F, Del Valle F, Kirchen H, Koller E, Fischer JT, Bullinger L, Habdank M, Späth D, Groner S, Krebs B, Kayser S, Corbacioglu A, Anhalt A, Benner A, Fröhling S, Döhner H. Gene mutations and response to treatment with all-trans retinoic acid in elderly patients with acute myeloid leukemia. Results from the AMLSG Trial AML HD98B. Haematologica. 2009;94:54–60. - PMC - PubMed

LinkOut - more resources