. 2020 Nov 13;11(1):199-213.
doi: 10.1002/ece3.7010. eCollection 2021 Jan.

Geographical pattern of genetic diversity in Capsella bursa-pastoris (Brassicaceae)-A global perspective

Affiliations

Geographical pattern of genetic diversity in Capsella bursa-pastoris (Brassicaceae)-A global perspective

Christina Wesse et al. Ecol Evol. .

Abstract

We analyzed the global genetic variation pattern of Capsella bursa-pastoris (Brassicaceae) as expressed in allozymic (within-locus) diversity and isozymic (between-locus) diversity. Results are based on a global sampling of more than 20,000 C. bursa-pastoris individuals randomly taken from 1,469 natural provenances in the native and introduced range, covering a broad spectrum of the species' geographic distribution. We evaluated data for population genetic parameters and F-statistics, and Mantel tests and AMOVA were performed. Geographical distribution patterns of alleles and multilocus genotypes are shown in maps and tables. Genetic diversity of introduced populations is only moderately reduced in comparison with native populations. Global population structure was analyzed with structure, and the obtained cluster affiliation was tested independently with classification approaches and macroclimatic data using species distribution modeling. Analyses revealed two main clusters: one distributed predominantly in warm arid to semiarid climate regions and the other predominantly in more temperate humid to semihumid climate regions. We observed admixture between the two lineages predominantly in regions with intermediate humidity in both the native and non-native ranges. The genetically derived clusters are strongly supported in macroclimatic data space. The worldwide distribution patterns of genetic variation in the range of C. bursa-pastoris can be explained by intensive intra- and intercontinental migration, but environmental filtering due to climate preadaption seems also involved. Multiple independent introductions of genotypes from different source regions are obvious. "Endemic" genotypes might be the outcome of admixture or of de novo mutation. We conclude that today's successfully established Capsella genotypes were preadapted and found matching niche conditions in the colonized range parts.

Keywords: Capsella bursa‐pastoris; adaptation; colonization; macroclimate; multilocus genotypes; species distribution model.


Conflict of interest statement

The authors have no conflicts of interest to declare.

Figures

Figure 1
Figure 1
(a) Allele frequencies of Capsella bursa‐pastorisin different regions (LocusAat1). (b) Allele frequencies ofC. bursa‐pastorisin different regions (LocusAat2). (c) Allele frequencies ofC. bursa‐pastorisin different regions (LocusAat3). (d) Allele frequencies of C. bursa‐pastorisin different regions (LocusGdh2). (e) Allele frequencies ofCapsella bursa‐pastorisin different regions (LocusLap3).AFR, Africa; AUS, Australasia; BRT, British Isles; CAL, California; EEU, Eastern Europe; IBE, Iberian Peninsula; M + SA, Middle and South America; M + WE, Middle and Western Europe; MED, circum‐Mediterranean region; NAM, North America except California. Black dots: sample locations, grey areas: distribution ofC. bursa‐pastoris based on data compiled by EW (CDH, 2018)
Figure 2
Figure 2
Rank statistics of genotype diversity of Capsella bursa‐pastoris within different regions. Order 1: highest diversity, order 12: lowest diversity. AFR, Africa; AUS, Australasia; BRT, British Isles; CAL, California; EEU, Eastern Europe; IBE, Iberian Peninsula; M + SA, Middle and South America; M + WE, Middle and Western Europe; MED, circum‐Mediterranean region; NAM, North America except California
Figure 3
Figure 3
SSWP/n ‐ 1 diversity values of Capsella bursa‐pastoris populations within the native (pre‐Columbian) and introduced (post‐Columbian) regions. AMOVA tested for differences among groups. IBE: Iberian Peninsula; BRT: British Isles; M+WE: Middle and Western Europe; MED: Circum‐Mediterranean region; EEU: Eastern Europe; CAL: California; NAM: North America except California; M+SA: Middle and South America; AUS: Australasia; AFR: Africa
Figure 4
Figure 4
Tree bar plot showing a combination of a hierarchical clustering approach (UPGMA, average linkage) with the results of the Bayesian K‐means algorithm provided with the structure software. Each strip of the bar plot represents a sampled individual and is approximately matched by the respective tips of the hierarchical cluster tree. The central black line across the bar plots indicates the dividing line between the individual samples designated to the respective two main UPGMA clusters
Figure 5
Figure 5
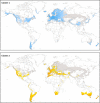
Mapped results of the K = 2 solution of the Bayesian K‐means population structure analysis of Capsella bursa‐pastoris sampling sites. Proportional cluster affiliation of the analyzed populations is displayed with pie charts. Blue: estimated proportion of individuals belonging to Cluster 1. Orange: estimated proportion of individuals belonging to Cluster 2.Black dots: sample locations, grey areas: distribution of C.bursa‐pastoris based on data compiled by EW (CDH, 2018)
Figure 6
Figure 6
Proportional cluster affiliation of Capsella bursa‐pastoris assigned to GEnS (Metzger et al., 2013) climate type regions. Blue: Cluster 1. Orange: Cluster 2
Figure 7
Figure 7
Species distribution models (SDM) for Capsella bursa‐pastoris: Occurrence of the obtained clusters projected to the current climate (MaxEnt). Both cluster distributions could be modeled with high accuracy based on macroclimatic data. Grey areas: distribution of C.bursa‐pastoris based on data compiled by EW (CDH, 2018)

References

    1. Barrett, S. C. (2015). Foundations of invasion genetics: The Baker and Stebbins legacy. Molecular Ecology, 24(9), 1927–1941. 10.1111/mec.13014 - DOI - PubMed
    1. Bock, D. G. , Caseys, C. , Cousens, R. D. , Hahn, M. A. , Heredia, S. M. , Hübner, S. , Turner, K. G. , Whitney, K. D. , & Rieseberg, L. H. (2015). What we still don't know about invasion genetics. Molecular Ecology, 24(9), 2277–2297. 10.1111/mec.13032 - DOI - PubMed
    1. Bossdorf, O. , Auge, H. , Lafuma, L. , Rogers, W. E. , Siemann, E. , & Prati, D. (2005). Phenotypic and genetic differentiation between native and introduced plant populations. Oecologia, 144(1), 1–11. 10.1007/s00442-005-0070-z - DOI - PubMed
    1. Brown, A. H. D. , Matheson, A. C. , & Eldridge, K. G. (1975). Estimation of the mating system of Eucalyptus obliqua L'Herit. by using allozyme polymorphisms. Australian Journal of Botany, 23(6), 931–949.
    1. Brown, A. H. D. , & Weir, B. S. (1983). Measuring genetic variability in plant populations In Tanksley S. D., & Ortin T. J. (Eds.), Isozymes in plant genetics and breeding, part A (pp. 219–239). Elsevier.

LinkOut - more resources