Geographic range estimates and environmental requirements for the harpy eagle derived from spatial models of current and past distribution
- PMID: 33437444
- PMCID: PMC7790654
- DOI: 10.1002/ece3.7068
Geographic range estimates and environmental requirements for the harpy eagle derived from spatial models of current and past distribution
Abstract
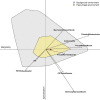
Understanding species-environment relationships is key to defining the spatial structure of species distributions and develop effective conservation plans. However, for many species, this baseline information does not exist. With reliable presence data, spatial models that predict geographic ranges and identify environmental processes regulating distribution are a cost-effective and rapid method to achieve this. Yet these spatial models are lacking for many rare and threatened species, particularly in tropical regions. The harpy eagle (Harpia harpyja) is a Neotropical forest raptor of conservation concern with a continental distribution across lowland tropical forests in Central and South America. Currently, the harpy eagle faces threats from habitat loss and persecution and is categorized as Near-Threatened by the International Union for the Conservation of Nature (IUCN). Within a point process modeling (PPM) framework, we use presence-only occurrences with climatic and topographical predictors to estimate current and past distributions and define environmental requirements using Ecological Niche Factor Analysis. The current PPM prediction had high calibration accuracy (Continuous Boyce Index = 0.838) and was robust to null expectations (pROC ratio = 1.407). Three predictors contributed 96% to the PPM prediction, with Climatic Moisture Index the most important (72.1%), followed by minimum temperature of the warmest month (15.6%) and Terrain Roughness Index (8.3%). Assessing distribution in environmental space confirmed the same predictors explaining distribution, along with precipitation in the wettest month. Our reclassified binary model estimated a current range size 11% smaller than the current IUCN range polygon. Paleoclimatic projections combined with the current model predicted stable climatic refugia in the central Amazon, Guyana, eastern Colombia, and Panama. We propose a data-driven geographic range to complement the current IUCN range estimate and that despite its continental distribution, this tropical forest raptor is highly specialized to specific environmental requirements.
Keywords: Harpia harpyja; Neotropical raptors; geographic range size; harpy eagle; point process models; species distribution models.
© 2020 The Authors. Ecology and Evolution published by John Wiley & Sons Ltd.
Conflict of interest statement
None declared.
Figures


References
-
- Aarts, G. , Fieberg, J. , & Matthiopoulos, J. (2012). Comparative interpretation of count, presence–absence and point methods for species distribution models. Methods in Ecology and Evolution, 3, 177–187.
-
- Aiello‐Lammens, M. E. , Boria, R. A. , Radosavljevic, A. , Vilela, B. , & Anderson, R. P. (2015). spThin: An R package for spatial thinning of species occurrence records for use in ecological niche models. Ecography, 38, 541–545.
-
- Akaike, H. (1974). A new look at the statistical model identification. IEEE Transactions on Automatic Control, AC‐19, 716–723.
-
- Atauchi, P. J. (2018). sdStaf: Species Distribution and Stability Future Models. R Package Version 1.0.2. Retrieved from https://CRAN.R‐project.org/package=sdStaf
-
- Barbet‐Massin, M. , Jiguet, F. , Albert, C. H. , & Thuiller, W. (2012). Selecting pseudo‐absences for species distribution models: How, where and how many? Methods in Ecology and Evolution, 3, 327–338.
Associated data
LinkOut - more resources
Full Text Sources
Other Literature Sources
Research Materials
Miscellaneous

