

Models for estimating and projecting global, regional and national prevalence and disease burden of asthma: a systematic review
- PMID: 33437461
- PMCID: PMC7774028
- DOI: 10.7189/jogh.10.020409
Models for estimating and projecting global, regional and national prevalence and disease burden of asthma: a systematic review
Abstract
Background: Statistical models are increasingly being used to estimate and project the prevalence and burden of asthma. Given substantial variations in these estimates, there is a need to critically assess the properties of these models and assess their transparency and reproducibility. We aimed to critically appraise the strengths, limitations and reproducibility of existing models for estimating and projecting the global, regional and national prevalence and burden of asthma.
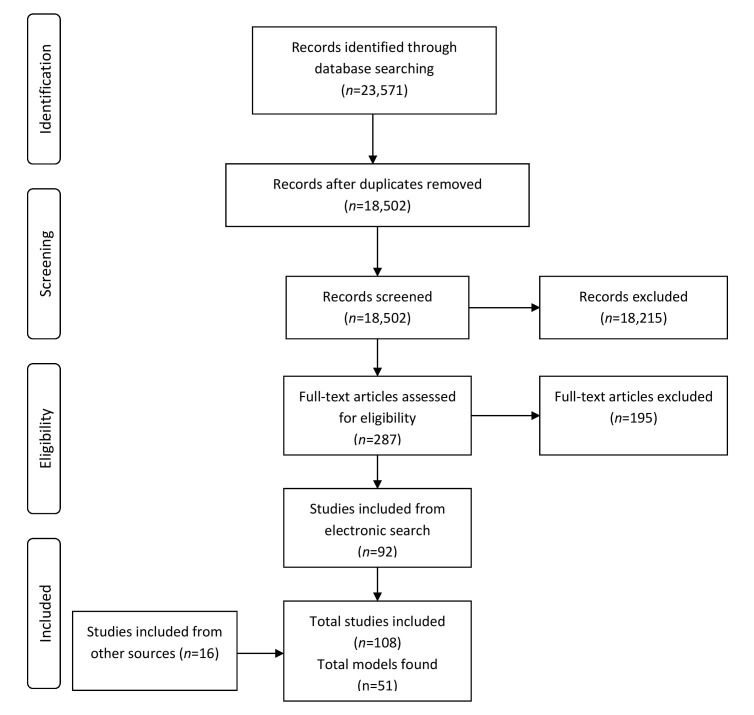
Methods: We undertook a systematic review, which involved searching Medline, Embase, World Health Organization Library and Information Services (WHOLIS) and Web of Science from 1980 to 2017 for modelling studies. Two reviewers independently assessed the eligibility of studies for inclusion and then assessed their strengths, limitations and reproducibility using pre-defined quality criteria. Data were descriptively and narratively synthesised.
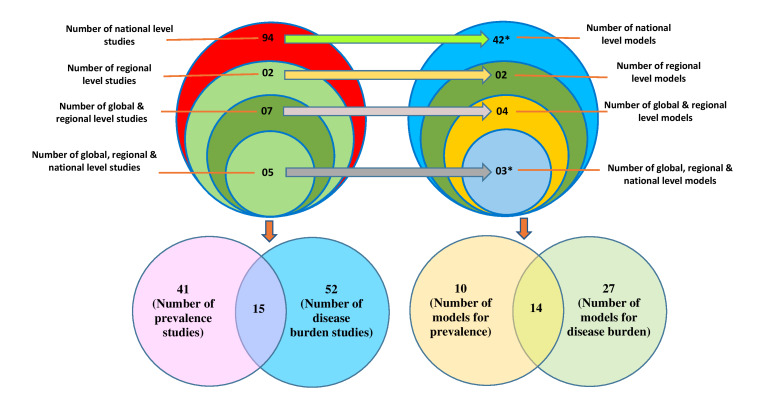
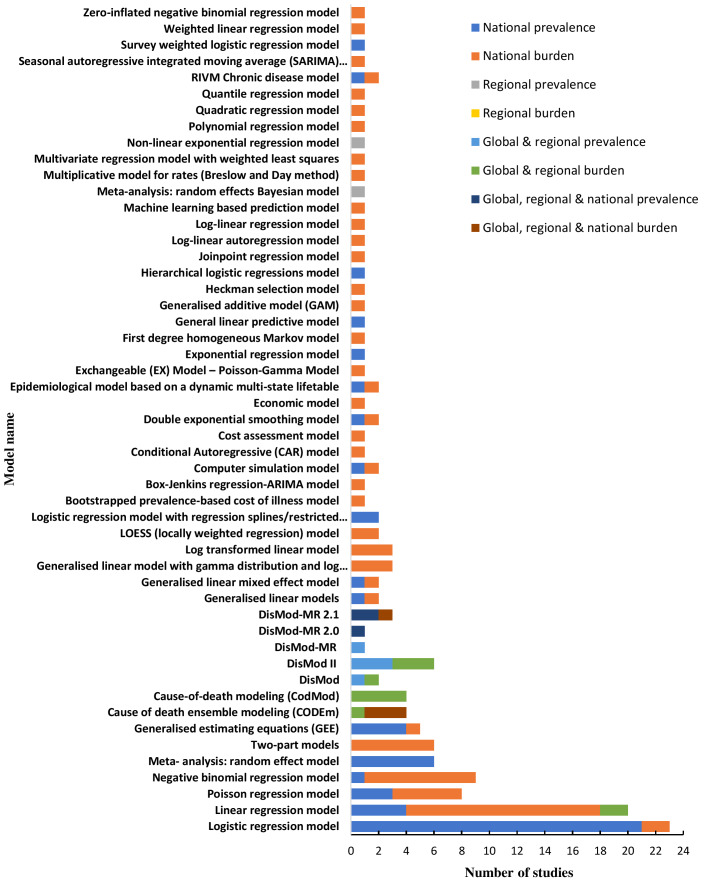
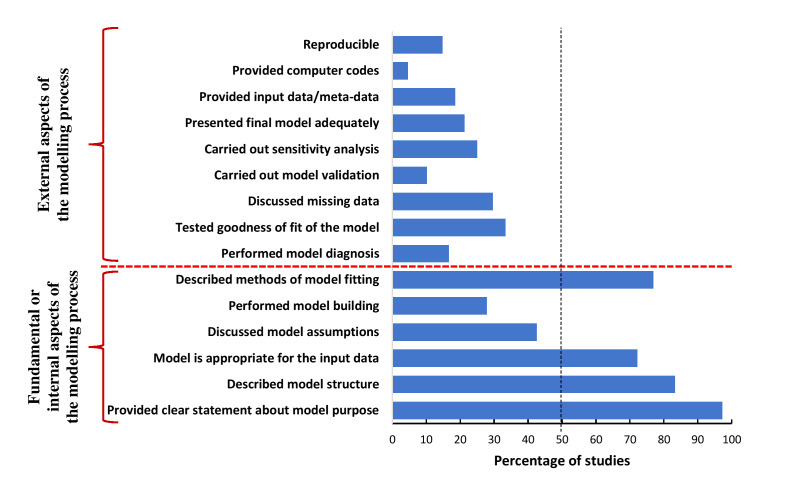
Results: We identified 108 eligible studies, which employed a total of 51 models: 42 models were used to derive national level estimates, two models for regional estimates, four models for global and regional estimates and three models for global, regional and national estimates. Ten models were used to estimate the prevalence of asthma, 27 models estimated the burden of asthma - including, health care service utilisation, disability-adjusted life years, mortality and direct and indirect costs of asthma - and 14 models estimated both the prevalence and burden of asthma. Logistic and linear regression models were most widely used for national estimates. Different versions of the DisMod-MR- Bayesian meta-regression models and Cause Of Death Ensemble model (CODEm) were predominantly used for global, regional and national estimates. Most models suffered from a number of methodological limitations - in particular, poor reporting, insufficient quality and lack of reproducibility.
Conclusions: Whilst global, regional and national estimates of asthma prevalence and burden continue to inform health policy and investment decisions on asthma, most models used to derive these estimates lack the required reproducibility. There is a need for better-constructed models for estimating and projecting the prevalence and disease burden of asthma and a related need for better reporting of models, and making data and code available to facilitate replication.
Copyright © 2020 by the Journal of Global Health. All rights reserved.
Conflict of interest statement
Competing interests: The authors have completed the ICMJE Unified Competing Interest form (available on request from the corresponding author) and declare no competing interest.
Figures
Similar articles
-
Models for estimating and projecting global, regional and national prevalence and disease burden of asthma: protocol for a systematic review.BMJ Open. 2017 May 17;7(5):e015441. doi: 10.1136/bmjopen-2016-015441. BMJ Open. 2017. PMID: 28515197 Free PMC article.
-
Beyond the black stump: rapid reviews of health research issues affecting regional, rural and remote Australia.Med J Aust. 2020 Dec;213 Suppl 11:S3-S32.e1. doi: 10.5694/mja2.50881. Med J Aust. 2020. PMID: 33314144
-
The global, regional, and national burden of inflammatory bowel disease in 195 countries and territories, 1990-2017: a systematic analysis for the Global Burden of Disease Study 2017.Lancet Gastroenterol Hepatol. 2020 Jan;5(1):17-30. doi: 10.1016/S2468-1253(19)30333-4. Epub 2019 Oct 21. Lancet Gastroenterol Hepatol. 2020. PMID: 31648971 Free PMC article.
-
Global, regional, and national burden of 12 mental disorders in 204 countries and territories, 1990-2019: a systematic analysis for the Global Burden of Disease Study 2019.Lancet Psychiatry. 2022 Feb;9(2):137-150. doi: 10.1016/S2215-0366(21)00395-3. Epub 2022 Jan 10. Lancet Psychiatry. 2022. PMID: 35026139 Free PMC article.
-
World Health Organization Estimates of the Global and Regional Disease Burden of 22 Foodborne Bacterial, Protozoal, and Viral Diseases, 2010: A Data Synthesis.PLoS Med. 2015 Dec 3;12(12):e1001921. doi: 10.1371/journal.pmed.1001921. eCollection 2015 Dec. PLoS Med. 2015. PMID: 26633831 Free PMC article. Review.
Cited by
-
Burden attributable to Iodine deficiency in Iran from 1990 to 2019: findings from Global Burden of Disease study.J Prev Med Hyg. 2025 Jan 31;65(4):E524-E531. doi: 10.15167/2421-4248/jpmh2024.65.4.3271. eCollection 2024 Dec. J Prev Med Hyg. 2025. PMID: 40026428 Free PMC article.
-
Global disease burden and its attributable risk factors of peripheral arterial disease.Sci Rep. 2023 Nov 14;13(1):19898. doi: 10.1038/s41598-023-47028-5. Sci Rep. 2023. PMID: 37963985 Free PMC article.
-
Burden of Aortic Aneurysm and Its Attributable Risk Factors from 1990 to 2019: An Analysis of the Global Burden of Disease Study 2019.Front Cardiovasc Med. 2022 May 31;9:901225. doi: 10.3389/fcvm.2022.901225. eCollection 2022. Front Cardiovasc Med. 2022. PMID: 35711350 Free PMC article.
-
Variations in disease burden of laryngeal cancer attributable to alcohol use and smoking in 204 countries or territories, 1990-2019.BMC Cancer. 2021 Oct 7;21(1):1082. doi: 10.1186/s12885-021-08814-4. BMC Cancer. 2021. PMID: 34620148 Free PMC article.
-
Trends in pulmonary arterial hypertension: insights from Global Burden of Disease 1990-2021.BMJ Open. 2025 Mar 18;15(3):e095348. doi: 10.1136/bmjopen-2024-095348. BMJ Open. 2025. PMID: 40107705 Free PMC article.
References
-
- Lozano R, Naghavi M, Foreman K, Lim S, Shibuya K, Aboyans V, et al. Global and regional mortality from 235 causes of death for 20 age groups in 1990 and 2010: a systematic analysis for the Global Burden of Disease Study 2010. Lancet. 2012;380:2095-128. 10.1016/S0140-6736(12)61728-0 - DOI - PMC - PubMed
-
- Global Burden of Disease Study 2013 Collaborators Global, regional, and national incidence, prevalence, and years lived with disability for 301 acute and chronic diseases and injuries in 188 countries, 1990-2013: a systematic analysis for the Global Burden of Disease Study 2013. Lancet. 2015;386:743-800. 10.1016/S0140-6736(15)60692-4 - DOI - PMC - PubMed
Publication types
MeSH terms
LinkOut - more resources
Full Text Sources
Medical