Review
. 2020 Nov 23;8(1):2001983.
doi: 10.1002/advs.202001983. eCollection 2020 Jan.

High Frequency Sonoprocessing: A New Field of Cavitation-Free Acoustic Materials Synthesis, Processing, and Manipulation

Affiliations
Review

High Frequency Sonoprocessing: A New Field of Cavitation-Free Acoustic Materials Synthesis, Processing, and Manipulation

Amgad R Rezk et al. Adv Sci (Weinh). .

Abstract

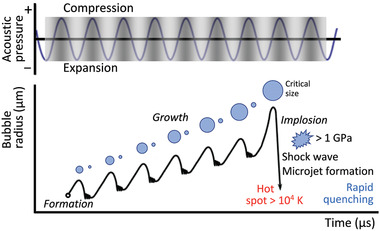
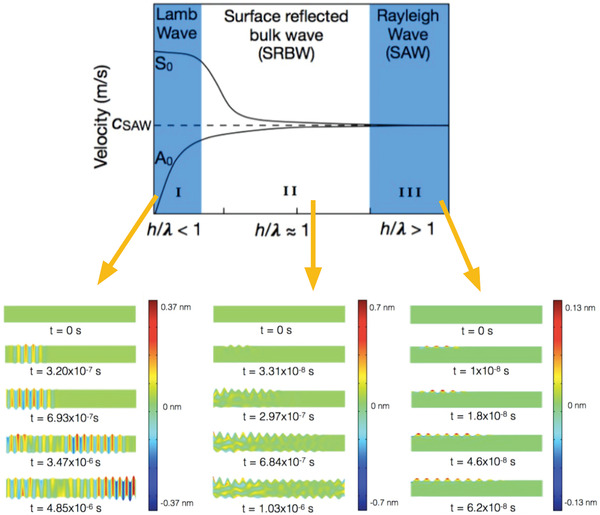
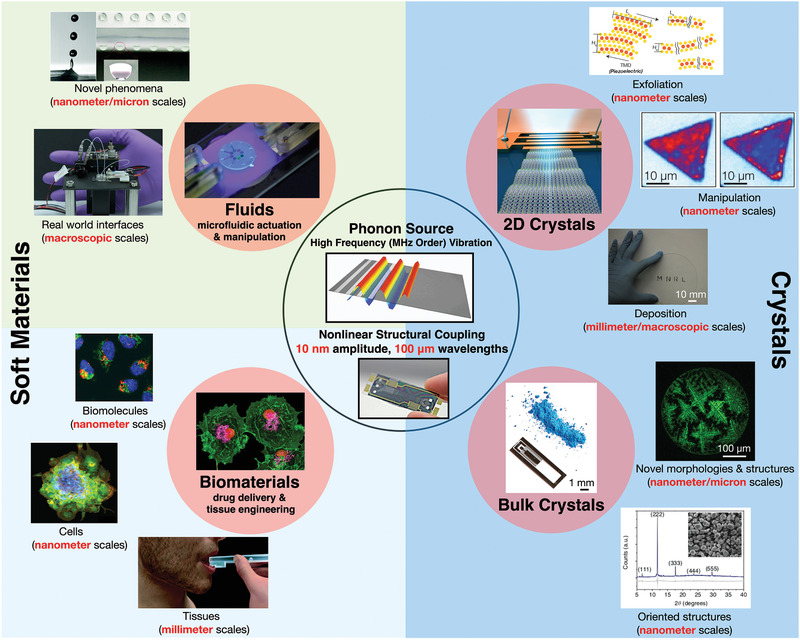
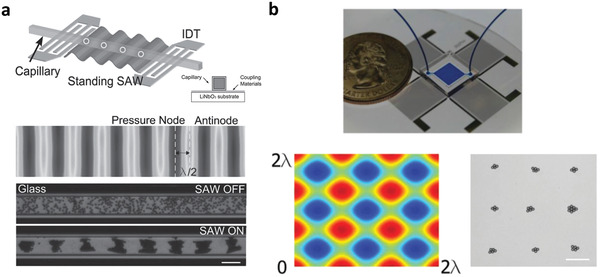
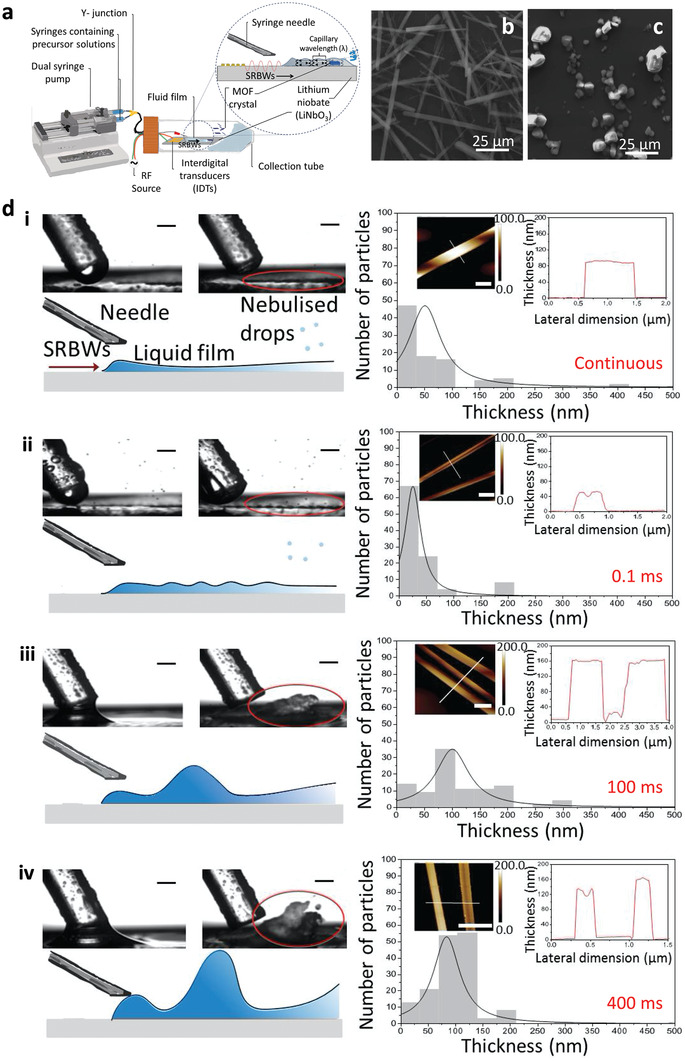
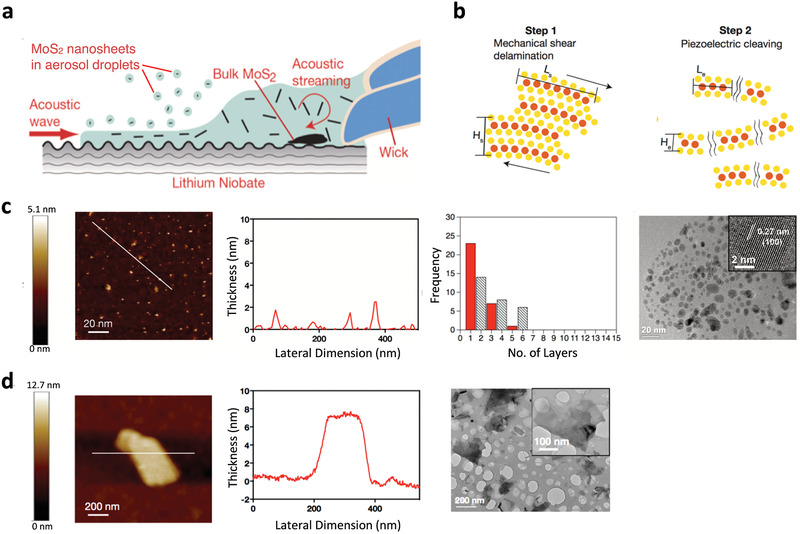
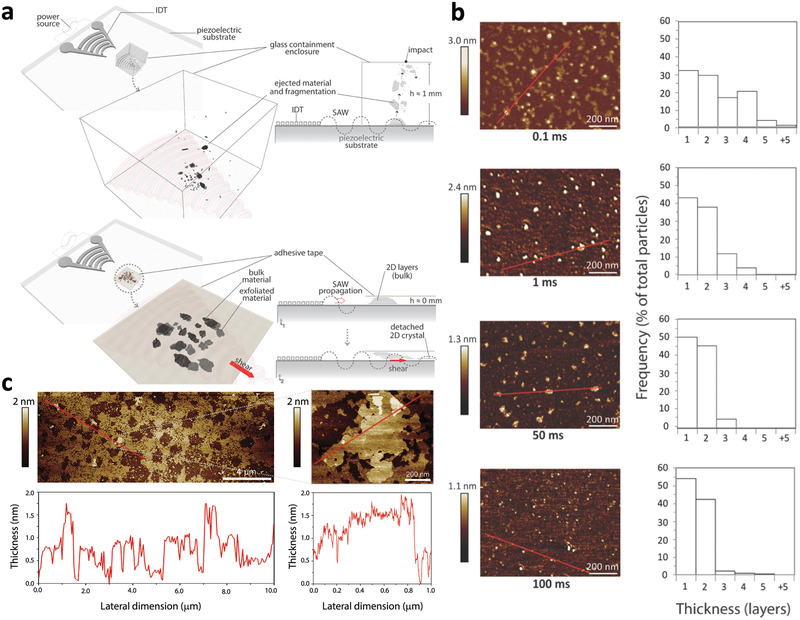
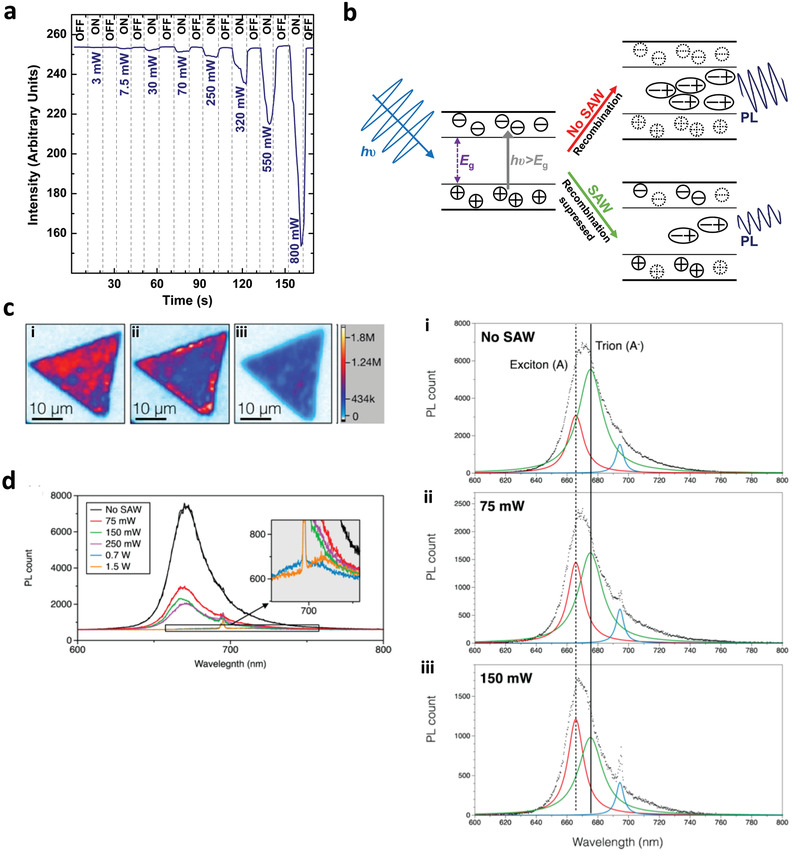
Ultrasound constitutes a powerful means for materials processing. Similarly, a new field has emerged demonstrating the possibility for harnessing sound energy sources at considerably higher frequencies (10 MHz to 1 GHz) compared to conventional ultrasound (⩽3 MHz) for synthesizing and manipulating a variety of bulk, nanoscale, and biological materials. At these frequencies and the typical acoustic intensities employed, cavitation-which underpins most sonochemical or, more broadly, ultrasound-mediated processes-is largely absent, suggesting that altogether fundamentally different mechanisms are at play. Examples include the crystallization of novel morphologies or highly oriented structures; exfoliation of 2D quantum dots and nanosheets; polymer nanoparticle synthesis and encapsulation; and the possibility for manipulating the bandgap of 2D semiconducting materials or the lipid structure that makes up the cell membrane, the latter resulting in the ability to enhance intracellular molecular uptake. These fascinating examples reveal how the highly nonlinear electromechanical coupling associated with such high-frequency surface vibration gives rise to a variety of static and dynamic charge generation and transfer effects, in addition to molecular ordering, polarization, and assembly-remarkably, given the vast dimensional separation between the acoustic wavelength and characteristic molecular length scales, or between the MHz-order excitation frequencies and typical THz-order molecular vibration frequencies.

Keywords: crystallization; molecular self‐assembly; nanomaterials; polymers; sonochemistry; surface acoustic waves.


Conflict of interest statement

The authors declare no conflict of interest.

Figures

Figure 1
Figure 1
Schematic illustration of the transient acoustic cavitation process. Reproduced with permission.[ 17 ] Copyright 2013, Royal Society of Chemistry.
Figure 2
Figure 2
Bulk, surface and hybrid acoustic waves. Dispersion curves (top) and finite element simulations (bottom) showing the distinction between (I) a bulk (e.g., Lamb) wave, obtained for h/λ < 1; (II) a hybrid wave (i.e, a surface reflected bulk wave; SRBW), obtained for h/λ ≈ 1; and, (III) a Rayleigh surface wave (e.g., a surface acoustic wave; SAW), obtained for h/λ > 1. Here, the fundamental symmetric and asymmetric wave modes, denoted by S 0 and A 0, respectively, can be seen to asymptotically approach the SAW phase velocity c SAW with decreasing wavelength λ (or increasing frequency) compared to the piezoelectric (in this case, lithium niobate (LiNbO3)) substrate thickness h. In the simulations, t denotes time. Reproduced with permission.[ 40 ] Copyright 2016, Wiley‐VCH.
Figure 3
Figure 3
Snapshot of the novel nonlinear multiscale phenomena and potential applications arising from fluid– and material–structure interactions associated with the coupling of phonon energy from MHz‐order acoustic forcing into either fluids or bulk/2D crystalline and biological materials. The highlighted text in red indicates the many different length scales over which the coupling remarkably occurs. While various hypotheses have been discussed, a definitive and unifying framework for the underlying physicochemical mechanism responsible for the coupling is still an open scientific question (Novel phenomena: Reproduced with permission.[ 161 ] Copyright 2018, Royal Society of Chemistry. Real world interfaces: Reproduced with permission.[ 200 ] Copyright 2014, American Chemical Society. Cells: Reproduced with permission.[ 148 ] Copyright 2016, American Chemical Society. Tissues: Reproduced with permission.[ 146 ] Copyright 2018, Royal Society of Chemistry. Oriented structures: Reproduced under a CC‐BY 4.0 license.[ 115 ] Published by Springer Nature. Deposition; Exfoliation: Reproduced with permission.[ 123 ] Copyright 2018, Wiley‐VCH. Manipulation: Reproduced with permission.[ 131 ] Copyright 2016, American Chemical Society).
Figure 4
Figure 4
Patterning of protein crystals in a capillary tube along nodal positions of a standing SAW. a) The top pair of images show schematic illustrations of the experimental setup in which a standing SAW—generated by applying an AC electrical signal at resonance to interdigitated transducer (IDT) electrodes on the piezoelectric LiNbO3 substrate—is transmitted through a couplant into a square capillary (see inset image) to set up a standing bulk wave within it. The bottom pair of images show the aggregation of protein crystals in an originally dispersed suspension within the capillary onto lines associated with the pressure nodes, which are separated by half sound wavelengths λ/2, upon application of the SAW. b) Instead of linear protein crystal aggregates, it is also possible to form a 2D array of protein crystal aggregate spots (bottom right image) precisely atop the nodes associated with the standing SAW pattern on the device (bottom left image) through the addition of a transverse IDT pair (top image). The scale bars denote length scales of 100 µm. Reproduced with permission.[ 178 ] Copyright 2015, Wiley‐VCH.
Figure 5
Figure 5
Manipulation of polymer‐dispersed liquid crystals under SAW excitation. The left panel shows a schematic depiction of the experimental setup in which a travelling SAW, generated on the piezoelectric substrate by applying an AC electrical signal at the resonant frequency of the interdigitated transducer (IDT) electrodes, is transmitted into a film consisting of a cured polymer‐dispersed liquid crystal (PDLC) matrix that is placed atop the substrate. The right panel illustrates the effect of 34 dBm power of SAW on the liquid crystal morphology, a) initially, prior to the SAW excitation, and after b) 20 s, c) 40 s, d) 60 s, e) 80 s, and f) 100 s. Reproduced with permission.[ 104 ] Copyright 2011, Wiley‐VCH.
Figure 6
Figure 6
SAW microcentrifugation flow. a) Azimuthal rotational streaming flow in a sessile drop atop the piezoelectric substrate can be generated by breaking the symmetry of the SAW irradiation into the drop, either by i) offsetting the position of the drop such that only part of it lies along the SAW irradiation pathway, ii) making an asymmetric cut to the substrate such that the reflection of the SAW is laterally nonuniform with respect to the drop, or iii) absorbing part of the SAW such that it is prevented from being reflected back into the drop. b) Top view images showing chaotic mixing in the drop (or chamber; ≈1 mm in diameter) driven by the SAW microcentrifugation flow; the image sequence shows the effect of increasing the SAW power with the first image being the control (i.e., no SAW excitation). c) Rapid concentration of 500 nm fluorescent particles in the drop driven by the SAW microcentrifugation flow. d) Formation of 3D cell spheroids by SAW‐driven cell aggregation (bottom row) compared to the 2D monolayers that form in the absence of the SAW microcentrifugation flow (top row) (first column: 4′,6‐diamidino‐2‐phenylindole (DAPI) nuclear staining, second column: vinculin focal contact staining, third column: phalloidin F‐actin staining, fourth column: overlay; the scale bar denotes 100 µm lengths). a) Reproduced with permission.[ 105 ] Copyright 2007, Springer Science + Business Media LLC. b) Reproduced with permission.[ 200 ] Copyright 2014, American Chemical Society. c) Reproduced with permission.[ 106 ] Copyright 2008, American Institute of Physics. d) Reproduced with permission.[ 148 ] Copyright 2016, American Chemical Society.
Figure 7
Figure 7
SAW microcentrifugation synthesis of MOFs. The top shows the experimental setup in which two opposing asymmetric SAWs, generated by offset interdigitated transducers at each end, drive an azimuthal microcentrifugation flow within a sessile drop consisting of the MOF precursor solution comprising 1,3,5‐benzenetricarboxylic acid (BTC; C6H3(CO2H)3) and copper(II) nitrate hemi(pentahydrate) (Cu(NO3)2 · 2.5 H2O). As illustrated in the inset, the MOF powder that crystallizes on the substrate after 5 min of SAW excitation appears to possess out‐of‐plane (in the direction transverse to the substrate) orientation. This is evident in the experimental results below, which show that the crystals not only progressively decrease in size from i) the atomic force microscopy (AFM) images and ii) the particle size distributions, but are also increasingly oriented from iii) the x‐ray diffraction (XRD) spectra as the input voltage and hence the SAW power is increased from a) 0 V (i.e., control experiment without SAW excitation), b) 1.5 V, c) 4.5 V, d) 7.5 V, and e) 9 V. Scale bars denote a length scale of 50 µm. Also shown in the XRD results are the Pawley fits (calc) to the experimental (obs) data, as well as the difference between them (diff). Adapted with permission under a CC‐BY 4.0 license.[ 115 ] Published by Springer Nature.
Figure 8
Figure 8
Novel crystal morphologies obtained via SAW/SRBW nebulization of a) salt and b) glycine solutions. The left columns in both panels show the crystals obtained under slow solvent evaporation whereas the middle and right columns show that obtained under the SAW/SRBW nebulization. The right column depicts the polymer‐coated crystals obtained when the solution that is nebulized additionally contains a fluorescent polymer. The results for the salt crystals are shown for surfactant solutions with different hydrophilic‐lipophilic balances (HLB) of the surfactant mixture (Span 60 and Tween 20) and those for glycine are shown for increasing sodium chloride (NaCl) concentration. Reproduced with permission.[ 116 ] Copyright 2017, Wiley‐VCH.
Figure 9
Figure 9
Synthesis of large aspect ratio MOF crystals with exposed active metal sites from thin nebulizing acoustowetting films. a) Experimental setup in which the MOF precursor solution comprising 1,3,5‐benzenetricarboxylic acid (BTC; C6H3(CO2H)3) and copper(II) nitrate hemi(pentahydrate) (Cu(NO3)2 · 2.5 H2O) is dispensed using a dual syringe pump onto the substrate, which then spreads under the SRBW into a thin film that concurrently nebulizes. The Cu–BTC MOF crystals that precipitate out in the thin liquid film possess b) a 1D sword‐like morphology and unique P21/n monoclinic structure compared to c) the regular Fm3m cubic HKUST‐1 crystals that are usually obtained through the conventional bulk solvothermal technique (i.e., the control experiment in the absence of the SRBW forcing). Moreover, the thicknesses of the sword‐like crystals correspond to the liquid film thickness (as illustrated by the red circles), which, in turn, correlates strongly with d) the pulse duration (50% duty cycle) associated with the modulation of the acoustic excitation signal: i) continuous excitation (i.e., infinitesimally small pulse duration), ii) 0.1 ms, iii) 100 ms, iv) 400 ms. The scale bars in the monographs in the left column correspond to a length of 500 µm, whereas those in the atomic force microsopy (AFM) images in the insets of the right column correspond to a length of 1 µm. Reproduced with permission.[ 118 ] Copyright 2020, Royal Society of Chemistry.
Figure 10
Figure 10
Exfoliation of 2D TMD nanosheets. a) Experimental setup showing the SAW or SRBW drawing a liquid suspension of bulk MoS2 powder through a wick onto the device where it forms a meniscus prior to being nebulized into micron‐dimension aerosol droplets containing the exfoliated MoS2, which are then collected for subsequent characterization. b) Two‐step mechanism by which the exfoliation is hypothesized to occur. The first step involves the mechanical delamination of the large powders into intermediate sheets with 100 nm order lateral dimensions Ls and 10 nm thicknesses Hs due to the large shear stress (on the order 104 s−1) associated with the acoustic streaming within the liquid meniscus. The second step, which only arises if the material is piezoelectric (e.g., nanosheets with odd numbers of layers), involves the cleaving of the aforementioned intermediate sheets into thinner structures of 10 nm order lateral dimension L e and 1 nm order thickness H e (single‐ or few‐layers) due to the strong mechanical vibration acting at the end planes of sheets that is enhanced by the inherent electric field associated with electromechanical coupling of the acoustic waves in the nanosheets. c) Left to right: AFM image, lateral size distribution, frequency distribution (as a function of the number of layers), and transmission electron microscope image of the exfoliated MoS2 (piezoelectric when present in odd numbers of layers) nanosheets. d) Left to right: AFM image, lateral size distribution, and frequency distribution (as a function of the number of layers) of the exfoliated graphite (non‐piezoelectric) sheets. Reproduced with permission.[ 123 ] Copyright 2018, Wiley‐VCH.
Figure 11
Figure 11
Dry exfoliation of TMD QDs and large flakes. a) Experimental setup: The top configuration, which facilitates the production of QDs, involves housing the bulk MoS2 powder feedstock in a chamber placed atop the SAW or SRBW device, whereas the bottom configuration, which facilitates the production of large micron‐dimension nanosheets, involves confining the feedstock under adhesive tape. b) Top to bottom: AFM images, lateral size distributions, and frequency distribution as a function of the number of layers of the QDs produced with the first configuration; successive rows correspond to results for different SAW or SRBW excitation times of 0.1, 1, 50, and 100 ms. c) AFM images of the large micron‐dimension flakes with high surface coverage, produced using the setup associated with the second configuration. Reproduced with permission.[ 126 ] Copyright 2019, Royal Society of Chemistry.
Figure 12
Figure 12
SAW or SRBW bandgap modulation in TMD nanosheets. a) Reversible PL modulation of a quasi‐2D MoS2 nanosheet under SAW or SRBW excitation. b) Mechanism by which electron recombination is suppressed by the SAW or SRBW. c) Images showing the PL response on a pristine monolayer MoS2 nanosheet, and d) corresponding PL spectra i) in the absence of SAW or SRBW excitation and in the presence of SAW or SRBW excitation at ii) low power (75 mW) and iii) high power (150 mW), respectively. a) Reproduced with permission.[ 130 ] Copyright 2015, Wiley‐VCH. b,c,d) Reproduced with permission.[ 131 ] Copyright 2016, American Chemical Society.
Figure 13
Figure 13
Particle synthesis via SAW or SRBW nebulization. The top row reports particle size distributions that confirm production of a) 100 nm order polymer nanoparticles comprising a cluster of sub‐50‐nm aggregates (see insets), and b) crumpled GO nanoparticles and microparticles, simply by nebulizing solutions comprising the polymer or GO suspension, respectively. Also shown in (c) is evidence through confocal microscopy sectioning of the possibility of simultaneously encapsulating, in this case, a fluorescent protein, within the polymer particles. d) The bottom row shows a schematic of the experimental setup (left) for the synthesis of multilayer polymer nanocapsules by nebulizing a polymer solution (in this case, chitosan), collecting the dried particles in a complementary polymer solution of opposite charge (in this case, carboxymethylcellulose [CMC]),and renebulizing over many cycles (one cycle per layer); each layer as well as the plasmid DNA (pDNA) encapsulated within them was verified from the alternating‐zeta potentials measured after the formation of each layer (right). a,b) Reproduced with permission.[ 151 ] Copyright 2008, IOP Publishing Ltd; c) Reproduced with permission.[ 153 ] Copyright 2009, American Institute of Physics; d) Reproduced with permission.[ 155 ] Copyright 2011, American Chemical Society.
Figure 14
Figure 14
SAW/SRBW surface patterning. i) Schematic depiction and ii) snapshot of the nebulization of a polymer solution from a trailing film of a translating drop (from left to right in the image) dispensed from a needle onto the piezoelectric substrate (both of which occur due to the travelling wave component of the acoustic wave) to leave behind polymer spots on the substrate that are arranged in a regular 2D hexagonal closed pattern (iii, iv), whose v) dimension as well as lateral spacing a and b highly correlates with the wavelength of the SAW/SRBW, as set by the IDT spacing d, and hence frequency. Reproduced with permission.[ 158 ] Copyright 2008, American Chemical Society.
Figure 15
Figure 15
Dispensing and patterning enabled by SAW or SRBW jetting. a) As illustrated by the schematic (top) and sequence of images (bottom), the jetting of a parent drop can be employed for the ejection and hence dispensing of drops (see inset), or if impeded by a top cover plate, the formation of a capillary bridge, whose spreading onto the top plate (depicted by the horizontal arrows), and subsequent retraction and pinch‐off (dotted circle) leaves behind a spot on the top plate whose volume V d is closely related to the parent drop volume V p. b) The angle of the jet θ can be controlled by an asymmetric imbalance of the input power to both IDTs; the jet is vertical (θ = 0) when equal power is delivered to both IDTs, or biased toward the IDT with the lower power (top). By repeatedly pulsing the signal and altering the relative power to both IDTs sequentially, it is then possible to jet and hence dispense drops at different locations on the top plate to create a regular array pattern (bottom left and right). Reproduced with permission.[ 162 ] Copyright 2019, American Chemical Society.

References

    1. Suslick K. S., Science 1990, 247, 1439. - PubMed
    1. Thompson L. H., Doraiswamy L. K., Ind. Eng. Chem. Res. 1999, 38, 1215.
    1. Margulis M. A., Margulis I. M., Ultrason. Sonochem. 2002, 9, 1. - PubMed
    1. Suslick K. S., Flannigan D. J., Annu. Rev. Phys. Chem. 2008, 59, 659. - PubMed
    1. Wood R. J., Lee J., Bussemaker M. J., Ultrason. Sonochem. 2017, 38, 351. - PubMed

LinkOut - more resources