

An impaired healing model of osteochondral defect in papain-induced arthritis
- PMID: 33437629
- PMCID: PMC7773975
- DOI: 10.1016/j.jot.2020.07.005
An impaired healing model of osteochondral defect in papain-induced arthritis
Abstract
Background: Osteochondral defects (OCD) are common in osteoarthritis (OA) and difficult to heal. Numerous tissue engineering approaches and novel biomaterials are developed to solve this challenging condition. Although most of the novel methods can successfully treat osteochondral defects in preclinical trials, their clinical application in OA patients is not satisfactory, due to a high spontaneous recovery rate of many preclinical animal models by ignoring the inflammatory environment. In this study, we developed a sustained osteochondral defect model in osteoarthritic rabbits and compared the cartilage and subchondral bone regeneration in normal and arthritic environments.
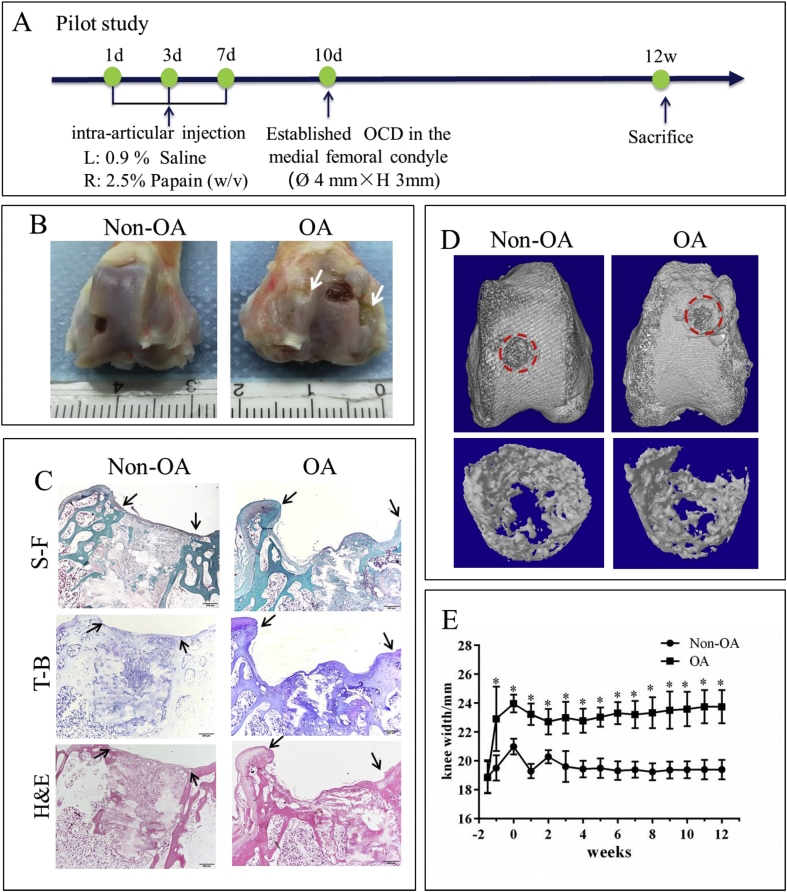
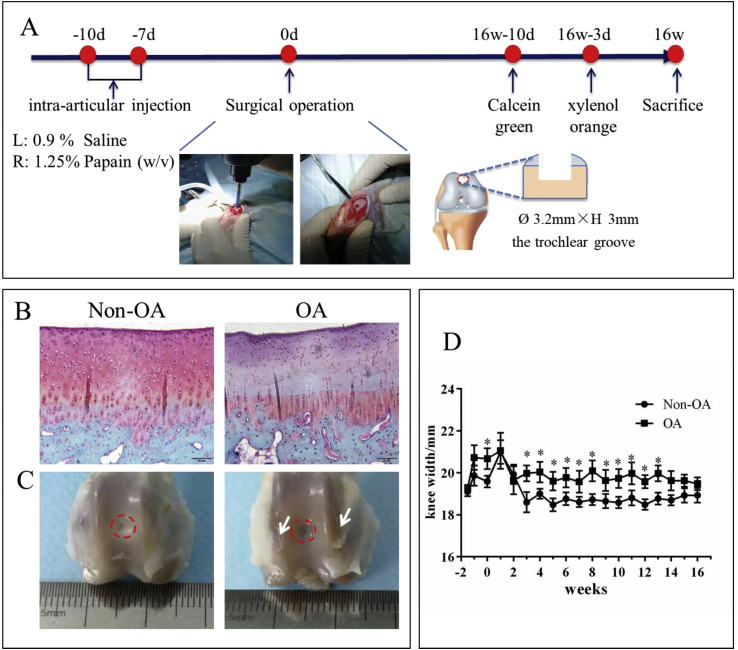
Methods: Rabbits were injected with papain (1.25%) in the right knee joints (OA group), and saline in the left knee joints (Non-OA group) at day 1 and day 3. One week later a cylindrical osteochondral defect of 3.2 mm in diameter and 3 mm depth was made in the femoral patellar groove. After 16 weeks, newly regenerated cartilage and bone inside the defect were evaluated by micro-CT, histomorphology and immunohistochemistry.
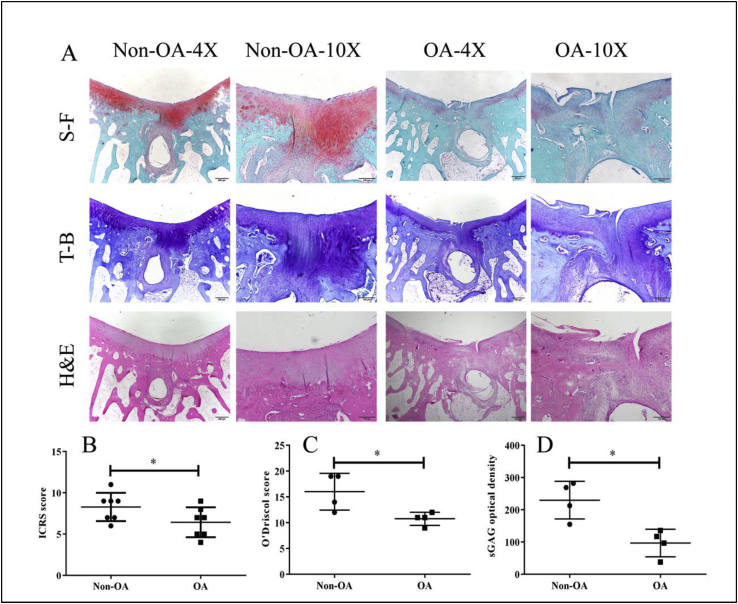
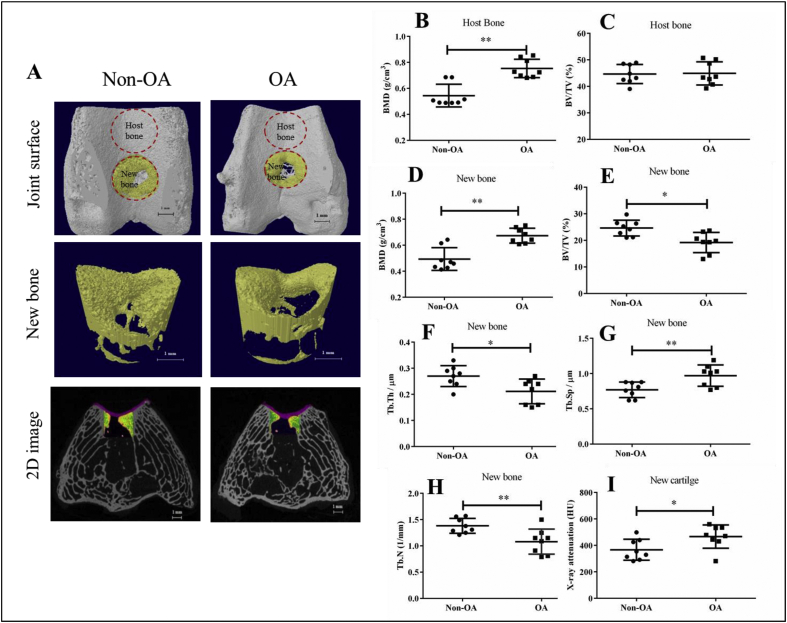
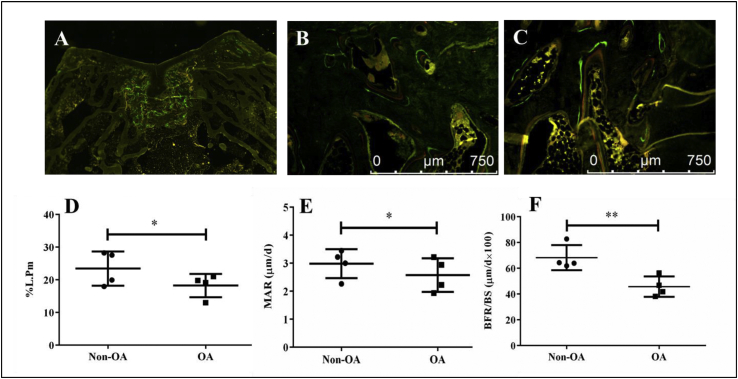
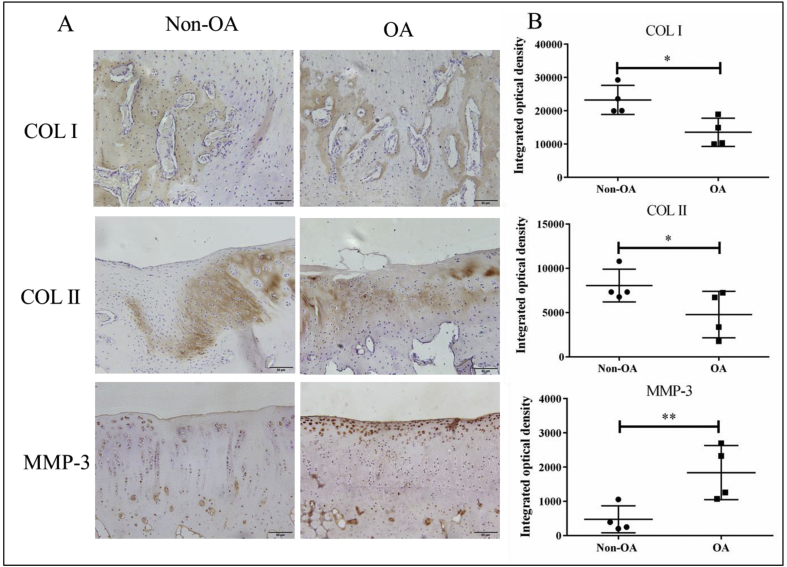
Results: One week after papain injection, extracellular matrix in the OA group demonstrated dramatically less safranin O staining intensity than in the non-OA group. Until 13 weeks of post-surgery, knee width remained significantly higher in the OA group than the non-OA control group. Sixteen weeks after surgery, the OA group had 11.3% lower International Cartilage Regeneration and Joint Preservation Society score and 32.5% lower O'Driscoll score than the non-OA group. There were less sulfated glycosaminoglycan and type II collagen but 74.1% more MMP-3 protein in the regenerated cartilage of the OA group compared with the non-OA group. As to the regenerated bone, bone volume fraction, trabecular thickness and trabecular number were all about 28% lower, while the bone mineral density was 26.7% higher in the OA group compared to the non-OA group. Dynamic histomorphometry parameters including percent labeled perimeter, mineral apposition rate and bone formation rate were lower in the OA group than in the non-OA group. Immunohistochemistry data showed that the OA group had 15.9% less type I collagen than the non-OA group.
Conclusion: The present study successfully established a non-self-healing osteochondral defect rabbit model in papain-induced OA, which was well simulating the clinical feature and pathology. In addition, we confirmed that both cartilage and subchondral bone regeneration were further impaired in arthritic environment.
The translational potential of this article: The present study provides an osteochondral defect in a small osteoarthritic model. This non-self-healing model and the evaluation protocol could be used to evaluate the efficacy and study the mechanism of newly developed biomaterials or tissue engineering methods preclinically; as methods tested in reliable preclinical models are expected to achieve improved success rate when tested clinically for treatment of OCD in OA patients.
Keywords: Impaired healing; Osteochondral defect; Papain-induced osteoarthritis.
© 2020 The Author(s).
Conflict of interest statement
The authors have no conflicts of interest to disclose in relation to this article.
Figures
Similar articles
-
Treatment of osteochondral defects in the rabbit's knee joint by implantation of allogeneic mesenchymal stem cells in fibrin clots.J Vis Exp. 2013 May 21;(75):e4423. doi: 10.3791/4423. J Vis Exp. 2013. PMID: 23728213 Free PMC article.
-
Histomorphological Investigation of Microfracture Location in a Rabbit Osteochondral Defect Model.Am J Sports Med. 2023 Sep;51(11):3025-3034. doi: 10.1177/03635465231188446. Epub 2023 Aug 18. Am J Sports Med. 2023. PMID: 37594006
-
[In vitro effect of alendronate on chondrocytes and articular cartilage and subchondral bone in rabbit anterior cruciate ligament transection model].Zhongguo Xiu Fu Chong Jian Wai Ke Za Zhi. 2009 Dec;23(12):1474-81. Zhongguo Xiu Fu Chong Jian Wai Ke Za Zhi. 2009. PMID: 20073314 Chinese.
-
Autologous tissue transplantations for osteochondral repair.Dan Med J. 2016 Apr;63(4):B5236. Dan Med J. 2016. PMID: 27034191 Review.
-
Osteochondral tissue repair in osteoarthritic joints: clinical challenges and opportunities in tissue engineering.Biodes Manuf. 2018;1(2):101-114. doi: 10.1007/s42242-018-0015-0. Epub 2018 May 28. Biodes Manuf. 2018. PMID: 30533248 Free PMC article. Review.
Cited by
-
Impacts of Delivery Mode and Maternal Factors on Neonatal Oral Microbiota.Front Microbiol. 2022 Jun 27;13:915423. doi: 10.3389/fmicb.2022.915423. eCollection 2022. Front Microbiol. 2022. PMID: 35832807 Free PMC article.
-
A new attempt to build damaged cartilage.J Orthop Translat. 2022 Mar 22;32:131. doi: 10.1016/j.jot.2022.02.010. eCollection 2022 Jan. J Orthop Translat. 2022. PMID: 35591932 Free PMC article. No abstract available.
-
Osteochondral Regeneration Ability of Uncultured Bone Marrow Mononuclear Cells and Platelet-Rich Fibrin Scaffold.Bioengineering (Basel). 2023 May 31;10(6):661. doi: 10.3390/bioengineering10060661. Bioengineering (Basel). 2023. PMID: 37370592 Free PMC article.
-
Seamless and early gap healing of osteochondral defects by autologous mosaicplasty combined with bioactive supramolecular nanofiber-enabled gelatin methacryloyl (BSN-GelMA) hydrogel.Bioact Mater. 2022 Apr 5;19:88-102. doi: 10.1016/j.bioactmat.2022.03.038. eCollection 2023 Jan. Bioact Mater. 2022. PMID: 35441114 Free PMC article.
-
Anti-hypertrophic effect of synovium-derived stromal cells on costal chondrocytes promotes cartilage repairs.J Orthop Translat. 2021 Jun 2;32:59-68. doi: 10.1016/j.jot.2021.05.002. eCollection 2022 Jan. J Orthop Translat. 2021. PMID: 34934627 Free PMC article.
References
-
- Iijima H., Shimoura K., Aoyama T., Takahashi M. Biomechanical characteristics of stair ambulation in patients with knee OA: a systematic review with meta-analysis toward a better definition of clinical hallmarks. Gait Posture. 2018;62:191–201. - PubMed
-
- Re’em T., Witte F., Willbold E., Ruvinov E., Cohen S. Simultaneous regeneration of articular cartilage and subchondral bone induced by spatially presented TGF-beta and BMP-4 in a bilayer affinity binding system. Acta Biomater. 2012;8(9):3283–3293. - PubMed
LinkOut - more resources
Full Text Sources
Other Literature Sources
Research Materials
Miscellaneous
