

Lingzhi and San-Miao-San with hyaluronic acid gel mitigate cartilage degeneration in anterior cruciate ligament transection induced osteoarthritis
- PMID: 33437632
- PMCID: PMC7773973
- DOI: 10.1016/j.jot.2020.07.008
Lingzhi and San-Miao-San with hyaluronic acid gel mitigate cartilage degeneration in anterior cruciate ligament transection induced osteoarthritis
Abstract
Objective: To investigate the mitigate efficacy of Chinese medicine Lingzhi (LZ) and San-Miao-San (SMS) combined with hyaluronic acid (HA)-gel in attenuating cartilage degeneration in traumatic osteoarthritis (OA).
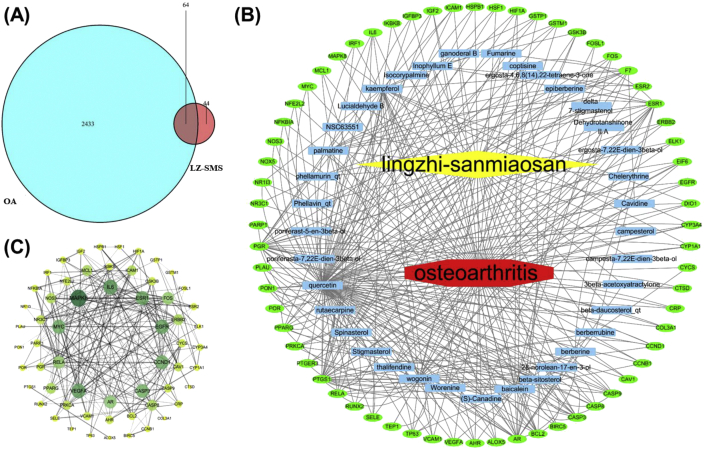
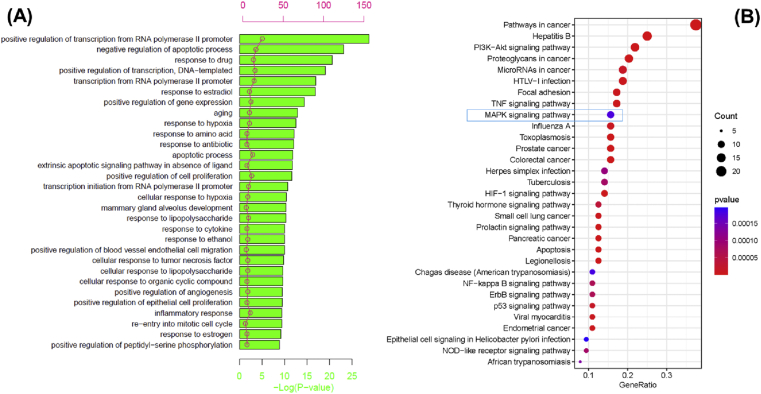
Methods: The standardized surgery of anterior cruciate ligament transection (ACLT) was made from the medial compartment of right hind limbs of 8-week-old female SD rats and resulted in a traumatic OA. Rats (n = 5/group) were treated once intra-articular injection of 50 μl HA-gel, 50 μl HA-gel+50 μg LZ-SMS, 50 μl of saline+50 μg LZ-SMS and null (ACLT group) respectively, except sham group. Limbs were harvested for μCT scan and histopathological staining 3-month post-treatment. Inflammatory cytokines from plasma and synovial fluid were detected using Immunology Multiplex Assay kit. The putative targets of active compounds in LZ-SMS and known therapeutic targets for OA were combined to construct protein-protein interaction network. Gene Ontology and Kyoto Encyclopedia of Genes and Genomes (KEGG) enrichment analysis was adopted to predict the potential targets and signaling pathway of LZ-SMS in OA through the tool of DAVID Bioinformatics.
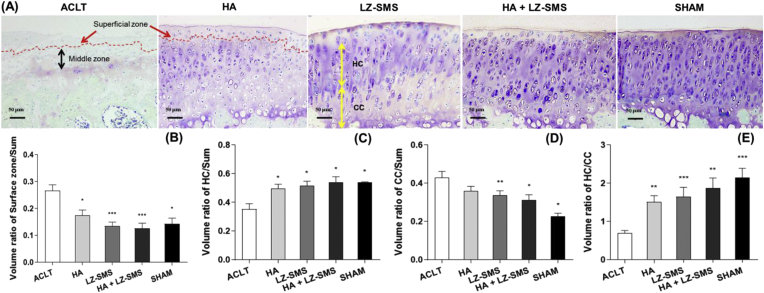
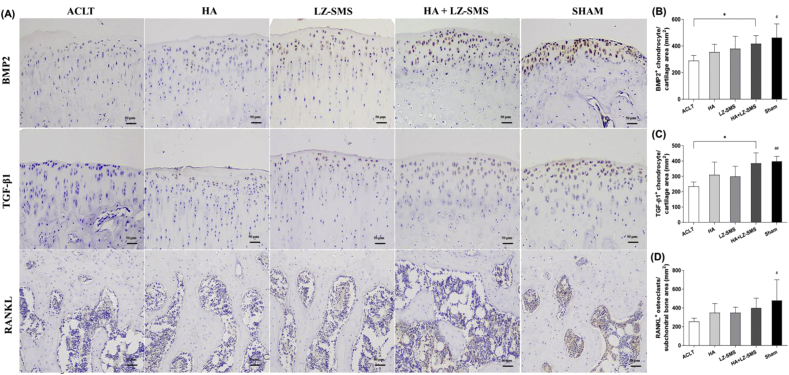
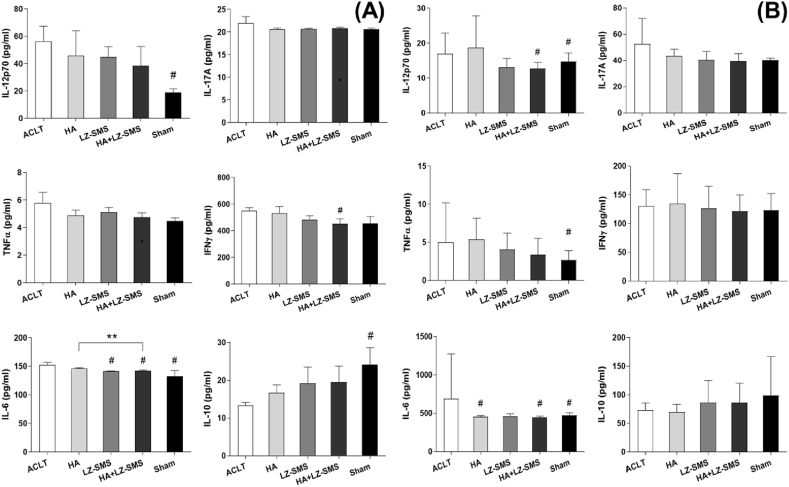
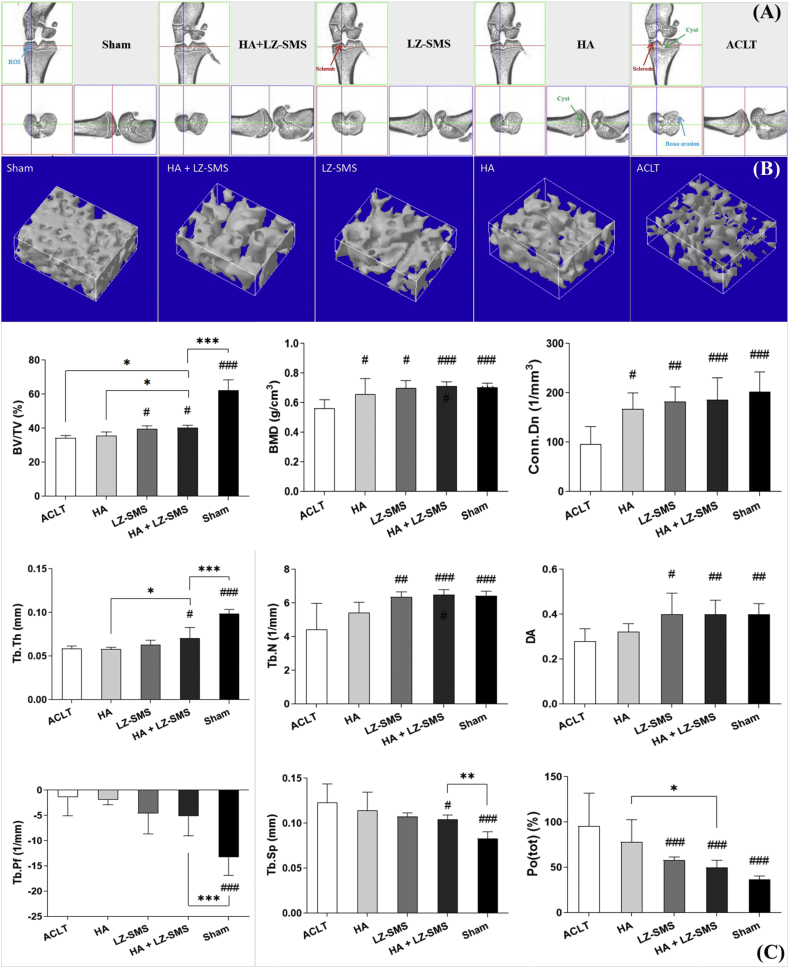
Results: In vivo, HA-gel + LZ-SMS treatment resulted in a higher volume ratio of hyaline cartilage (HC)/calcified cartilage (CC) and HC/Sum (total volume of cartilage), compared to ACLT and HA-gel groups. In addition, histological results showed the elevated cartilage matrix, chondrogenic and osteoblastic signals in HA-gel + LZ-SMS treatment. Treatment also significantly altered subchondral bone (SCB) structure including an increase in BV/TV, Tb.Th, BMD, Conn.Dn, Tb.N, and DA, as well as a significant decrease in Tb.Sp and Po(tot), which implied a protective effect on maintaining the stabilization of tibial SCB microstructure. Furthermore, there was also a down-regulated inflammatory cytokines and upregulated anti-inflammatory cytokine IL-10 in HA+LZ-SMS group. Finally, 64 shared targets from 37 active compounds in LZ-SMS related to the core genes for the development of OA. LZ-SMS has a putative role in regulating inflammatory circumstance through influencing the MAPK signaling pathway.
Conclusion: Our study elucidated a protective effect of HA-gel + LZ-SMS in mitigating cartilage degradation and putative interaction with targets and signaling pathway for the development of traumatic OA.
The translational potential of this article: Our results provide a biological rationale for the use of LZ-SMS as a potential candidate for OA treatment.
Keywords: 3D, Three-dimensional; AC, Articular cartilage; ACLT, Anterior cruciate ligament transection; Acan, Aggrecan; Articular cartilage; BMD, Bone mineral density; BV/TV, Bone volume fraction; CC, Calcified cartilage; Conn.Dn, Connectivity density; DA, Degree of anisotropy; DL, Drug-likeness; ECM, Extracellular matrix; FDR, False discovery rate; GO, Gene ontology; HA, Hyaluronic acid; HC, Hyaline cartilage; Hyaluronic acid gel; KEGG, Kyoto Encyclopedia of Genes and Genomes; LZ-SMS, Lingzhi-San-Miao-San; Lingzhi and San-Miao-San; MZ, Middle zone area of articular cartilage; NC, Negative control; OA, Osteoarthritis; OB, Oral bioavailability; OMIM, Online Mendelian Inheritance in Man; Osteoarthritis; PPI, Protein–protein interaction; Po(tot), Total porosity; ROI, Region of Interest; SC, Superficial cartilage; SCB, Subchondral bone; SZ, Superficial zone of articular cartilage; Subchondral trabecular bone; Sum, Whole cartilage; TCM, Traditional Chinese medicine; TCMSP, Traditional Chinese Medicine Systems Pharmacology Database; Tb.N, Trabecular number; Tb.Pf, Trabecular bone pattern factor; Tb.Sp, Trabecular separation; Tb.Th, Trabecular thickness.
© 2020 The Author(s).
Conflict of interest statement
The authors have no conflicts of interest to disclose in relation to this article.
Figures
Similar articles
-
Prevent action of magnoflorine with hyaluronic acid gel from cartilage degeneration in anterior cruciate ligament transection induced osteoarthritis.Biomed Pharmacother. 2020 Jun;126:109733. doi: 10.1016/j.biopha.2019.109733. Epub 2020 Feb 27. Biomed Pharmacother. 2020. PMID: 32113051
-
Magnoflorine with hyaluronic acid gel promotes subchondral bone regeneration and attenuates cartilage degeneration in early osteoarthritis.Bone. 2018 Nov;116:266-278. doi: 10.1016/j.bone.2018.08.015. Epub 2018 Aug 24. Bone. 2018. PMID: 30149068
-
Teriparatide ameliorates articular cartilage degradation and aberrant subchondral bone remodeling in DMM mice.J Orthop Translat. 2022 Dec 7;38:241-255. doi: 10.1016/j.jot.2022.10.015. eCollection 2023 Jan. J Orthop Translat. 2022. PMID: 36514714 Free PMC article.
-
Hemodynamic stress shapes subchondral bone in osteoarthritis: An emerging hypothesis.J Orthop Translat. 2021 Dec 30;32:85-90. doi: 10.1016/j.jot.2021.11.007. eCollection 2022 Jan. J Orthop Translat. 2021. PMID: 35070712 Free PMC article. Review.
-
Engineering Hyaluronic Acid for the Development of New Treatment Strategies for Osteoarthritis.Int J Mol Sci. 2022 Aug 4;23(15):8662. doi: 10.3390/ijms23158662. Int J Mol Sci. 2022. PMID: 35955795 Free PMC article. Review.
Cited by
-
How Do Cartilage Lubrication Mechanisms Fail in Osteoarthritis? A Comprehensive Review.Bioengineering (Basel). 2024 May 24;11(6):541. doi: 10.3390/bioengineering11060541. Bioengineering (Basel). 2024. PMID: 38927777 Free PMC article. Review.
-
Coix seed oil alleviates synovial angiogenesis through suppressing HIF-1α/VEGF-A signaling pathways via SIRT1 in collagen-induced arthritis rats.Chin Med. 2023 Sep 15;18(1):119. doi: 10.1186/s13020-023-00833-6. Chin Med. 2023. PMID: 37715217 Free PMC article.
-
[Refixation of a posterior medial root lesion in combination with centralization by a meniscotibial suture].Oper Orthop Traumatol. 2025 Jun;37(3-4):254-265. doi: 10.1007/s00064-024-00858-6. Epub 2024 Aug 22. Oper Orthop Traumatol. 2025. PMID: 39172276 German.
-
Adhesive hydrogels in osteoarthritis: from design to application.Mil Med Res. 2023 Jan 30;10(1):4. doi: 10.1186/s40779-022-00439-3. Mil Med Res. 2023. PMID: 36710340 Free PMC article. Review.
-
Elucidation of Potential Targets of San-Miao-San in the Treatment of Osteoarthritis Based on Network Pharmacology and Molecular Docking Analysis.Evid Based Complement Alternat Med. 2022 Jan 18;2022:7663212. doi: 10.1155/2022/7663212. eCollection 2022. Evid Based Complement Alternat Med. 2022. PMID: 35087596 Free PMC article.
References
-
- Hayami T., Pickarski M., Zhuo Y., Wesolowski G.A., RodanLe G.A., Duong L.T. Characterization of articular cartilage and subchondral bone changes in the rat anterior cruciate ligament transection and meniscectomized models of osteoarthritis. Bone. 2006;38(2):234–243. - PubMed
-
- Feng Y., Cai Z., Cheung W.K., Yang K.D., Xu L., Lu W.W. Multichromatic TTF staining characterizes cartilage matrix in osteoarthritisand bone development. Histol Histopathol. 2019;34(3):275–286. - PubMed
-
- Wang T., Wen C.Y., Yan C.H., Lu W.W., Chiu K.Y. Spatial and temporal changes of subchondral bone proceed to microscopic articular cartilage degeneration in Guinea pigs with spontaneous osteoarthritis. Osteoarthritis Cartilage. 2013;21(4):574–581. - PubMed
LinkOut - more resources
Full Text Sources
Other Literature Sources
Research Materials
Miscellaneous
