

RNA sequencing (RNA-seq) analysis of gene expression provides new insights into hindlimb unloading-induced skeletal muscle atrophy
- PMID: 33437794
- PMCID: PMC7791259
- DOI: 10.21037/atm-20-7400
RNA sequencing (RNA-seq) analysis of gene expression provides new insights into hindlimb unloading-induced skeletal muscle atrophy
Abstract
Background: Weightlessness-induced skeletal muscle atrophy, accompanied by complex biochemical and physiological changes, has potentially damaged consequences. However, there is still an insufficient effective strategy to treat skeletal muscle atrophy. Therefore, exploring the molecular mechanisms regulating skeletal muscle atrophy and effective protection is necessary.
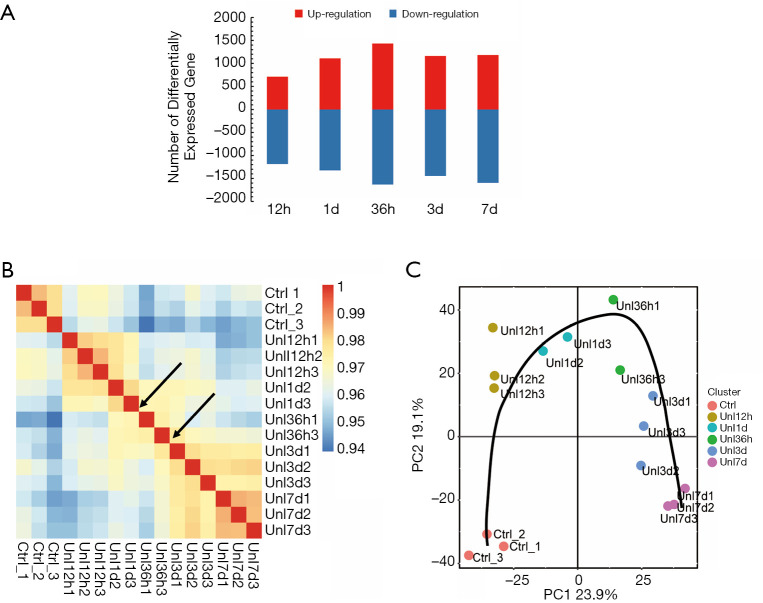
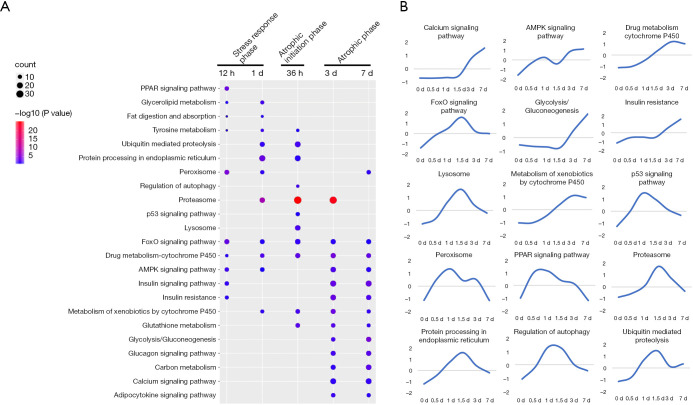
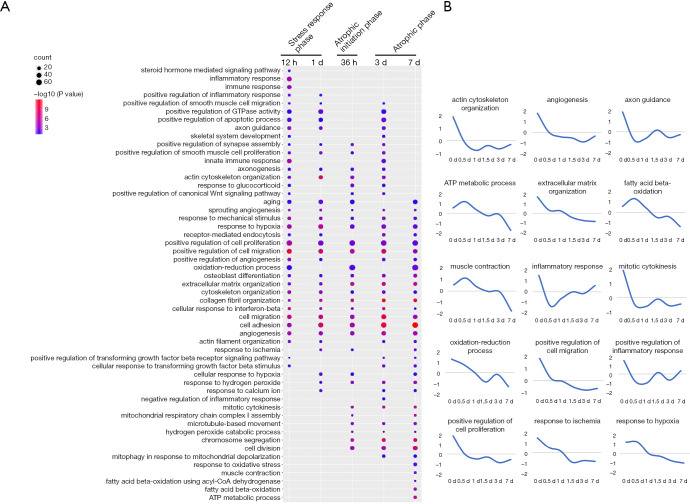
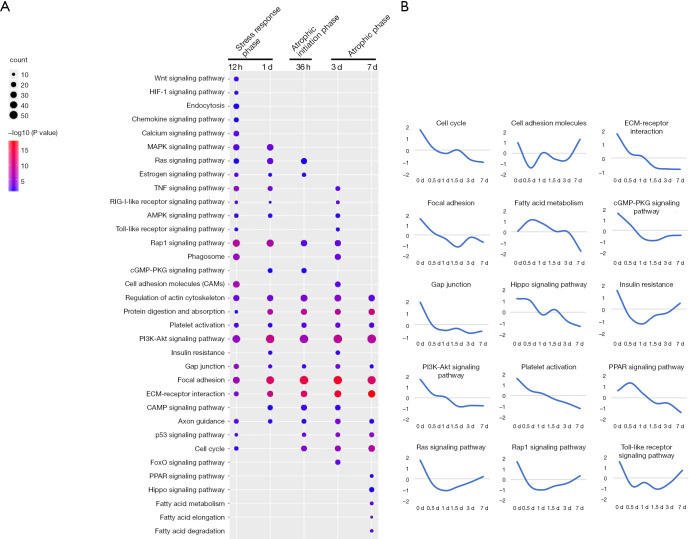
Methods: RNA sequencing (RNA-seq) analysis was used to detect differentially expressed genes (DEGs) in the soleus muscle at 12, 24, 36 hours, three days, and seven days after hindlimb unloading in rats. Pearson correlation heatmaps and principal component analysis (PCA) were applied to analyze DEGs' expression profiles. Gene Ontology (GO) and Kyoto Encyclopedia of Genes and Genomes (KEGG) were used for cluster analysis of DEGs. Ingenuity pathway analysis (IPA) was used to analyze specific biological processes further.
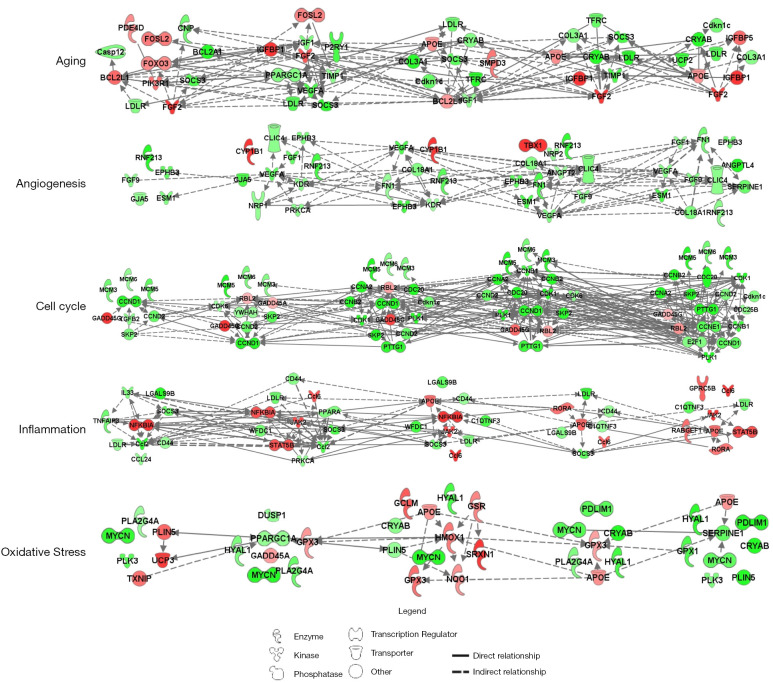
Results: At different time points (12, 24, 36 hours, three days, seven days) after hindlimb unloading, the expression levels of 712, 1,109, 1,433, 1,162, and 1,182 genes in rat soleus muscle were upregulated, respectively, whereas the expression levels of 1,186, 1,324, 1,632, 1,446, and 1,596 genes were downregulated, respectively. PCA revealed that rat soleus muscle showed three different transcriptional phases within seven days after hindlimb unloading. KEGG and GO annotation indicated that the first transcriptional phase primarily involved the activation of stress responses, including oxidative stress, and the inhibition of cell proliferation and angiogenesis; the second transcriptional phase primarily involved the activation of proteolytic systems and, to a certain degree, inflammatory responses; and the third transcriptional phase primarily involved extensive activation of the proteolytic system, significant inhibition of energy metabolism, and activation of the aging process and slow-to-fast muscle conversion.
Conclusions: Different physiological processes in rat skeletal muscles were activated sequentially after unloading. From these activated biological processes, the three transcriptional phases after skeletal muscle unloading can be successively defined as the stress response phase, the atrophic initiation phase, and the atrophic phase. Our study not only helps in the understanding of the molecular mechanisms underlying weightlessness-induced muscle atrophy but may also provide an important time window for the treatment and prevention of weightlessness-induced muscle atrophy.
Keywords: RNA sequencing (RNA-seq); Skeletal muscle atrophy; bioinformatics analysis; gene expression; hindlimb unloading.
2020 Annals of Translational Medicine. All rights reserved.
Conflict of interest statement
Conflicts of Interest: All authors have completed the ICMJE uniform disclosure form (available at http://dx.doi.org/10.21037/atm-20-7400). The authors have no conflicts of interest to declare.
Figures


Similar articles
-
Integrated Proteomic and Metabolomic Analysis of Muscle Atrophy Induced by Hindlimb Unloading.Biomolecules. 2024 Dec 26;15(1):14. doi: 10.3390/biom15010014. Biomolecules. 2024. PMID: 39858409 Free PMC article.
-
Microarray Analysis of Gene Expression Provides New Insights Into Denervation-Induced Skeletal Muscle Atrophy.Front Physiol. 2019 Oct 11;10:1298. doi: 10.3389/fphys.2019.01298. eCollection 2019. Front Physiol. 2019. PMID: 31681010 Free PMC article.
-
Global alternative splicing landscape of skeletal muscle atrophy induced by hindlimb unloading.Ann Transl Med. 2021 Apr;9(8):643. doi: 10.21037/atm-20-5388. Ann Transl Med. 2021. PMID: 33987341 Free PMC article.
-
Calcium-dependent signaling mechanisms and soleus fiber remodeling under gravitational unloading.J Muscle Res Cell Motil. 2008;29(6-8):221-30. doi: 10.1007/s10974-008-9164-7. Epub 2009 Jan 8. J Muscle Res Cell Motil. 2008. PMID: 19130271 Review.
-
Gravitational unloading effects on muscle fiber size, phenotype and myonuclear number.Adv Space Res. 2002;30(4):777-81. doi: 10.1016/s0273-1177(02)00395-2. Adv Space Res. 2002. PMID: 12530363 Review.
Cited by
-
Effect of Microgravity on Endothelial Cell Function, Angiogenesis, and Vessel Remodeling During Wound Healing.Front Bioeng Biotechnol. 2021 Sep 22;9:720091. doi: 10.3389/fbioe.2021.720091. eCollection 2021. Front Bioeng Biotechnol. 2021. PMID: 34631676 Free PMC article. Review.
-
Concurrent BMP Signaling Maintenance and TGF-β Signaling Inhibition Is a Hallmark of Natural Resistance to Muscle Atrophy in the Hibernating Bear.Cells. 2021 Jul 23;10(8):1873. doi: 10.3390/cells10081873. Cells. 2021. PMID: 34440643 Free PMC article.
-
Up- and Downregulated Genes after Long-Term Muscle Atrophy Induced by Denervation in Mice Detected Using RNA-Seq.Life (Basel). 2023 Apr 29;13(5):1111. doi: 10.3390/life13051111. Life (Basel). 2023. PMID: 37240756 Free PMC article.
-
A non-invasive mouse model that recapitulates disuse-induced muscle atrophy in immobilized patients.Sci Rep. 2023 Dec 14;13(1):22201. doi: 10.1038/s41598-023-49732-8. Sci Rep. 2023. PMID: 38097709 Free PMC article.
-
Metformin Promotes Differentiation and Attenuates H2O2-Induced Oxidative Damage of Osteoblasts via the PI3K/AKT/Nrf2/HO-1 Pathway.Front Pharmacol. 2022 Mar 21;13:829830. doi: 10.3389/fphar.2022.829830. eCollection 2022. Front Pharmacol. 2022. PMID: 35387349 Free PMC article.
References
LinkOut - more resources
Full Text Sources