. 2020 Nov 19:29-30:100658.
doi: 10.1016/j.eclinm.2020.100658. eCollection 2020 Dec.

Education, biological ageing, all-cause and cause-specific mortality and morbidity: UK biobank cohort study

Affiliations

Education, biological ageing, all-cause and cause-specific mortality and morbidity: UK biobank cohort study

Marc Chadeau-Hyam et al. EClinicalMedicine. .

Abstract

Background: Socioeconomic position as measured by education may be embodied and affect the functioning of key physiological systems. Links between social disadvantage, its biological imprint, and cause-specific mortality and morbidity have not been investigated in large populations, and yet may point towards areas for public health interventions beyond targeting individual behaviours.

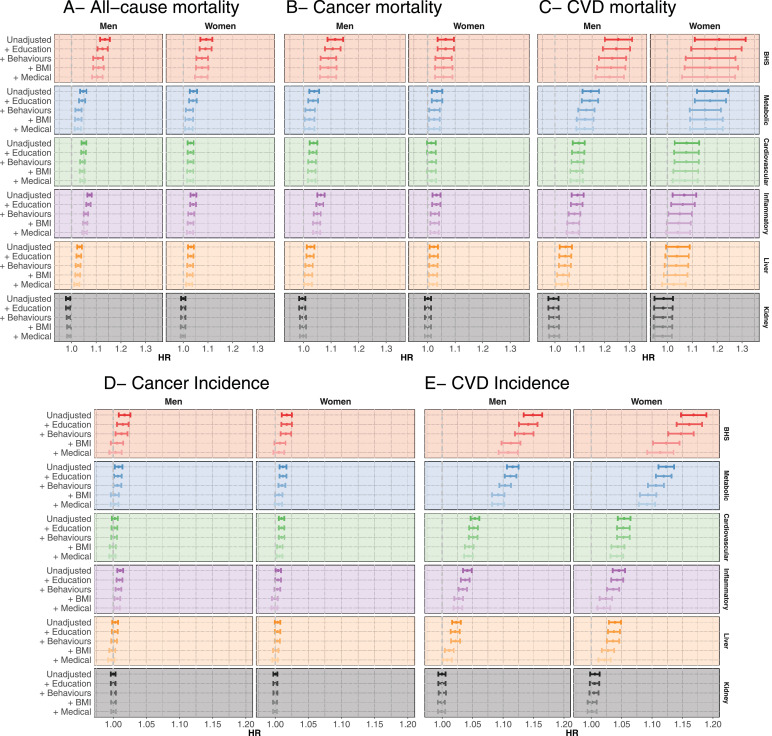
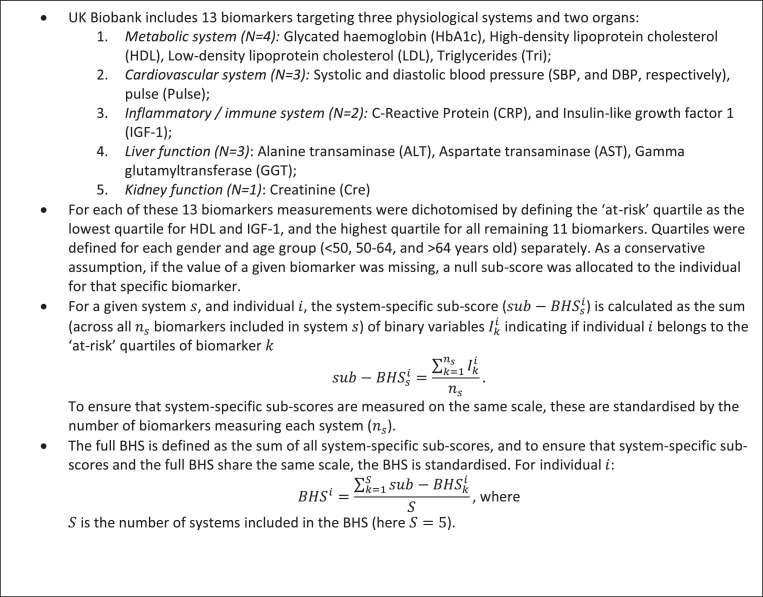
Methods: Using data from 366,748 UK Biobank participants with 13 biomarker measurements, we calculated a Biological Health Score (BHS, ranging from 0 to 1) capturing the level of functioning of five physiological systems. Associations between BHS and incidence of cardiovascular disease (CVD) and cancer, and mortality from all, CVD, cancer, and external causes were examined. We explored the role of education in these associations. Mendelian randomisation using genetic evidence was used to triangulate these findings.

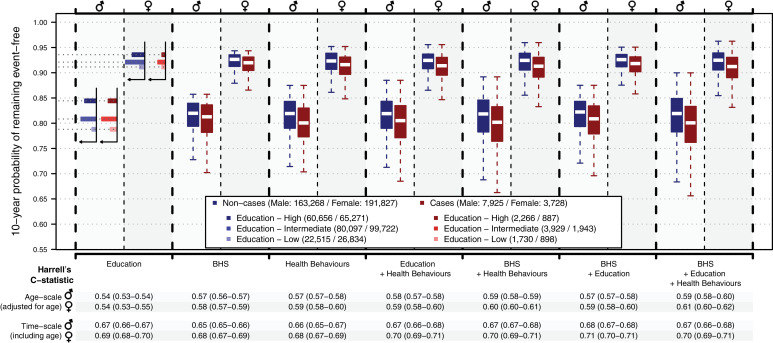
Findings: An increase in BHS of 0.1 was associated with all-cause (HR = 1.14 [1.12-1.16] and 1.09 [1.07-1.12] in men and women respectively), cancer (HR = 1.11 [1.09-1.14] and 1.07 [1.04-1.10]) and CVD (HR = 1.25 [1.20-1.31] and 1.21 [1.11-1.31]) mortality, CVD incidence (HR = 1.15 [1.13-1.16] and 1.17 [1.15-1.19]). These associations survived adjustment for education, lifestyle-behaviours, body mass index (BMI), co-morbidities and medical treatments. Mendelian randomisation further supported the link between the BHS and CVD incidence (HR = 1.31 [1.21-1.42]). The BHS contributed to CVD incidence prediction (age-adjusted C-statistic = 0.58), other than through education and health behaviours.

Interpretation: The BHS captures features of the embodiment of education, health behaviours, and more proximal unknown factors which all complementarily contribute to all-cause, cancer and CVD morbidity and premature death.

Keywords: Allostatic load mortality; Biological ageing; Biomarkers; Incidentpathologies; Mendelian randomisation; Prospective cohort; Social embedding; Uk biobank.


Conflict of interest statement

Prof. Elliott is the director of the MRC Centre of Environment and Health (MR/L01341X/1 and MC/S019669/1) and has no conflict of interest to disclose. Prof Kivimäki reports grants from the Medical Research Council (MR/R024227/1), National Institute on ageing (NIA), US (R01AG056477), Academy of Finland (311,492) and Helsinki Institute of Life Science, outside the submitted work. All other authors do not have any interests to disclose.

Figures

Fig. 1:
Fig. 1
(A) Distribution of the BHS by age groups and education levels for the study population excluding prevalent cases. For each category the point estimate of the mean BHS is represented by a bullet and the vertical line represents the 2.5–97.5% confidence interval of the score in that category for men (left) and women (right). Low, intermediate and high education are represented in red, green and blue, respectively. For both genders and within each age class, differences in mean BHS by education category were statistically significant (p < 0.001, mean BHS in the high education category as reference) as were trends in BHS across the three education categories for both genders and within each age class (p < 0.001). (B) BHS distribution for incident cancer (red), and CVD (blue) cases and for full population at the latest follow-up (black) in men (left), and women (right).
Fig. 2:
Fig. 2
Hazard ratio from the proportional hazard Cox model relating (A) all cause, (B) cancer and (C) cardiovascular mortality, cancer (D), and CVD (E) incidence and the Biological Health Score (BHS, red), the metabolic (blue), the cardiovascular (green), the inflammatory (purple), the kidney (orange), and the liver (grey) sub-scores. Hazard ratios are expressed as a risk change per 0.1 increase in the score. Results are presented for men (left) and women (right) and for the unadjusted model, for models sequentially adjusted for education group, lifestyle behaviours (smoking, physical activity, and alcohol consumption), BMI and medical status (number of comorbidities and treatments).
Fig. 3:
Fig. 3
Hazard ratio from the proportional hazard Cox model relating all-cause, cancer, and cardiovascular mortality, cancer and cardiovascular disease incidence, and education level (considering the high education group as reference). Results are presented for men (left) and women (right) and for the unadjusted model, and for models sequentially adjusted for behaviours and lifestyle (smoking, physical activity, and alcohol consumption), BMI, comorbidities and treatments, and BHS.
Fig. 4:
Fig. 4
Distribution of individual probabilities from Cox proportional hazards using (i) Education, (ii) the BHS, (iii) Health behaviours (BMI, smoking, alcohol consumption, and physical activity), (iv) Education and Health behaviours, (v) BHS and Health behaviours, (vi) BHS and Education, and (vii) BHS, Education and Health behaviours as predictors of CVD incidence. Models were all adjusted for reported medical status (number of co-morbidities and medical treatments). Results are presented for non-cases (in blue) and cases (in red). In the model only including Education as predictor, the survival probability is discrete and has one value for each education group. The corresponding distribution is represented as a horizontal histogram showing the survival probability for the low (lightest tint), intermediate (medium tint), and high (solid colour) education group. Predictive performances of the models are summarised by their mean (and 2.5th 97.5th percentile confidence interval) of the Harrell's C-statistic for the age adjusted survival model (using age as timescale). We also report the Harrell's C-statistic for the model using time since enrolment as timescale and include age as predictor in all models. Results are presented for each model (X axis) in men and women separately.
Box 1:
Box 1
UK-Biobank biomarkers and BHS Calculation.

References

    1. Hertzman C. Health and Human Society: wealthier nations are not always healthier, and efforts to improve health can be swamped by the effects of inequality and conflict. Am. Sci. 2001;89(6):538–545.
    1. Stringhini S., Carmeli C., Jokela M. Socioeconomic status and the 25 x 25 risk factors as determinants of premature mortality: a multicohort study and meta-analysis of 1.7 million men and women. Lancet. 2017;389(10075):1229–1237. - PMC - PubMed
    1. Foster H.M.E., Celis-Morales C.A., Nicholl B.I. The effect of socioeconomic deprivation on the association between an extended measurement of unhealthy lifestyle factors and health outcomes: a prospective analysis of the UK Biobank cohort. The Lancet Public Health. 2018;3(12):e576–ee85. - PubMed
    1. Kivimäki M., Vahtera J., Tabák A.G. Neighbourhood socioeconomic disadvantage, risk factors, and diabetes from childhood to middle age in the Young Finns Study: a cohort study. The Lancet Public Health. 2018;3(8):e365–ee73. - PMC - PubMed
    1. Petrovic D., de Mestral C., Bochud M. The contribution of health behaviors to socioeconomic inequalities in health: a systematic review. Prev Med. 2018;113:15–31. - PubMed