

International values for haemoglobin distributions in healthy pregnant women
- PMID: 33437954
- PMCID: PMC7788439
- DOI: 10.1016/j.eclinm.2020.100660
International values for haemoglobin distributions in healthy pregnant women
Abstract
Background: Anaemia in pregnancy is a global health problem with associated morbidity and mortality.
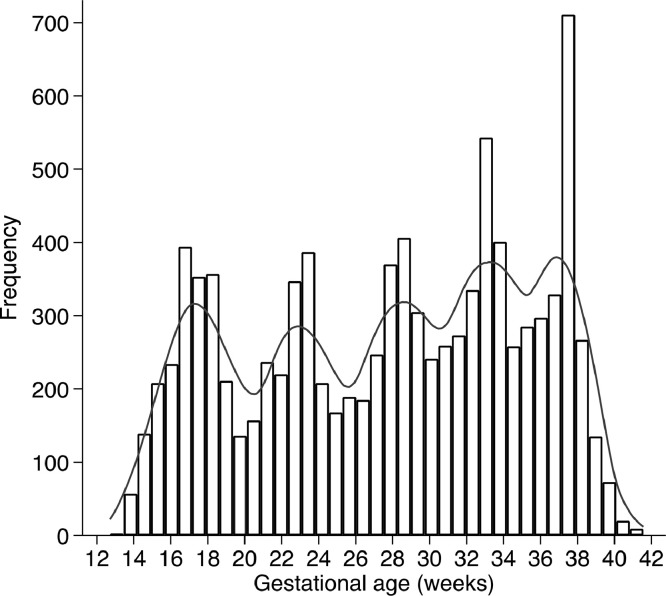
Methods: A secondary analysis of prospective, population-based study from 2009 to 2016 to generate maternal haemoglobin normative centiles in uncomplicated pregnancies in women receiving optimal antenatal care. Pregnant women were enrolled <14 weeks' gestation in the Fetal Growth Longitudinal Study (FGLS) of the INTERGROWTH-21st Project which involved eight geographically diverse urban areas in Brazil, China, India, Italy, Kenya, Oman, United Kingdom and United States. At each 5 ± 1 weekly visit until delivery, information was collected about the pregnancy, as well as the results of blood tests taken as part of routine antenatal care that complemented the study's requirements, including haemoglobin values.
Findings: A total of 3502 (81%) of 4321 women who delivered a live, singleton newborn with no visible congenital anomalies, contributed at least one haemoglobin value. Median haemoglobin concentrations ranged from 114.6 to 121.4 g/L, 94 to 103 g/L at the 3rd centile, and from 135 to 141 g/L at the 97th centile. The lowest values were seen between 31 and 32 weeks' gestation, representing a mean drop of 6.8 g/L compared to 14 weeks' gestation. The percentage variation in maternal haemoglobin within-site was 47% of the total variance compared to 13% between sites.
Interpretation: We have generated International, gestational age-specific, smoothed centiles for maternal haemoglobin concentration compatible with better pregnancy outcomes, as well as adequate neonatal and early childhood morbidity, growth and development up to 2 years of age.
Funding: Bill & Melinda Gates Foundation Grant number 49038.
Keywords: Anaemia; Healthy pregnant women; INTERGROWTH-21st; International Haemoglobin values.
© 2020 World Health Organization.
Conflict of interest statement
ATP reports personal fees from BJOG, grants from Bill and Melinda Gates Foundation, grants from European Research Council, grants from National Institute of Health Research, grants from Grand Challenges Research Fund, outside the submitted work. JPPR and MNGC are full time staff members of the WHO. The authors alone are responsible for the views expressed in this publication and they do not necessarily represent the official position, decisions, policy or views of the World Health Organization. The WHO receives partial financial support from the Bill & Melinda Gates Foundation, and the US Centers for Disease Control and Prevention to support its work in the area of nutrition. Donors do not fund specific guidelines and do not participate in any decision related to the guideline development process. All other authors declare no competing interests.
Figures


References
-
- Daru J., Zamora J., Fernandez-Felix B.M., Vogel J., Oladapo O.T., Morisaki N. Risk of maternal mortality in women with severe anaemia during pregnancy and post-partum: a multilevel analysis. Lancet Glob Health. 2018;6(5):e548–ee54. - PubMed
-
- Drukker L., Hants Y., Farkash R., Ruchlemer R., Samueloff A., Grisaru-Granovsky S. Iron deficiency anemia at admission for labor and delivery is associated with an increased risk for Cesarean section and adverse maternal and neonatal outcomes. Transfusion. 2015;55(12):2799–2806. - PubMed
-
- Pasricha S.R., Colman K., Centeno-Tablante E., Garcia-Casal M.N., Pena-Rosas J.P. Revisiting WHO haemoglobin thresholds to define anaemia in clinical medicine and public health. Lancet Haematol. 2018;5(2):e60–ee2. - PubMed
-
- Rahman M.M., Abe S.K., Rahman M.S., Kanda M., Narita S., Bilano V. Maternal anemia and risk of adverse birth and health outcomes in low- and middle-income countries: systematic review and meta-analysis. Am J Clin Nutr. 2016;103(2):495–504. - PubMed
-
- Owen P., Donnet M.L., Ogston S.A., Christie A.D., Howie P.W., Patel N.B. Standards for ultrasound fetal growth velocity. BJOG Int J Obstet Gynaecol. 1996;103(1):60–69. - PubMed
Grants and funding
LinkOut - more resources
Full Text Sources
Miscellaneous
